ΕΘΝΙΚΟ ΜΕΤΣΟΒΙΟ ΠΟΛΥΤΕΧΝΕΙΟ
ΕΘΝΙΚΟ ΜΕΤΣΟΒΙΟ ΠΟΛΥΤΕΧΝΕΙΟ
ΕΘΝΙΚΟ ΜΕΤΣΟΒΙΟ ΠΟΛΥΤΕΧΝΕΙΟ

You also want an ePaper? Increase the reach of your titles
YUMPU automatically turns print PDFs into web optimized ePapers that Google loves.
Service time {days}<br />
C/C 0 %<br />
25<br />
20<br />
15<br />
10<br />
5<br />
0<br />
80<br />
60<br />
40<br />
20<br />
0<br />
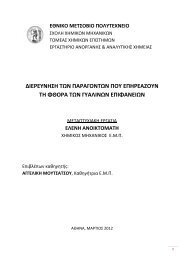
Bisphenol-A<br />
0 5 10 15 20 25<br />
Time {days}<br />
Figure 6 : Breakthrough curves of Bisphenol-A (left) and Ibuprofen (right)<br />
(column A is -○-, column B is -□-, column C is -∆- and column D is -×-).<br />
Bohart-Adams Bisphenol-A<br />
R² = 0,9391<br />
0 0,05 0,1 0,15 0,2<br />
GAC bed depth {m}<br />
Figure 7 : Bohart-Adams lines of Bisphenol-A (left) and Ibuprofen (right).<br />
Time-modified second batch experiment<br />
As mentioned above, during the second batch experiment there were several<br />
problems arisen with the pilot column system. Those problems are shown in every<br />
breakthrough curve of the second batch experiment as a “temporary stabilization” of<br />
the curve. In this section those “stabilizations” were counted as “dead times” and a<br />
proper time modification was applied for every curve to restore its continuity.<br />
~ x ~<br />
Service time {days}<br />
C/C 0 %<br />
100<br />
14<br />
12<br />
10<br />
80<br />
60<br />
40<br />
20<br />
8<br />
6<br />
4<br />
2<br />
0<br />
0<br />
Ibuprofen<br />
0 5 10 15 20 25<br />
Time {days}<br />
Bohart-Adams Ibuprofen<br />
R² = 0,9492<br />
0 0,05 0,1 0,15 0,2<br />
GAC bed depth {m}