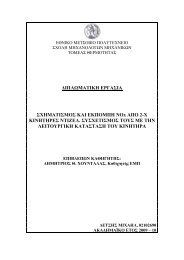
ΕΘΝΙΚΟ ΜΕΤΣΟΒΙΟ ΠΟΛΥΤΕΧΝΕΙΟ
ΕΘΝΙΚΟ ΜΕΤΣΟΒΙΟ ΠΟΛΥΤΕΧΝΕΙΟ
ΕΘΝΙΚΟ ΜΕΤΣΟΒΙΟ ΠΟΛΥΤΕΧΝΕΙΟ

You also want an ePaper? Increase the reach of your titles
YUMPU automatically turns print PDFs into web optimized ePapers that Google loves.
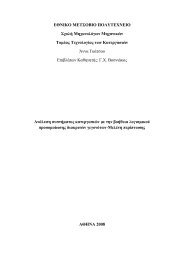
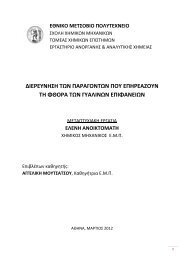
C/C 0 %<br />
During the second batch experiment the column B was shut down in the<br />
middle of the batch, leaving the system with only three columns. Since none of the<br />
EC’s had breakthrough at column A when column B was shut down the system<br />
continued assuming column C as column B and column D as column C. Also, in the<br />
system many hydraulic problems had arisen and microbiological activity was<br />
observed, particularly in column A.<br />
From the results of this batch experiment breakthrough curves for each EC<br />
were made (for example Figure 3 shows the breakthrough curves from the second<br />
batch experiment of the EDC Bisphenol-A and the PPCP Ibuprofen) and the<br />
breakthrough limits were established. The limits were expressed as C/C0, were C0 is<br />
the concentration in the 200L bottle and were 20% for PPCPs, 10% for Bisphenol-A<br />
and 7,5% for Triclosan. The Bohart-Adams model was applied for each EC and the<br />
adsorptive capacity (N0) and adsorption rate constant (K) were calculated. Finally, for<br />
each EC the critical bed depth (Lcritical) was calculated from the constants N0 and K.<br />
From the results of each EC about the Lcritical is seems that the bed depth<br />
chosen (0,20 m) was too much in order to get proper results in a reasonable amount of<br />
time (each EC gave breakthrough point in column A after about 20 days from the start<br />
of the experiment). Unfortunately, the results from the second batch experiment are<br />
not trustworthy, apart from the problems arisen, because for the Bohart-Adams lines<br />
there were only breakthroughs on column A and the last sample from column B. So,<br />
for the lines there were only two spots, from which the one was uncertain.<br />
80<br />
60<br />
40<br />
20<br />
0<br />
Bisphenol-A<br />
0 10 20 30 40 50<br />
Time {days}<br />
Figure 3 : Breakthrough curves of Bisphenol-A (left) and Ibuprofen (right)<br />
(column A is -○-, column B is -□-, column C is -∆- and column D is -×-).<br />
~ vii ~<br />
C/C 0 %<br />
100<br />
80<br />
60<br />
40<br />
20<br />
0<br />
Ibuprofen<br />
0 10 20 30 40 50<br />
Time {days}