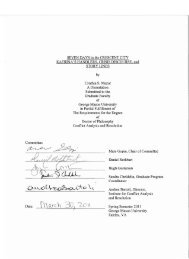
Sample A: Cover Page of Thesis, Project, or Dissertation Proposal
Sample A: Cover Page of Thesis, Project, or Dissertation Proposal
Sample A: Cover Page of Thesis, Project, or Dissertation Proposal
You also want an ePaper? Increase the reach of your titles
YUMPU automatically turns print PDFs into web optimized ePapers that Google loves.
described above. In Figure 2.3, the top row presents the average probe intensities per probe<br />
remaining in the cleansed array file (after removing values that fall outside the linear range). In<br />
Figure 2.3, the bottom row shows the number <strong>of</strong> such probes remaining per array, with mean and<br />
standard deviation lines provided f<strong>or</strong> comparison. The arrays were grouped in the plots acc<strong>or</strong>ding<br />
to their batch membership and are so labeled (‘X’ denotes batch 10; there is no batch 2 n<strong>or</strong> 9).<br />
Batch 3 as a whole is skewed to the lower end in both tests, so the entire set <strong>of</strong> arrays was<br />
removed from subsequent analyses. Since the probe sequence based filters remove exactly the<br />
same probes in all cases, the difference as to which specific probes are removed between the<br />
criteria is thus a result <strong>of</strong> the linear range filter. We believe that Batch 3 suffers from sample<br />
degradation since the arrays demonstrate both lower average probe intensity and fewer overall<br />
probes. In terms <strong>of</strong> the sample classes, the N<strong>or</strong>mal samples (in red) were processed across several<br />
batches and do not show markedly different overall responses than the disease samples in the<br />
same batches.<br />
47


![[Sample B: Approval/Signature Sheet] - George Mason University](https://img.yumpu.com/21978828/1/190x245/sample-b-approval-signature-sheet-george-mason-university.jpg?quality=85)
![[Sample B: Approval/Signature Sheet] - George Mason University](https://img.yumpu.com/18694905/1/190x245/sample-b-approval-signature-sheet-george-mason-university.jpg?quality=85)

![[Sample B: Approval/Signature Sheet] - George Mason University](https://img.yumpu.com/18694552/1/189x260/sample-b-approval-signature-sheet-george-mason-university.jpg?quality=85)
![[Sample B: Approval/Signature Sheet] - George Mason University](https://img.yumpu.com/18694474/1/190x245/sample-b-approval-signature-sheet-george-mason-university.jpg?quality=85)