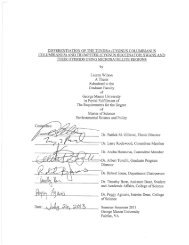
Sample A: Cover Page of Thesis, Project, or Dissertation Proposal
Sample A: Cover Page of Thesis, Project, or Dissertation Proposal
Sample A: Cover Page of Thesis, Project, or Dissertation Proposal
Create successful ePaper yourself
Turn your PDF publications into a flip-book with our unique Google optimized e-Paper software.
Inf<strong>or</strong>mation gain ratios (equations 2 and 3) were calculated per probe and ProbeSet, based upon<br />
their perf<strong>or</strong>mance as implemented in the k-means clustering alg<strong>or</strong>ithm, f<strong>or</strong> three distinct clusters.<br />
The average gain ratio f<strong>or</strong> all <strong>of</strong> the probes in a ProbeSet was determined. However f<strong>or</strong> this<br />
analysis, the gain ratio calculated f<strong>or</strong> the average ProbeSet intensity was evaluated to eliminate<br />
less inf<strong>or</strong>mative ProbeSets. It is proposed here that the differences observed between the<br />
aggregate ProbeSet and the average probe perf<strong>or</strong>mance can by utilized in a way similar to the<br />
suggestion f<strong>or</strong> using the ‘Signal’ ProbeSets in Chapter 3, to discern transcript regions relevant to<br />
the phenotype. Pri<strong>or</strong> to calculating the gain ratio, n<strong>or</strong>malization transf<strong>or</strong>mation was perf<strong>or</strong>med on<br />
the data (probe and ProbeSet). Let xi,j represent the data as 4,258 ProbeSets by 155 samples and<br />
was scaled as<br />
xi, j " (xi,<br />
j - x i )/ * i . (5.1)<br />
Where x is the mean signal intensity across the samples and sigma the variance across samples.<br />
Hartigan-Wong Clustering was done f<strong>or</strong> 50 random centers (nstarts=50) [9], which appeared to<br />
be sufficient to minimize the Euclidean sum <strong>of</strong> squares. This clustering approach is the default<br />
and acc<strong>or</strong>ding to the R documentation it typically demonstrates the best perf<strong>or</strong>mance [9]. The<br />
two best solutions were then chosen, and their gain ratios were calculated, given their distinct<br />
cluster centers. These solutions were selected as optimal f<strong>or</strong> the adenocarcinoma clustering,<br />
having the smallest Euclidean sum <strong>of</strong> squares and sub-optimal f<strong>or</strong> either the squamous <strong>or</strong> n<strong>or</strong>mal<br />
clustering. The decision to use both best solutions was an eff<strong>or</strong>t to compensate f<strong>or</strong> the ‘no free<br />
lunch the<strong>or</strong>y’ [10], in that if the clustering was appropriate f<strong>or</strong> both adenocarcinoma and n<strong>or</strong>mal<br />
samples, the clustering underperf<strong>or</strong>ms f<strong>or</strong> the squamous samples. Fifty clustering attempts were<br />
typically sufficient to find both ‘best’ centers, and the gain ratios f<strong>or</strong> the two centers were<br />
116



![[Sample B: Approval/Signature Sheet] - George Mason University](https://img.yumpu.com/21978828/1/190x245/sample-b-approval-signature-sheet-george-mason-university.jpg?quality=85)
![[Sample B: Approval/Signature Sheet] - George Mason University](https://img.yumpu.com/18694905/1/190x245/sample-b-approval-signature-sheet-george-mason-university.jpg?quality=85)



![[Sample B: Approval/Signature Sheet] - George Mason University](https://img.yumpu.com/18694552/1/189x260/sample-b-approval-signature-sheet-george-mason-university.jpg?quality=85)
![[Sample B: Approval/Signature Sheet] - George Mason University](https://img.yumpu.com/18694474/1/190x245/sample-b-approval-signature-sheet-george-mason-university.jpg?quality=85)