Sample A: Cover Page of Thesis, Project, or Dissertation Proposal
Sample A: Cover Page of Thesis, Project, or Dissertation Proposal
Sample A: Cover Page of Thesis, Project, or Dissertation Proposal
You also want an ePaper? Increase the reach of your titles
YUMPU automatically turns print PDFs into web optimized ePapers that Google loves.
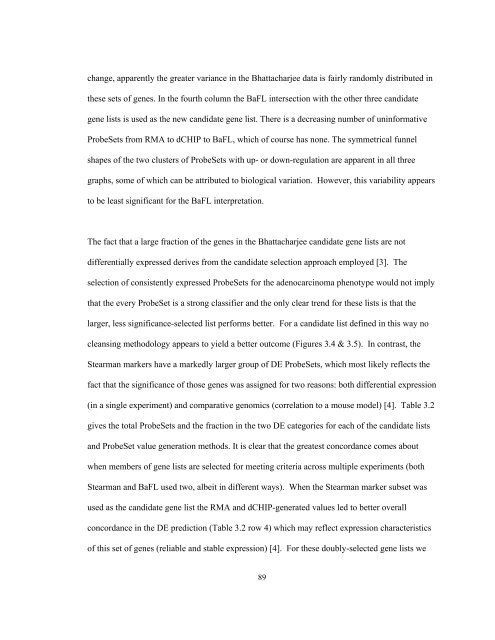
change, apparently the greater variance in the Bhattacharjee data is fairly randomly distributed in<br />
these sets <strong>of</strong> genes. In the fourth column the BaFL intersection with the other three candidate<br />
gene lists is used as the new candidate gene list. There is a decreasing number <strong>of</strong> uninf<strong>or</strong>mative<br />
ProbeSets from RMA to dCHIP to BaFL, which <strong>of</strong> course has none. The symmetrical funnel<br />
shapes <strong>of</strong> the two clusters <strong>of</strong> ProbeSets with up- <strong>or</strong> down-regulation are apparent in all three<br />
graphs, some <strong>of</strong> which can be attributed to biological variation. However, this variability appears<br />
to be least significant f<strong>or</strong> the BaFL interpretation.<br />
The fact that a large fraction <strong>of</strong> the genes in the Bhattacharjee candidate gene lists are not<br />
differentially expressed derives from the candidate selection approach employed [3]. The<br />
selection <strong>of</strong> consistently expressed ProbeSets f<strong>or</strong> the adenocarcinoma phenotype would not imply<br />
that the every ProbeSet is a strong classifier and the only clear trend f<strong>or</strong> these lists is that the<br />
larger, less significance-selected list perf<strong>or</strong>ms better. F<strong>or</strong> a candidate list defined in this way no<br />
cleansing methodology appears to yield a better outcome (Figures 3.4 & 3.5). In contrast, the<br />
Stearman markers have a markedly larger group <strong>of</strong> DE ProbeSets, which most likely reflects the<br />
fact that the significance <strong>of</strong> those genes was assigned f<strong>or</strong> two reasons: both differential expression<br />
(in a single experiment) and comparative genomics (c<strong>or</strong>relation to a mouse model) [4]. Table 3.2<br />
gives the total ProbeSets and the fraction in the two DE categ<strong>or</strong>ies f<strong>or</strong> each <strong>of</strong> the candidate lists<br />
and ProbeSet value generation methods. It is clear that the greatest conc<strong>or</strong>dance comes about<br />
when members <strong>of</strong> gene lists are selected f<strong>or</strong> meeting criteria across multiple experiments (both<br />
Stearman and BaFL used two, albeit in different ways). When the Stearman marker subset was<br />
used as the candidate gene list the RMA and dCHIP-generated values led to better overall<br />
conc<strong>or</strong>dance in the DE prediction (Table 3.2 row 4) which may reflect expression characteristics<br />
<strong>of</strong> this set <strong>of</strong> genes (reliable and stable expression) [4]. F<strong>or</strong> these doubly-selected gene lists we<br />
89



![[Sample B: Approval/Signature Sheet] - George Mason University](https://img.yumpu.com/21978828/1/190x245/sample-b-approval-signature-sheet-george-mason-university.jpg?quality=85)

![[Sample B: Approval/Signature Sheet] - George Mason University](https://img.yumpu.com/18694905/1/190x245/sample-b-approval-signature-sheet-george-mason-university.jpg?quality=85)




![[Sample B: Approval/Signature Sheet] - George Mason University](https://img.yumpu.com/18694552/1/189x260/sample-b-approval-signature-sheet-george-mason-university.jpg?quality=85)

![[Sample B: Approval/Signature Sheet] - George Mason University](https://img.yumpu.com/18694474/1/190x245/sample-b-approval-signature-sheet-george-mason-university.jpg?quality=85)