The ICA Guide
The ICA Guide
The ICA Guide

Create successful ePaper yourself
Turn your PDF publications into a flip-book with our unique Google optimized e-Paper software.
What if the stock market doesn’t go up?<br />
While the recent decline was an exceptionally disappointing one for the market, there have been other,<br />
less dramatic downturns, as well as periods of little change. <strong>ICA</strong>’s professional management has frequently<br />
enabled the fund to do better than the market. <strong>The</strong> charts below show how <strong>ICA</strong> compared to the S&P<br />
500 during two past periods when the stock market was relatively “flat.”<br />
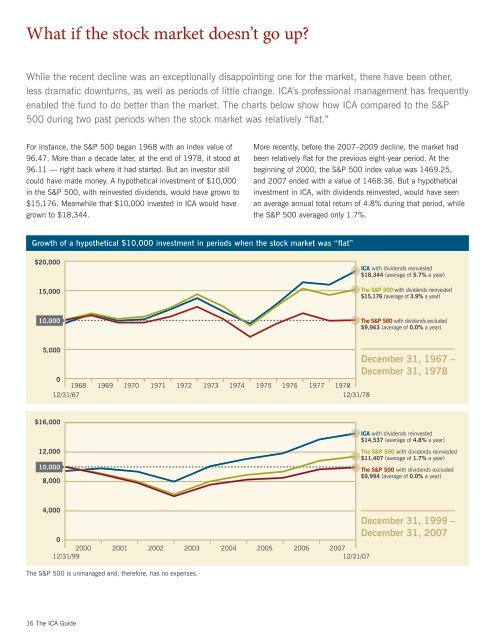
For instance, the S&P 500 began 1968 with an index value of<br />
96.47. More than a decade later, at the end of 1978, it stood at<br />
96.11 — right back where it had started. But an investor still<br />
could have made money. A hypothetical investment of $10,000<br />
in the S&P 500, with reinvested dividends, would have grown to<br />
$15,176. Meanwhile that $10,000 invested in <strong>ICA</strong> would have<br />
grown to $18,344.<br />
Growth of a hypothetical $10,000 investment in periods when the stock market was “flat”<br />
$20,000<br />
15,000<br />
10,000<br />
5,000<br />
$16,000<br />
12,000<br />
10,000<br />
0<br />
1968 1969 1970 1971 1972 1973 1974 1975 1976 1977 1978<br />
12/31/67 12/31/78<br />
8,000<br />
4,000<br />
0<br />
2000 2001 2002 2003 2004 2005 2006 2007<br />
12/31/99 12/31/07<br />
<strong>The</strong> S&P 500 is unmanaged and, therefore, has no expenses.<br />
16 <strong>The</strong> <strong>ICA</strong> <strong>Guide</strong><br />
More recently, before the 2007–2009 decline, the market had<br />
been relatively flat for the previous eight-year period. At the<br />
beginning of 2000, the S&P 500 index value was 1469.25,<br />
and 2007 ended with a value of 1468.36. But a hypothetical<br />
investment in <strong>ICA</strong>, with dividends reinvested, would have seen<br />
an average annual total return of 4.8% during that period, while<br />
the S&P 500 averaged only 1.7%.<br />
<strong>ICA</strong> with dividends reinvested<br />
$18,344 (average of 5.7% a year)<br />
<strong>The</strong> S&P 500 with dividends reinvested<br />
$15,176 (average of 3.9% a year)<br />
<strong>The</strong> S&P 500 with dividends excluded<br />
$9,963 (average of 0.0% a year)<br />
December 31, 1967 –<br />
December 31, 1978<br />
<strong>ICA</strong> with dividends reinvested<br />
$14,537 (average of 4.8% a year)<br />
<strong>The</strong> S&P 500 with dividends reinvested<br />
$11,407 (average of 1.7% a year)<br />
<strong>The</strong> S&P 500 with dividends excluded<br />
$9,994 (average of 0.0% a year)<br />
December 31, 1999 –<br />
December 31, 2007