

WAVES AND VIBRATIONS IN INHOMOGENEOUS STRUCTURES ...
WAVES AND VIBRATIONS IN INHOMOGENEOUS STRUCTURES ...
WAVES AND VIBRATIONS IN INHOMOGENEOUS STRUCTURES ...

You also want an ePaper? Increase the reach of your titles
YUMPU automatically turns print PDFs into web optimized ePapers that Google loves.
Phononic band-gap optimization<br />
^_<br />
_-<br />
M M CO]<br />
, I<br />
M<br />
r<br />
,<br />
/Ii~L~ I , /~l band 5, (o5<br />
.t.1 Ir B tA: U............... I' ' band 4, 04<br />
^<br />
A~-_t~ ~~. ' 'L<br />
X -"J / band<br />
k<br />
3, (3<br />
'<br />
|r J<br />
band 2, (02<br />
!<br />
I<br />
&"tg,,^f -,;!|i :1g is<br />
/ " 'band 1, (o<br />
_~B Fr x M r k<br />
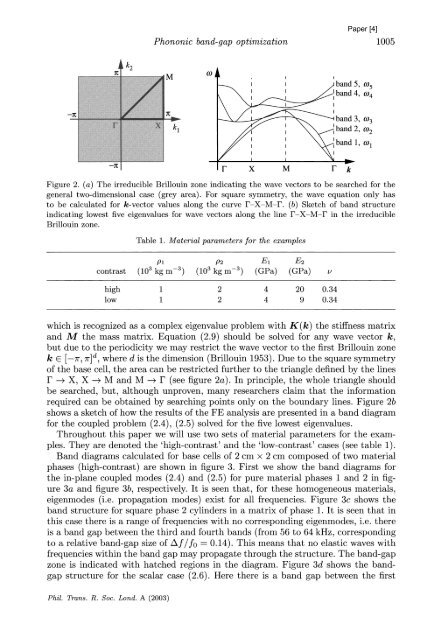
Figure 2. (a) The irreducible Brillouin zone indicating the wave vectors to be searched for the<br />
general two-dimensional case (grey area). For square symmetry, the wave equation only has<br />
to be calculated for k-vector values along the curve F-X-M-F. (b) Sketch of band structure<br />
indicating lowest five eigenvalues for wave vectors along the line F-X-M-F in the irreducible<br />
Brillouin zone.<br />
Table 1. Material parameters for the examples<br />
pl P2 E1 E2<br />
contrast (103 kg m-3) (103 kg m-3) (GPa) (GPa) v<br />
high 1 2 4 20 0.34<br />
low 1 2 4 9 0.34<br />
which is recognized as a complex eigenvalue problem with K(k) the stiffness matrix<br />
and M the mass matrix. Equation (2.9) should be solved for any wave vector k,<br />
but due to the periodicity we may restrict the wave vector to the first Brillouin zone<br />
k E [-Tr, 7r]d, where d is the dimension (Brillouin 1953). Due to the square symmetry<br />
of the base cell, the area can be restricted further to the triangle defined by the lines<br />
F -+ X, X -+ M and M -+ F (see figure 2a). In principle, the whole triangle should<br />
be searched, but, although unproven, many researchers claim that the information<br />
required can be obtained by searching points only on the boundary lines. Figure 2b<br />
shows a sketch of how the results of the FE analysis are presented in a band diagram<br />
for the coupled problem (2.4), (2.5) solved for the five lowest eigenvalues.<br />
Throughout this paper we will use two sets of material parameters for the exam-<br />
ples. They are denoted the 'high-contrast' and the 'low-contrast' cases (see table 1).<br />
Band diagrams calculated for base cells of 2 cm x 2 cm composed of two material<br />
phases (high-contrast) are shown in figure 3. First we show the band diagrams for<br />
the in-plane coupled modes (2.4) and (2.5) for pure material phases 1 and 2 in fig-<br />
ure 3a and figure 3b, respectively. It is seen that, for these homogeneous materials,<br />
eigenmodes (i.e. propagation modes) exist for all frequencies. Figure 3c shows the<br />
band structure for square phase 2 cylinders in a matrix of phase 1. It is seen that in<br />
this case there is a range of frequencies with no corresponding eigenmodes, i.e. there<br />
is a band gap between the third and fourth bands (from 56 to 64 kHz, corresponding<br />
to a relative band-gap size of Af/fo = 0.14). This means that no elastic waves with<br />
frequencies within the band gap may propagate through the structure. The band-gap<br />
zone is indicated with hatched regions in the diagram. Figure 3d shows the band-<br />
gap structure for the scalar case (2.6). Here there is a band gap between the first<br />
Phil. Trans. R. Soc. Lond. A (2003)<br />
I<br />
1005


