Summary for simple linear regression Dependent data x Linear ...
Summary for simple linear regression Dependent data x Linear ...
Summary for simple linear regression Dependent data x Linear ...
You also want an ePaper? Increase the reach of your titles
YUMPU automatically turns print PDFs into web optimized ePapers that Google loves.
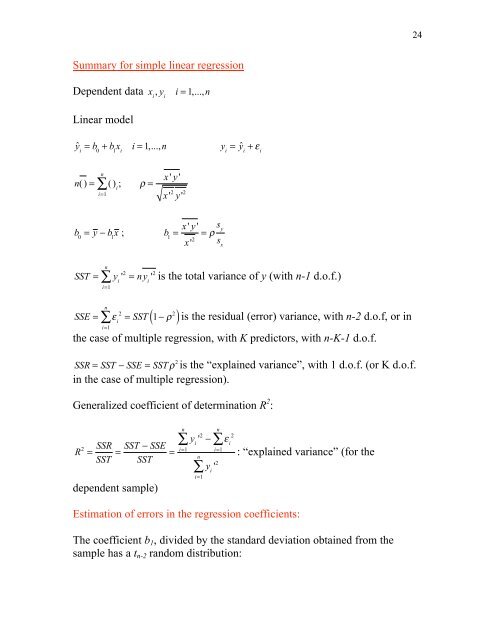
<strong>Summary</strong> <strong>for</strong> <strong>simple</strong> <strong>linear</strong> <strong>regression</strong><br />
<strong>Dependent</strong> <strong>data</strong> x i , y i<br />
<strong>Linear</strong> model<br />
ˆy i = b 0 + b 1 x i i = 1,...,n<br />
n<br />
n( ) = ! ( ) ; " =<br />
i<br />
i=1<br />
b0 = y ! b x ; 1<br />
n<br />
x' y'<br />
x' 2 y' 2<br />
b 1 =<br />
i = 1,...,n<br />
x' y'<br />
x' 2 = ! sy sx y i = ˆy i + ! i<br />
SST = y ' i 2<br />
! = ny ' i 2 is the total variance of y (with n-1 d.o.f.)<br />
i=1<br />
n<br />
2<br />
SSE = " ! = SST 1# $ i<br />
i=1<br />
2<br />
( ) is the residual (error) variance, with n-2 d.o.f, or in<br />
the case of multiple <strong>regression</strong>, with K predictors, with n-K-1 d.o.f.<br />
SSR = SST ! SSE = SST "2 is the “explained variance”, with 1 d.o.f. (or K d.o.f.<br />
in the case of multiple <strong>regression</strong>).<br />
Generalized coefficient of determination R 2 :<br />
R 2 = SSR<br />
SST<br />
= SST ! SSE<br />
SST<br />
dependent sample)<br />
=<br />
y ' i 2<br />
n<br />
n<br />
2<br />
" ! " # i<br />
i=1 i=1<br />
y ' i 2<br />
n<br />
Estimation of errors in the <strong>regression</strong> coefficients:<br />
"<br />
i=1<br />
: “explained variance” (<strong>for</strong> the<br />
The coefficient b1, divided by the standard deviation obtained from the<br />
sample has a tn-2 random distribution:<br />
24
! E(b )<br />
1 1<br />
" SSE %<br />
#<br />
$ n ! 2&<br />
' / x' ~ t<br />
n<br />
n!2<br />
2<br />
( i<br />
i=1<br />
This means that we can test whether b1 is significantly different from zero by<br />
using the t table 2 with n-2 d.o.f. at a level of significance of, let’s say 5%.<br />
The 95% confidence interval <strong>for</strong> b1 is<br />
)<br />
+ b ! 1<br />
* +<br />
Similarly<br />
" SSE %<br />
#<br />
$ n ! 2&<br />
' / x' n<br />
2<br />
i<br />
b 0 ! E(b 0 )<br />
" SSE % 1<br />
#<br />
$ n ! 2&<br />
' *<br />
n<br />
determined.<br />
n<br />
(<br />
i=1<br />
( * t ,b +<br />
.025,n!2 1<br />
i=1<br />
2<br />
x'i " SSE %<br />
#<br />
$ n ! 2&<br />
' / x' n<br />
2<br />
i<br />
( * t .025,n!2<br />
i=1<br />
~ t n!2 and the limits of confidence <strong>for</strong> b0 are similarly<br />
For a new predictor x0, the limits of confidence of the new prediction can be<br />
obtained from the fact that it has a distribution<br />
y(x 0 ) ! b 0 ! b 1 x 0<br />
" SSE % 1<br />
#<br />
$ n ! 2&<br />
' * 1+<br />
n + x "<br />
$ ! x 0<br />
$<br />
n<br />
$<br />
(<br />
#<br />
$<br />
( ) 2<br />
i=1<br />
2<br />
x'i ~ tn!2 %<br />
'<br />
'<br />
'<br />
&<br />
'<br />
We will see more about this after the multiple <strong>regression</strong> discussion.<br />
Note that a “naïve” estimation of the <strong>for</strong>ecast error variance<br />
! 2 = 1<br />
n<br />
2<br />
" ! # i<br />
n<br />
SSE<br />
seriously underestimates the error even <strong>for</strong> the dependent<br />
n<br />
i=1<br />
2 2 1<br />
sample, <strong>for</strong> which the correct <strong>for</strong>mula is s = ! = !<br />
n<br />
,<br />
.<br />
-.<br />
n<br />
2<br />
" ! = i<br />
i=1<br />
SSE<br />
n # K # 1 .<br />
25
Analysis of residuals: Ideally the residuals (<strong>for</strong>ecast errors) should look<br />
random, without trends. If we find, <strong>for</strong> example<br />
y<br />
x<br />
y-b0-b1x<br />
If there is a trend, it is better to change variables, <strong>for</strong> the predictor,<br />
e.g., y = b 0 + b 1 f (x), y = b 0 + b 1 x + b 2 x2 + ... + b K x K . Note that this is still a <strong>linear</strong><br />
<strong>regression</strong>, with multiple predictors, even if the predictors are non<strong>linear</strong><br />
functions of x.<br />
0<br />
x<br />
26


