Reproduction performances and conditions of group-housed non ...
Reproduction performances and conditions of group-housed non ...
Reproduction performances and conditions of group-housed non ...

You also want an ePaper? Increase the reach of your titles
YUMPU automatically turns print PDFs into web optimized ePapers that Google loves.
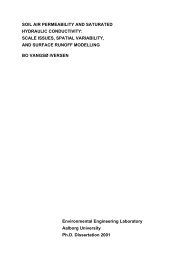
- Paper III -<br />
3.2 Between-farm <strong>and</strong> within-farm variation <strong>of</strong> indicators<br />
In Figure 1, the variation between herds <strong>and</strong> between batches within herds are shown for<br />
some <strong>of</strong> the indicators <strong>and</strong> in Table 6, the effects <strong>of</strong> herd <strong>and</strong> batches are given.<br />
Table 6. Effect <strong>of</strong> herd <strong>and</strong> farrowing batch within herd on level <strong>of</strong> indicators<br />
Variance component % <strong>of</strong> variation explained Significance<br />
Herd (σk 2 ) Batch (σl(k) 2 ) Sow (ε ) Herd Batch Sow Herd Batch<br />
Back fat W 1.8 2 1.1 2 4.0 2 16 5 79 * *<br />
Back fat AM 1.5 2 1.2 2 3.8 2 12 8 80 * *<br />
Back fat F 2.8 2 0 5.0 2 23 0 77 * -<br />
Back fat gain W → AM 0.01 2 0.02 2 0.06 2 5 8 87 ns *<br />
Back fat gain AM → F 0.02 2 0.008 2 0.03 2 31 5 64 * ns<br />
Lesions, No. M 0.6 2 0.4 2 0.9 2 28 9 63 * **<br />
Lesions, No. AM 0.5 2 0.4 2 0.8 2 24 14 62 * **<br />
Lesions, No. F 1.1 2 0.3 2 1.0 2 52 5 43 ** *<br />
% not eating AM 1.3 2 0.7 2 1.9 2 29 7 64 * *<br />
Aggressions W 0.5 2 0.4 2 0.9 2 22 11 67 * **<br />
Aggressions AM 0.4 2 0.3 2 0.7 2 22 10 67 * **<br />
% in box W 0.6 2 0.8 2 2.1 2 7 12 81 ns *<br />
Lying alone W 0.9 2 1.0 2 - a) 45 55 - a) ** ***<br />
Lying alone AM 0.7 2 0.03 2 - a) 99