Medicaid Managed Care - U.S. Senate Special Committee on Aging
Medicaid Managed Care - U.S. Senate Special Committee on Aging Medicaid Managed Care - U.S. Senate Special Committee on Aging
740 Table 10 Family Voices Survey on
741 Table 10 (continued) Family Voices Survey on
- Page 692 and 693: 690 On Saturday, July 13, 1996 and
- Page 694 and 695: INTRODUCTION Medicaid</stro
- Page 696 and 697: 694 INTRODUCTION People living with
- Page 698 and 699: 696 |CONSENSUS FOR ATO of many of o
- Page 700 and 701: - 698 There is a huge need to educa
- Page 702 and 703: 700 People fiving with HIV, and the
- Page 704 and 705: 702 The HIV epidemic disproportiona
- Page 706 and 707: NATIONAL ASSOCIATION OF PEOPLE WITH
- Page 708 and 709: 706 People living with HIV must be
- Page 710 and 711: 708 CONSENSUS FOR ACTION service Fo
- Page 712 and 713: 710 E . | CONSENSUS FORACTION Peopl
- Page 714 and 715: 712 CONSENSUS FOR ACTION _ Under Cr
- Page 716 and 717: 714 PNDX Aj MedIcaId -A health care
- Page 718 and 719: Resources 716 NAPWAserves as the vo
- Page 720 and 721: Medicaid Working G
- Page 722 and 723: Background 720 FAMILY"7OICES A nati
- Page 724 and 725: 722 was included. A telephone numbe
- Page 726 and 727: 724 provider to ask questions. fami
- Page 728 and 729: 726 * Families were twice as likely
- Page 730 and 731: 728 carefully to explain why they a
- Page 732 and 733: Table I Family Voices Survey on <st
- Page 734 and 735: Table 2 (continued) Family Voices S
- Page 736 and 737: Table 4 Family Voices Survey on <st
- Page 738 and 739: 736 Table 7 Family Voices Survey on
- Page 740 and 741: 738 Table 8 Family Voices Survey on
- Page 744 and 745: al 742 Table II Family Voices Surve
- Page 746 and 747: 744 Tn Uvman 1usoUU - Ya..e. PeMh i
- Page 748 and 749: 746 Tihe b d. - Yc'.n-e-aPcopb bith
- Page 750 and 751: 748 UT1, W L= 1. - Y g o. ith ,Pb M
- Page 752 and 753: 750 o As with the rest of the <stro
- Page 754 and 755: 752 Mlbe 1 Mediaid Benefici7 ibtas
- Page 756 and 757: 754 9: Office of the Assistant Secr
- Page 758 and 759: The research for this paper Was sup
- Page 760 and 761: Definitions of "Medically Necessary
- Page 762 and 763: Who Should Define What Is Necessary
- Page 764 and 765: 762 contract. In that situation, th
- Page 766 and 767: 764 sannes and for certain conditio
- Page 768 and 769: Defining Elements of a Definition o
- Page 770 and 771: 768 (6J identify and evaluate a men
- Page 772 and 773: 770 This paper highlights children'
- Page 774 and 775: 772 din resulut in inadequate or in
- Page 776 and 777: 774 dividual under public-sector ma
- Page 778 and 779: BAZELON CENTER RESOURCES ON MANAGED
- Page 780 and 781: ivn58ffR1eL_ 778 THF VARIAI LITY OF
- Page 782 and 783: _4 What are the essential benefits
- Page 784 and 785: WHAT PUBLIC PURCHASERS CAN DO - Oen
- Page 786 and 787: ASSESSMENT OF STANDARDS - Quality M
- Page 788 and 789: Accessibility, Availability, Referr
- Page 790 and 791: - Credentialing and Recredtentialin
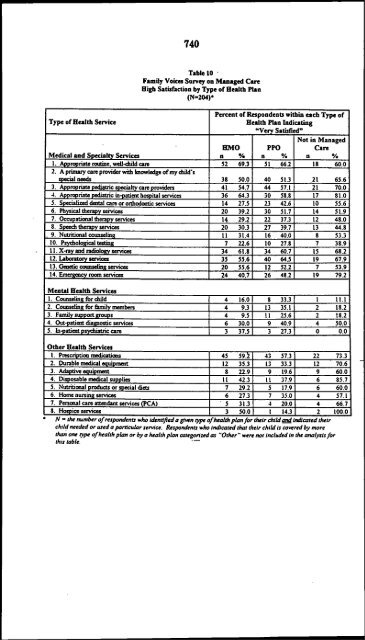
740<br />
Table 10<br />
Family Voices Survey <strong>on</strong> <str<strong>on</strong>g>Managed</str<strong>on</strong>g> <str<strong>on</strong>g>Care</str<strong>on</strong>g><br />
High Satisfacti<strong>on</strong> by Type of Health Plan<br />
(N-204)-<br />
Percent of Resp<strong>on</strong>dents within each Type of<br />
Type of Health Service Health Plan Indicating<br />
"Verv Satisfied"<br />
Not in <str<strong>on</strong>g>Managed</str<strong>on</strong>g><br />
HMO PPO <str<strong>on</strong>g>Care</str<strong>on</strong>g><br />
Medical and <str<strong>on</strong>g>Special</str<strong>on</strong>g>ty Services n % n % n %<br />
1. Appropriate routine. well-child care 52 69.3 51 662 18 60.0<br />
2. A primary care provider with knowledge of my child's<br />
special needs 38 50.0 40 51.3 21 65.6<br />
3 Appropriate pediatric specialty care providers 41 54.7 44 57.1 21 70.0<br />
4 Appropriate pediatric n-patient hospital services 36 64.3 30 58.8 17 81.0<br />
5 <str<strong>on</strong>g>Special</str<strong>on</strong>g>ized dental care or orthod<strong>on</strong>tic services 14 27.5 23 42.6 10 55.6<br />
6 Physicaltherapy seivices 20 39.2 30 51.7 14 51.9<br />
7. Occupati<strong>on</strong>al therapy services 14 2912 22 37.3 12 48.0<br />
8. Speechtherapyservices 20 30.3 27 39.7 13 44.8<br />
9. Nutriti<strong>on</strong>alcoumseling 11 31.4 16 40.0 8 53.3<br />
10. Psychological testing 7 22.6 10 27.8 7 38.9<br />
I 1.X-ray and radiology services 34 61.8 34 60.7 15 68.2<br />
12. Laborstary services 35 556 40 64.5 19 67.9<br />
13. Genetic counseling services 20 55.6 12 52.2 7 53.9<br />
14. Emergency room services 24 40.7 26 4812 19 79.2<br />
Mental Health Services<br />
I Counseling for child 4 16.0 8 33.3 1 11.1<br />
2_ Counsel_ for &mil members 4 9.3 13 35.1 2 18.2<br />
3 Fanulysupportgroups 4 9.5 11 25.6 2 18.2<br />
4 Out-patient diagnostic services 6 30.0 9 40.9 4 50.0<br />
5 Intunt sychatr 3 37.5 3 27.3 0 0.0<br />
Other Health Services<br />
I Prescripti<strong>on</strong> medicati<strong>on</strong>s 45 59.2 43 57.3 22 73.3<br />
2. Durable medical equipment 12 35.3 13 33.3 12 70.6<br />
3.Adaptive 8luipent 8 22.9 9 19.6 9 60.0<br />
4. Disposable medical supplies 11 42.3 1L 37.9 6 85.7<br />
5. Nutriti<strong>on</strong>al products or special diets 7 29.2 5 17.9 6 60.0<br />
6. Home nursing services 6 27.3 7 35.0 4 57.1<br />
7. Persoral careateida services (PCA) 5 31.3 4 20.0 4 66.7<br />
8. Hospice services 3 50.0 1 14.3 2 100.0<br />
IN = the number of resp<strong>on</strong>dents who identified a given rype of health plan for their child a Indicated their<br />
child needed or used a parricular service. Resp<strong>on</strong>dents who indicated thar rheir child is covered by more<br />
than <strong>on</strong>e type of health plan or by a health plan categorized as "Other" were not included in the analysis for<br />
this table.


