- Page 1 and 2:
S. HRG. 105-262 MEDICAID MANAGED CA
- Page 3 and 4:
CONTENTS PEOPLE WITH SPECIAL NEEDS,
- Page 5 and 6:
V Bazelon Center for Mental Health
- Page 7 and 8:
2 also apparent that structuring a
- Page 9 and 10:
4 through the doors when somebody o
- Page 11 and 12:
6 delay the onset of secondary disa
- Page 13 and 14:
8 BRIEFING FOR CONGRESSIONAL STAFF
- Page 15 and 16:
10 obstetric and gynecological serv
- Page 17 and 18:
JlSAes CRi. E CalD5Vilb J~iiiLi uls
- Page 19 and 20:
14 people with disabilities and spe
- Page 21 and 22:
16 and prospective enrollees the pl
- Page 23 and 24:
18 by the disorder. In fact, schizo
- Page 25 and 26:
20 r_ 06/23/1997 16: 03 7836845968
- Page 27 and 28:
22 Kathy. STATEMENT OF KATHLEEN H.
- Page 29 and 30:
24 even lead to an improvement-but
- Page 31 and 32:
26 MANAGED CARE AND LONG TERM T h e
- Page 33 and 34:
Consortium for C. 20249&Oid Citizen
- Page 35 and 36:
30 11 Managed care
- Page 37 and 38:
Strong Oualitv Assurance Measures 3
- Page 39 and 40:
NATIONAL ASSOCIATION 34 DEVELOPMENT
- Page 41 and 42:
36 Mrs. M.'s care plan is quite com
- Page 43 and 44:
38 nurses and social workers be ava
- Page 45 and 46:
40 EXPENDITURES FOR NURSING HOMES S
- Page 47 and 48:
REQUIRES THE SKILL OF A HIGHLY TRAI
- Page 49 and 50:
44 ALZHEIMER'S DISEASE AND RELATED
- Page 51 and 52:
46 WITHOUT ADEQUATE RESPITE CARE, I
- Page 53 and 54:
48 PROBLEM FOR PEOPLE SUFFERING FRO
- Page 55 and 56:
50 Ms. CHRISTENSEN. Thank you. Don.
- Page 57 and 58:
52 it will eradicate the virus. Man
- Page 59 and 60:
I 54 Today I participate in a state
- Page 61 and 62:
56 Ms. CHRISTENSEN. Thank you. [Ina
- Page 63 and 64:
58 rather than to community-based s
- Page 65 and 66:
60 now has to start looking at thin
- Page 67 and 68:
62 plan for that matter, can measur
- Page 69 and 70:
64 ual is getting state-of-the-art
- Page 71 and 72:
66 a larger population of people wi
- Page 73 and 74:
68 of recovery or rehabilitation th
- Page 75 and 76:
70 are entitled to renew their pres
- Page 77 and 78:
72 point and say that Patsy comes f
- Page 79 and 80:
74 .The WASHNTND MEDICAL CENTER CEN
- Page 81 and 82:
76 exceptions - have largely based
- Page 83 and 84:
78 Plans have not shown a willingne
- Page 85 and 86:
eligible people and for the program
- Page 87 and 88:
Table l.b Selected Provisions Relat
- Page 89 and 90:
VariiaIioils in rownlr-c1t language
- Page 91 and 92:
Variations in cbonIlrlcl Is1sgu;age
- Page 94 and 95:
Executive Summary 1. Setting the Co
- Page 96 and 97:
age, which pays for those M
- Page 98 and 99:
This consensus building exercise is
- Page 100 and 101:
95 Ms. CHRISTENSEN. I'm going to in
- Page 102 and 103:
97 abled population will all need s
- Page 104 and 105:
5601 Smetua- Drive PO. r,. 9310 Mmn
- Page 106 and 107:
101 Our experience with the AFDC po
- Page 108 and 109:
103 I have tried to list both the o
- Page 110 and 111:
105 BACKGROUND INFORMATION PATRICIA
- Page 112 and 113:
164 Communicating the Quality Messa
- Page 114 and 115:
166 Communicating the Quality Messa
- Page 116 and 117:
168 Communicating the Quality Messa
- Page 118 and 119:
170 Communicating the Quality Messa
- Page 120 and 121:
172 Communicating the Quality Messa
- Page 122 and 123:
174 Communicating the Quality Messa
- Page 124 and 125:
119 Dr. SCANLON. In this series of
- Page 126 and 127:
121 lation in managed care in Minne
- Page 128 and 129:
123 thing, because you will have va
- Page 130 and 131:
125 If we develop them now around e
- Page 132 and 133:
127 I think those are the things yo
- Page 134 and 135:
130 to use, and they will be collec
- Page 136 and 137:
176 Communicating the Quality Messa
- Page 138 and 139:
134 unlikely though that these futu
- Page 140 and 141:
136 While we are in the midst of th
- Page 142 and 143:
138 Center for Health Program Devel
- Page 144 and 145:
140 ('enter for Hearlth Proeram Dev
- Page 146 and 147:
142 Center for Health Program Devel
- Page 148 and 149:
144 Center for Health Program Devel
- Page 150 and 151:
146 If More is Better, Cost Contain
- Page 152 and 153:
148 ANALYSIS OF OUTCOMES SF-36 phys
- Page 154 and 155:
150 4-Year Physical Health Outcomes
- Page 156 and 157:
152 MAJOR FINDINGS -1 PHYSICAL DECL
- Page 158 and 159:
154 INTERPRETATION OF RESULTS * Equ
- Page 160 and 161:
156 Additional Information is on th
- Page 162 and 163:
order) were followed. Samplingpatie
- Page 164 and 165:
AP Ag. 0065(0 og. qP e8 y. d-ftd 04
- Page 166 and 167:
162 Tlbb. 5-Plso91 A& MerohJ H89t0
- Page 168 and 169:
and chest pain sufficient to requir
- Page 170 and 171:
166 Quality Special</strong
- Page 172 and 173:
THE STATE OF THE STATES TUESDAY, JU
- Page 174 and 175:
171 a little bit about some of the
- Page 176 and 177:
173 gatekeeper, and we also wondere
- Page 178 and 179:
175 Maryland ought to submit that w
- Page 180 and 181:
177 fined by us in our regulations,
- Page 182 and 183:
179 To get to that kind of situatio
- Page 184 and 185:
181 Outline of Presentation for Dep
- Page 186 and 187:
183 B. Approaches to Ensure Quality
- Page 188 and 189:
185 * Holds MCOs accountable for qu
- Page 190 and 191:
187 HealthChoice and People with <s
- Page 192 and 193:
189 HealthChoice and People with <s
- Page 194 and 195:
191 Take these three steps to choos
- Page 196 and 197:
193 Call 1-800-888-1965 if you are
- Page 198 and 199:
IF YOU HAVE HIV/AIDS 195 MCO staff
- Page 200 and 201:
197 * Refer you to a medical specia
- Page 202 and 203:
*pV 199 SERVICES FOR CHILDREN IN ST
- Page 204 and 205:
201 Ms. CHRISTENSEN. Thank you. Go
- Page 206 and 207:
203 We implement these QI goals thr
- Page 208 and 209:
205 Medicaid recip
- Page 210 and 211:
207 My name is Peggy Bartels. I am
- Page 212 and 213:
209 At the forefront of Wisconsin's
- Page 214 and 215:
211 Finally, we believe that high q
- Page 216 and 217:
213 WISCONSIN DEPARTMENT OF HEALTH
- Page 218 and 219:
2 SELECTED INDICATORS Access to <st
- Page 220 and 221:
Mental Health 217 * HMOs reported f
- Page 222 and 223:
'Nisconsin Medicaid</strong
- Page 224 and 225:
Program for Program Chareolorletice
- Page 226 and 227:
Primary Program AFDC/H8 Provlqar Ch
- Page 228 and 229:
225 Children Come First of Dane Cou
- Page 230 and 231:
227 Wraparound Milwaukee saving dol
- Page 232 and 233: 229 Another positive outcome of the
- Page 234 and 235: 231 AltDoughl Nkvie' iniCil costs i
- Page 236 and 237: 233 CCE's staff consist of a variet
- Page 238 and 239: 235 Al the cturent time, there is n
- Page 240 and 241: 237 PACE/Partnership programs guide
- Page 242 and 243: 239 necessarily relevant to the AFD
- Page 244 and 245: 241 about including these specialty
- Page 246 and 247: EXECUTIVE COMMITTEE Ct-u B.1r- M.mb
- Page 248 and 249: Considerations: 245 Enrolling <stro
- Page 250 and 251: 247 Medicaid <stro
- Page 252 and 253: a. some counties 249 b. mandatory e
- Page 254 and 255: 251 counties as well-of managed car
- Page 256 and 257: 253 In other States devolution is m
- Page 258 and 259: 255 /-LCenter for Health Ca
- Page 260 and 261: 257 Forums on Managed</stro
- Page 262 and 263: 259 Medicaid Carve
- Page 264 and 265: 261 So I view Medicaid</str
- Page 266 and 267: 264 Medicaid: Spen
- Page 268 and 269: 266 a 50 percent match. 2 Since 198
- Page 270 and 271: 268 If enrollment of eligible indiv
- Page 272 and 273: 270 drugs, ICF services, and optome
- Page 274 and 275: 272 Table 20-1. Medicaid</s
- Page 276 and 277: 274 The slowdown in spending after
- Page 278 and 279: 276 Section 1115 Demonstration Waiv
- Page 280 and 281: 278 primary care case management ar
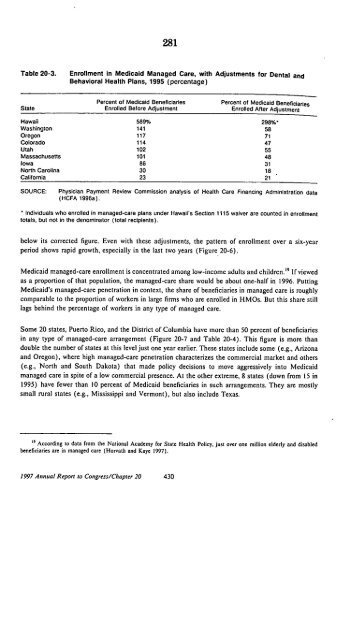
- Page 284 and 285: 282 / Figure 20-6. Enrollment Growt
- Page 286 and 287: 284 Marnaged-care growth at the sta
- Page 288 and 289: 286 Figure 20-9. Enrollment in Risk
- Page 290 and 291: 288 The extent of problems in repor
- Page 292 and 293: 290 plans (PPRC 1996). In other are
- Page 294 and 295: 292 There appears to be a clear tre
- Page 296 and 297: Enrollment and Disenrollment Polici
- Page 298 and 299: 296 individually with plans over ra
- Page 300 and 301: 298 Health Care Fi
- Page 302 and 303: Medicaid M
- Page 304 and 305: Support & Services Office 120 W. Tw
- Page 306 and 307: INTRODUCTION 304 Presently, nearly
- Page 308 and 309: 306 more mandatory services. Full-r
- Page 310 and 311: 308 the ability of beneficiaries to
- Page 312 and 313: 310 managed care also requires the
- Page 314 and 315: 312 condition period. Such requirem
- Page 316 and 317: 314 If a state contracts with or in
- Page 318 and 319: Appendix A State Activity* 316 Many
- Page 320 and 321: GA { I ~United States (3 Mu General
- Page 322 and 323: Results in Brief E.. - 320
- Page 324 and 325: Significant Efforts Needed to Ensur
- Page 326 and 327: Recommendations Agency Comments E-d
- Page 328 and 329: cow 326 Chapter 4 Traditional Rate-
- Page 330 and 331: Chapter I Background 328 Me
- Page 332 and 333:
ovapt I 330 the option of extending
- Page 334 and 335:
Federal Requirements Govern State U
- Page 336 and 337:
Table 1.2: Comparison of Ma
- Page 338 and 339:
Objectives, Scope, and Methodology
- Page 340 and 341:
338 Chapter 2 States Are Moving Tow
- Page 342 and 343:
Table 21 nEnollmen of Disabled Bene
- Page 344 and 345:
342 chona Se. As To~ed Id C"fn, Dai
- Page 346 and 347:
Table a& Eabent to Which 17 State I
- Page 348 and 349:
346 So A- hbydf TSo -d Cam fo DIbbi
- Page 350 and 351:
Table 2.5: Extent to Which 17 State
- Page 352 and 353:
350 8t" Age Bowi T-Mar 11 Cue fRa D
- Page 354 and 355:
352 C".Pt a Q...itA- Efl~t. . - C f
- Page 356 and 357:
Addressing Concerns Through Enrollm
- Page 358 and 359:
Assignment Active Management of a D
- Page 360 and 361:
358 fo.V D Axd B ref .Ak,.d - CC-e
- Page 362 and 363:
Targeted Quality-of-Care</s
- Page 364 and 365:
Encounter Data Analysis Shows Poten
- Page 366 and 367:
364 Chapter 4 Risk-Adjusted Rates a
- Page 368 and 369:
366 Cu.pd 4 Rk-A4tAjLd Row Ad RIASW
- Page 370 and 371:
States Could Experience Adverse Sel
- Page 372 and 373:
370 Ckspt. 4 JUek-Mtod Rate Wd HIa
- Page 374 and 375:
372 Ch.piWr 4 JU-i.k.d Row md RJAk-
- Page 376 and 377:
374 Coob,, 4 RkikAdjned Rtr -d Rub-
- Page 378 and 379:
376 rued R.I. . 2".shBd c- provider
- Page 380 and 381:
378 c-5 Obh- .. I, Co.eWda, ad CHe
- Page 382 and 383:
380 Ob-e-eU-o, Co-ded, end C-ost pr
- Page 384 and 385:
382 United States General Accountin
- Page 386 and 387:
Results in Brief B-Z70335 384 manag
- Page 388 and 389:
B-2Kn0 386 assess service utilizati
- Page 390 and 391:
Table 1: Characteristics of <strong
- Page 392 and 393:
B-27035 390 numbers of patients. In
- Page 394 and 395:
B-270335 392 number of primary care
- Page 396 and 397:
B-Z7Oa33 394 developed on the premi
- Page 398 and 399:
States Challenged to Develop Effect
- Page 400 and 401:
B-270335 398 that beneficiary use o
- Page 402 and 403:
B.270335 400 of the care provided a
- Page 404 and 405:
States Could Learn More From Improv
- Page 406 and 407:
Targeted Analyses of Grievance Data
- Page 408 and 409:
Observations Agency Comments and Ou
- Page 410 and 411:
B-270335 408 Finally, the experts w
- Page 412 and 413:
410 Appendix I Scope and Methodolog
- Page 414 and 415:
- I 412 App-edU I Sw Wd Methodology
- Page 416 and 417:
414 AppeAdt U Fedo.I aod Stt. Ove0s
- Page 418 and 419:
416 Appendix III Major Contributors
- Page 420 and 421:
GAO July 1996 GAO/HEHS-96-120 418 U
- Page 422 and 423:
B-26632 420 family home, rather tha
- Page 424 and 425:
Background 1-206320 422 traditional
- Page 426 and 427:
States Use Waivers to Expand and Ch
- Page 428 and 429:
84=20 426 Figure 1: Staftes Use of
- Page 430 and 431:
B-266320 428 began the 1990s with s
- Page 432 and 433:
B26320 430 variety of other service
- Page 434 and 435:
Enrollment Caps and Management Prac
- Page 436 and 437:
Change in Federal Rule Could Result
- Page 438 and 439:
States Are Introducing Innovations
- Page 440 and 441:
B-nato 438 offered and the means fo
- Page 442 and 443:
440 We are sending copies of this r
- Page 444 and 445:
C-m 442 Table 2: Changes in Number
- Page 446 and 447:
444 App-ar I So-p and Mraodsogo ent
- Page 448 and 449:
446 Appendix H Medicaid</st
- Page 450 and 451:
448 App-di. f M~I Wd., _. So 4 Of0
- Page 452 and 453:
450 App-.i. il _-.1 - Desd s UCFVA'
- Page 454 and 455:
452 Apeadls mn Stadad Seee - Defind
- Page 456 and 457:
454 Appedi. M St.d.ed Se&ee s Dneoe
- Page 458 and 459:
Chore 456 Am..& IV LAO n.Gd .Mt. ,
- Page 460 and 461:
Occupational Therapy and Assessment
- Page 462 and 463:
Psychological Services Provider Typ
- Page 464 and 465:
462 AWppdi IV U-e, Cotfi-, E d Othe
- Page 466 and 467:
Licensure/Registration Other Standa
- Page 468 and 469:
466 United States General Accountin
- Page 470 and 471:
Results in Brief B-276078 468 care
- Page 472 and 473:
B-270078 470 Medi-Cal was implement
- Page 474 and 475:
_.27_7 Tab 1: Mad-C Eiglbli and Enr
- Page 476 and 477:
~~- - o~~BZ760?S 474 I J I the enro
- Page 478 and 479:
B.276078 476 delaying the contracti
- Page 480 and 481:
State's Education Process Has Not R
- Page 482 and 483:
B.276078 480 and thereby supplement
- Page 484 and 485:
Weaknesses in State Management of t
- Page 486 and 487:
B-276078 484 standards can provide
- Page 488 and 489:
Insufficient Communication and Invo
- Page 490 and 491:
Some Safety-Net Providers Are Encou
- Page 492 and 493:
Conclusions B-276D78 490 Safety-net
- Page 494 and 495:
B-270078 492 current enrollment bro
- Page 496 and 497:
Contents Letter 494 Appendix 30 Sco
- Page 498 and 499:
(1115) oPP. -.M.taoy 496 oversight
- Page 500 and 501:
498 ACKNOWLEDGEMENTS This Volume of
- Page 502 and 503:
500 Is Lock-in to a Managed
- Page 504 and 505:
502 Plan and Provider Issues ......
- Page 506 and 507:
504 Chapter 1 Program Design Issues
- Page 508 and 509:
506 Other studies attest to improve
- Page 510 and 511:
508 Will the Program Be Voluntary o
- Page 512 and 513:
510 additional option for people wi
- Page 514 and 515:
512 contractor collect spenddown pa
- Page 516 and 517:
514 Option A is still quite rare. P
- Page 518 and 519:
516 experience with special populat
- Page 520 and 521:
518 particularly on a full risk bas
- Page 522 and 523:
520 Dual eligibility raises a disti
- Page 524 and 525:
522 special populations, and states
- Page 526 and 527:
524 Chapter 2 Care
- Page 528 and 529:
526 settings. Finally, plans that s
- Page 530 and 531:
5281 needs. For example, women who
- Page 532 and 533:
530 Oregon's rules require that pla
- Page 534 and 535:
532 beneficiaries on July 1, 1997.
- Page 536 and 537:
534 facility's delivery, dosage, an
- Page 538 and 539:
536 * Strategies for measuring netw
- Page 540 and 541:
538. arrangements with traditional
- Page 542 and 543:
540 community based or well elders.
- Page 544 and 545:
542 Finally, coordination for vulne
- Page 546 and 547:
544 Care Coordinat
- Page 548 and 549:
546 home health agency developed a
- Page 550 and 551:
548 develop a case management syste
- Page 552 and 553:
550 Coordinating services is compli
- Page 554 and 555:
Highlights 552 Effective care coord
- Page 556 and 557:
554 beneficiaries that belong to th
- Page 558 and 559:
556 services when needed. This is t
- Page 560 and 561:
558 federal government and not at s
- Page 562 and 563:
560 cannot enroll a person in a Med
- Page 564 and 565:
562 Medicare members are not typica
- Page 566 and 567:
564 Regence HMO Oregon staff noted
- Page 568 and 569:
566 community based organizations t
- Page 570 and 571:
568 Although technical advice for c
- Page 572 and 573:
570 Risk pools are usually used to
- Page 574 and 575:
572 Internal Quality Program Standa
- Page 576 and 577:
574 enrollee utilization patterns,
- Page 578 and 579:
576 that the overall prevalence of
- Page 580 and 581:
578 HMOs with risk contracts must h
- Page 582 and 583:
580 Summary As Medicaid</st
- Page 584 and 585:
582 Chapter 3 Medicaid</str
- Page 586 and 587:
584 carve-out approach: - improves
- Page 588 and 589:
586 Coordinating Medical and Non-Me
- Page 590 and 591:
588 Oregon,8 program planners origi
- Page 592 and 593:
590 Medicaid syste
- Page 594 and 595:
592 Oversight/Monitoring Quality De
- Page 596 and 597:
594 with family and friends, contac
- Page 598 and 599:
596 * The type(s) of data necessary
- Page 600 and 601:
598 * Specificity of desired result
- Page 602 and 603:
600 Initiatives under way may prove
- Page 604 and 605:
602 a estring the services authoriz
- Page 606 and 607:
604 Development of appropriate plan
- Page 608 and 609:
606 OFFICE OF INSPECTOR GENERAL The
- Page 610 and 611:
Establishing core developmental tea
- Page 612 and 613:
610 taken into account considerable
- Page 614 and 615:
PURPOSE 612 INTRODUCTION Our purpos
- Page 616 and 617:
614 MANAGED CARE PENETRATION The de
- Page 618 and 619:
616 CHALLENGES AND RESPONSES Our re
- Page 620 and 621:
618 > In building up and maintainin
- Page 622 and 623:
620 * For the most part, the agenci
- Page 624 and 625:
622 beginning to look for associate
- Page 626 and 627:
624 challenge will be to ensure tha
- Page 628 and 629:
626 RETOOLING AS AN ISSUE Retooling
- Page 630 and 631:
628 finding effective ways of deali
- Page 632 and 633:
630 COMMENTS ON THE DRAFT REPORT We
- Page 634 and 635:
Defining Managed <
- Page 636 and 637:
DATE: JU 27 1997 TO: June Gibbs Bro
- Page 638 and 639:
636 protocols will be enhanced thro
- Page 640 and 641:
638 Broad and explicit state health
- Page 642 and 643:
640 APPENDIX C ENDNOTES 1. See, for
- Page 644 and 645:
642 The First Biannual Report of th
- Page 646 and 647:
644 30. In Massachusetts, for examp
- Page 648 and 649:
646 CHILDREN WITH SPECIAL HEALTH CA
- Page 650 and 651:
Prface 648 The U.S. Maternal and Ch
- Page 652 and 653:
650 L DEFINING AND IDENTIFYING CHIL
- Page 654 and 655:
2. Child Health Questionnaire (CHQ)
- Page 656 and 657:
654 Limits * This approach identifi
- Page 658 and 659:
656 To what extent does the definit
- Page 660 and 661:
658 II. FAMILY PARTICIPATION IN MAN
- Page 662 and 663:
660 Description This is an integrat
- Page 664 and 665:
12. American Academy of Pediatries
- Page 666 and 667:
664 knowledge of a child's conditio
- Page 668 and 669:
666 though only the NACHRI approach
- Page 670 and 671:
668 Sources Ash A, Porell F, Gruenb
- Page 672 and 673:
C. Recommended Adivities 670 With t
- Page 674 and 675:
672 B. Examples of Current Research
- Page 676 and 677:
674 The Practice Parameters Project
- Page 678 and 679:
076 -Administrative Survey: Enrollm
- Page 680 and 681:
678 Description This guide provides
- Page 682 and 683:
680 APPENDIX 1: PARTICIPANT LIST MA
- Page 684 and 685:
682 MANAGED CARE EXPERT WORK GROUP
- Page 686 and 687:
684 APPENDIX H: BIBLIOGRAPHY MANAGE
- Page 688 and 689:
686 MANAGED CARE EXPERT WORK GROUP
- Page 690 and 691:
688 MAKING MEDICAID MANAGED CARE PR
- Page 692 and 693:
690 On Saturday, July 13, 1996 and
- Page 694 and 695:
INTRODUCTION Medicaid</stro
- Page 696 and 697:
694 INTRODUCTION People living with
- Page 698 and 699:
696 |CONSENSUS FOR ATO of many of o
- Page 700 and 701:
- 698 There is a huge need to educa
- Page 702 and 703:
700 People fiving with HIV, and the
- Page 704 and 705:
702 The HIV epidemic disproportiona
- Page 706 and 707:
NATIONAL ASSOCIATION OF PEOPLE WITH
- Page 708 and 709:
706 People living with HIV must be
- Page 710 and 711:
708 CONSENSUS FOR ACTION service Fo
- Page 712 and 713:
710 E . | CONSENSUS FORACTION Peopl
- Page 714 and 715:
712 CONSENSUS FOR ACTION _ Under Cr
- Page 716 and 717:
714 PNDX Aj MedIcaId -A health care
- Page 718 and 719:
Resources 716 NAPWAserves as the vo
- Page 720 and 721:
Medicaid Working G
- Page 722 and 723:
Background 720 FAMILY"7OICES A nati
- Page 724 and 725:
722 was included. A telephone numbe
- Page 726 and 727:
724 provider to ask questions. fami
- Page 728 and 729:
726 * Families were twice as likely
- Page 730 and 731:
728 carefully to explain why they a
- Page 732 and 733:
Table I Family Voices Survey on <st
- Page 734 and 735:
Table 2 (continued) Family Voices S
- Page 736 and 737:
Table 4 Family Voices Survey on <st
- Page 738 and 739:
736 Table 7 Family Voices Survey on
- Page 740 and 741:
738 Table 8 Family Voices Survey on
- Page 742 and 743:
740 Table 10 Family Voices Survey o
- Page 744 and 745:
al 742 Table II Family Voices Surve
- Page 746 and 747:
744 Tn Uvman 1usoUU - Ya..e. PeMh i
- Page 748 and 749:
746 Tihe b d. - Yc'.n-e-aPcopb bith
- Page 750 and 751:
748 UT1, W L= 1. - Y g o. ith ,Pb M
- Page 752 and 753:
750 o As with the rest of the <stro
- Page 754 and 755:
752 Mlbe 1 Mediaid Benefici7 ibtas
- Page 756 and 757:
754 9: Office of the Assistant Secr
- Page 758 and 759:
The research for this paper Was sup
- Page 760 and 761:
Definitions of "Medically Necessary
- Page 762 and 763:
Who Should Define What Is Necessary
- Page 764 and 765:
762 contract. In that situation, th
- Page 766 and 767:
764 sannes and for certain conditio
- Page 768 and 769:
Defining Elements of a Definition o
- Page 770 and 771:
768 (6J identify and evaluate a men
- Page 772 and 773:
770 This paper highlights children'
- Page 774 and 775:
772 din resulut in inadequate or in
- Page 776 and 777:
774 dividual under public-sector ma
- Page 778 and 779:
BAZELON CENTER RESOURCES ON MANAGED
- Page 780 and 781:
ivn58ffR1eL_ 778 THF VARIAI LITY OF
- Page 782 and 783:
_4 What are the essential benefits
- Page 784 and 785:
WHAT PUBLIC PURCHASERS CAN DO - Oen
- Page 786 and 787:
ASSESSMENT OF STANDARDS - Quality M
- Page 788 and 789:
Accessibility, Availability, Referr
- Page 790 and 791:
- Credentialing and Recredtentialin
- Page 792 and 793:
Standards for Members' Rights and R
- Page 794 and 795:
Preventive Behavioral Health Servic
- Page 796 and 797:
9b4 etfJovrk9imut July 16, 1997 794
- Page 798 and 799:
hel,4Neipaork SEmi July 16, 1997 79
- Page 800 and 801:
798 Principles for Accountable <str
- Page 802 and 803:
800 The Coalition for Accountable <
- Page 804 and 805:
802 Principles for Accountable <str
- Page 806 and 807:
Im. Community 804 Health plans shou
- Page 808 and 809:
806 4. participating in community p
- Page 810 and 811:
808 5. give patients opportunities
- Page 812 and 813:
810 aRve New Children With Disabili
- Page 814 and 815:
Table of Contents 812 Executive Sum
- Page 816 and 817:
814 combination of HealthPartners d
- Page 818 and 819:
Introduction 816 F amilies whose ch
- Page 820 and 821:
818 Of the 24 families asked, 13 pa
- Page 822 and 823:
820 Shriner's Hospital, or claims s
- Page 824 and 825:
822 Major Child and Family Concerns
- Page 826 and 827:
Services and Funding Sources 824 Nu
- Page 828 and 829:
Physician Survey 826 M ost physicia
- Page 830 and 831:
828 Discussion and Recommendations
- Page 832 and 833:
830 * Claims and billing informatio
- Page 834 and 835:
832 El Advocate for a safety net of
- Page 836 and 837:
834 :i:PTNG F'AITH SYMThMr -"r W, M
- Page 838 and 839:
836 We recognize that managed care
- Page 840 and 841:
due to a host of complex demographi
- Page 842 and 843:
affect many different facets of an
- Page 844 and 845:
state agencies, must be held accoun
- Page 846 and 847:
In selecting managed care entities
- Page 848 and 849:
Z, W 0 V==4 . k PQ- 0 V-- 9 Q) bo =
- Page 850 and 851:
plans were virtually identical in b
- Page 852 and 853:
to chronically i persons has been t
- Page 854 and 855:
Managed Risk Medic
- Page 856 and 857:
the lead. Large purchasers might wo
- Page 858:
ISBN 0-16-055952-9 9 [ 10111111 155