- Page 1 and 2: Tuning Reactivity of Platinum(II) C
- Page 3 and 4: Declaration This thesis report is b
- Page 5 and 6: Abstract Systematic kinetic and the
- Page 7 and 8: Table of contents Acknowledgements
- Page 9 and 10: 2.5.5 Effect of Non-participating G
- Page 11 and 12: 5.2.1 Chemical and Solutions ......
- Page 13 and 14: 7.2 Experimental Section ..........
- Page 15 and 16: procurements, Messers P. Forder and
- Page 17 and 18: Figure 2.2 Potential energy profile
- Page 19: Figure 4.6 Concentration dependence
- Page 23 and 24: List of Tables Table 2.1 A selectio
- Page 25 and 26: Table 6.4 Summary of rate constants
- Page 27 and 28: TU thiourea DMTU 1,3-dimethyl-2-thi
- Page 30 and 31: Table of Contents-1 Chapter 1 .....
- Page 32 and 33: 1.0 Introduction 1.1 Cancer Disease
- Page 34 and 35: toxic potential. The most well-know
- Page 36 and 37: 1.3.2.2 Cellular Uptake Cisplatin i
- Page 38 and 39: H 3N OH 2 Pt H 3N OH 2 Active Pt(II
- Page 40 and 41: transformational pathways that comp
- Page 42 and 43: the hydrolysis of the complex, wher
- Page 44 and 45: 1.3.4 Terpyridine Platinum(II) Comp
- Page 46 and 47: H 3 N Cl Pt NH 3 H 3 N NH 2 (CH 2 )
- Page 48 and 49: 1.4 Kinetic Interest The platinum-b
- Page 50 and 51: 3. The effect of varying the positi
- Page 52 and 53: 17 R. A. Henderson, The Mechanism o
- Page 54 and 55: Altona J. H. van Boom, G. A. van de
- Page 56 and 57: 76 (a)J. Kašpárková, J. Zehnulov
- Page 58 and 59: Table of Contents-2 Chapter Two ...
- Page 60 and 61: List of Tables Table 2.1: A selecti
- Page 62 and 63: The mononuclear Pt(II) complexes 1-
- Page 64 and 65: Potential Energy R + X RX 1 transit
- Page 66 and 67: For the associative mechanism (A),
- Page 68 and 69: the concentration of one of the rea
- Page 70 and 71:
k obs , s -1 0.00030 0.00025 0.0002
- Page 72 and 73:
k = Ae -Ea/RT 2.14 lnk = lnA - E a
- Page 74 and 75:
= 23.76 + R Hence, a plot of ln ⎛
- Page 76 and 77:
iii. # Δ V ≈ 10 cm3 mol-1 featur
- Page 78 and 79:
conventional methods are classical
- Page 80 and 81:
Figure 2.6: Schematic diagram of a
- Page 82 and 83:
The light transmitted from the samp
- Page 84 and 85:
c. Oxidizability: Ligands that are
- Page 86 and 87:
Table 2.1: A selection of n o pt va
- Page 88 and 89:
eaction with different nucleophiles
- Page 90 and 91:
eaction site from direct attack by
- Page 92 and 93:
PEt 3 PEt 3 R PEt 3 Pt Pt Y Y Cl R
- Page 94 and 95:
direct displacement of the leaving
- Page 96 and 97:
therefore, weaken the bond of the l
- Page 98 and 99:
σ-Donation According to classical
- Page 100 and 101:
References 1 (a) J. Reedijk, Chem.
- Page 102 and 103:
34 R. B. Jordan, Reaction Mechanism
- Page 104 and 105:
Table of Contents-3 Chapter 3.The
- Page 106 and 107:
Chapter 3 The π-Acceptor Effect in
- Page 108 and 109:
In order to extend our understandin
- Page 110 and 111:
after which water was added to quen
- Page 112 and 113:
O CH 3 + I + N O oH - N O O 7 CH 3
- Page 114 and 115:
84% (34.7 mg, 0.0618 mmol). 1 H NMR
- Page 116 and 117:
PhCN PhCN Pt Cl Cl + N N CH 3 N CH
- Page 118 and 119:
Complex Structure HOMO LUMO PtCl CH
- Page 120 and 121:
The geometry-optimised structures i
- Page 122 and 123:
against the concentration of the in
- Page 124 and 125:
Table 3.2: Summary of the second-or
- Page 126 and 127:
constants of CH3PhisoqPtCl decrease
- Page 128 and 129:
with π*-orbitals of the ligand. Th
- Page 130 and 131:
3.6 References 1 D. Rosenberg, L. V
- Page 132 and 133:
30 Microcal TM Origin TM Version 5.
- Page 134 and 135:
Figure S3.1: Kinetic trace at 448 n
- Page 136 and 137:
ln(k 2 /T) -6.0 -7.5 -9.0 -10.5 -12
- Page 138 and 139:
Table S3.3b: Average observed rate
- Page 140 and 141:
Table S3.5b: Temperature dependence
- Page 142 and 143:
Table S3.8: DFT calculated electros
- Page 144 and 145:
List of Figures Figure 4.1: Structu
- Page 146 and 147:
Table 4.2: Summary of pKa values fo
- Page 148 and 149:
4.1 Introduction Platinum compounds
- Page 150 and 151:
cis geometry, leading to dramatic c
- Page 152 and 153:
ligand was added to the [{cis-PtCl(
- Page 154 and 155:
spectra were measured in and refere
- Page 156 and 157:
4.3.1 DFT calculated Optimized Stru
- Page 158 and 159:
Table 4.1: A summary of the DFT cal
- Page 160 and 161:
H2O-Pt-L-Pt-OH2 H2O-Pt-L-Pt-OH2 H2O
- Page 162 and 163:
electrophilicity and acidity of the
- Page 164 and 165:
(A) 18 Absorbance 0.08 0.07 0.06 0.
- Page 166 and 167:
k obs(3 rd ) , s -1 -5 6.00x10 TMTU
- Page 168 and 169:
4.3.4 Kinetics with NMR The substit
- Page 170 and 171:
ln([ML] t ) 4.0 3.5 3.0 2.5 2.0 1.5
- Page 172 and 173:
ln(k 2(1 st ) /T) -3.5 -4.0 -4.5 -5
- Page 174 and 175:
Comple x Table 4.4: Summary of Acti
- Page 176 and 177:
The decrease in reactivity of 2,6pz
- Page 178 and 179:
Table 4.5: DFT calculated (NBO) cha
- Page 180 and 181:
eaction proceeds via bimolecular pa
- Page 182 and 183:
References 1 T. Storr, K. H.Thomson
- Page 184 and 185:
36 D. Jaganyi, D. Reddy, J.A. Gerte
- Page 186 and 187:
Appendix 4 THE INFLUENCE OF THE PYR
- Page 188 and 189:
Absorbance at 368. 0 nm 0. 0 8 0. 0
- Page 190 and 191:
Table S4.3: Average observed rate c
- Page 192 and 193:
k nd obs(2 ) , s-1 0.003 TU DMTU TM
- Page 194 and 195:
Table S4.7: Average observed rate c
- Page 196 and 197:
Table S4.8: Average observed rate c
- Page 198 and 199:
k obs2 , s -1 2.40x10 -4 2.20x10 -4
- Page 200 and 201:
Table S4.13: Average observed rate
- Page 202 and 203:
Table S4.14: Average observed rate
- Page 204 and 205:
Table S4.18: Average observed rate
- Page 206 and 207:
k obs(1 st ) , s -1 0.06 0.04 0.02
- Page 208 and 209:
Table S4.23: Average observed rate
- Page 210 and 211:
ln(k 2(3 rd ) /T) -10.0 -10.5 -11.0
- Page 212 and 213:
SpinWorks 2.5: 2,6 pznClO4 in D2O N
- Page 214 and 215:
Table of Contents-5 Chapter 5 .....
- Page 216 and 217:
List of Tables Table 5.1: A summary
- Page 218 and 219:
5.1 Introduction Multinuclear plati
- Page 220 and 221:
onding. For this reason, pKa titrat
- Page 222 and 223:
400-300 cm -1): 3308, 3117, 3071 (N
- Page 224 and 225:
5.2.6 Spectrophotometric pKa Titrat
- Page 226 and 227:
Table 5.1: A summary of DFT-calcula
- Page 228 and 229:
However, because the highest occupi
- Page 230 and 231:
Table 5.2: Acid dissociation consta
- Page 232 and 233:
Table 5.3: A summary of DFT calcula
- Page 234 and 235:
H3N 6 eq TU 0 eq TU Ha NH3 Ha Cl TU
- Page 236 and 237:
third step due to the trans-effect
- Page 238 and 239:
[H 2 O-Pt-(NN)-Pt-OH 2 ] +4 [NU-Pt-
- Page 240 and 241:
k obs(1st) / s -1 0.20 TU DMTU TMTU
- Page 242 and 243:
thiourea nucleophile is large enoug
- Page 244 and 245:
ln(k st 2(1 ) /T) -3 -4 -5 -6 -7 -8
- Page 246 and 247:
is the same as the electron-withdra
- Page 248 and 249:
associative mode of substitution me
- Page 250 and 251:
16 H. Ertürk, J. Maigut, R. Puchta
- Page 252 and 253:
43 (a) D. Jaganyi, A. Hofmann and R
- Page 254 and 255:
276 nm Absorbance 0 . 6 5 0 . 6 4 0
- Page 256 and 257:
k obs(1 st ) , s -1 0.4 0.3 0.2 0.1
- Page 258 and 259:
Table S5.5: Average observed rate c
- Page 260 and 261:
ln(k 2(2 nd ) /T) -8.0 TU -8.5 -9.0
- Page 262 and 263:
pzn PPM -1750.0 -1850.0 -1950.0 -20
- Page 264 and 265:
Table S5.9: Average observed rate c
- Page 266 and 267:
Figure S5.13: UV/Visible spectra fo
- Page 268 and 269:
k obs(1 st ) in s -1 0.030 0.025 0.
- Page 270 and 271:
Table S5.17: Average observed rate
- Page 272 and 273:
ln(k 2(2 nd ) /T) -10 -11 -12 -13 -
- Page 274 and 275:
9.61 ppm Ha PPM 9.8 9.6 9.4 9.2 9.0
- Page 276 and 277:
Table S5.22: Average observed rate
- Page 278 and 279:
k obs(3rd) / s -1 -5 8 .00 x 10 T U
- Page 280 and 281:
ln(k st 2(1 ) /T) -1.5 TU DMTU TMTU
- Page 282 and 283:
ln(k rd 2(3 ) /T) -8.5 -9.0 -9.5 -1
- Page 284 and 285:
SpinWorks 2.5: znPt(II)-OP4 in D2O
- Page 286 and 287:
Figure S5.31: Mass spectrum for com
- Page 288 and 289:
Table S5.28: Average observed rate
- Page 290 and 291:
Table S5.29: Average observed rate
- Page 292 and 293:
ln(k st 2(1 ) /T) -4 -5 -6 -7 -8 -9
- Page 294 and 295:
SpinWorks 2.5: phtPt(II)-OP2 in D2O
- Page 296 and 297:
Figure S5.41: Mass spectrum for com
- Page 298 and 299:
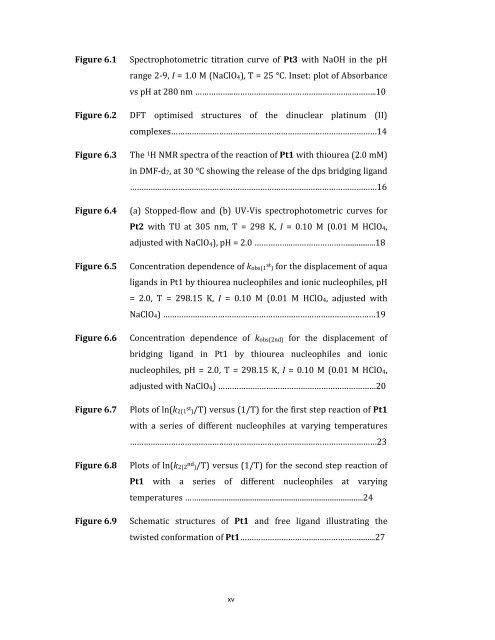
List of Figures Figure 6.1: Spectro
- Page 300 and 301:
Chapter 6 Tuning Reactivity of Plat
- Page 302 and 303:
Against this background, several re
- Page 304 and 305:
6.2.2 Instruments Microanalyses wer
- Page 306 and 307:
Metal Complex Pt3 Yield: 52.5 mg (0
- Page 308 and 309:
6.3 Results 6.3.1 Synthesis and Cha
- Page 310 and 311:
The pKa values obtained are summari
- Page 312 and 313:
Table 6.2: DFT-calculated parameter
- Page 314 and 315:
that of dinuclear Pt(II) complexes
- Page 316 and 317:
It can be concluded that substituti
- Page 318 and 319:
ate constants, kobs(1 st /2 nd ), w
- Page 320 and 321:
Table 6.3: Summary of rate constant
- Page 322 and 323:
6.3.6 Activation Parameters The act
- Page 324 and 325:
pKa1 values become smaller. In addi
- Page 326 and 327:
of steric influence is felt by the
- Page 328 and 329:
6.5 Conclusion The present study ha
- Page 330 and 331:
17 O. F. Wendt and L. I. Elding, 19
- Page 332 and 333:
51 Y. Iwadata, K. Kawamura, K. Igar
- Page 334 and 335:
Table S6.3: Average observed rate c
- Page 336 and 337:
Table S6.4(b): Average observed rat
- Page 338 and 339:
ln(k 2(2 nd ) /T) -4 -6 -8 -10 -12
- Page 340 and 341:
45.0 40 35 30 25 20 %T 15 10 5 0 -5
- Page 342 and 343:
k st obs(1 ) in s-1 0.30 Br TU 0.25
- Page 344 and 345:
Table S6.9: Average observed rate c
- Page 346 and 347:
-2304.16 ppm H 3N PPM -2200.0 -2220
- Page 348 and 349:
Table S6.10: Average observed rate
- Page 350 and 351:
Table S6.13: Average observed rate
- Page 352 and 353:
Absorbance 1.6 1.4 1.2 1.0 0.8 0.6
- Page 354 and 355:
SH N SH + Mechanism Br N + CO 3 2-
- Page 356 and 357:
Figure 7.5: 195Pt NMR spectra of mi
- Page 358 and 359:
linker remained coordinated to the
- Page 360 and 361:
complexes, have a lower charge and
- Page 362 and 363:
ange 326-400 cm -1 (weak) for Pt-Cl
- Page 364 and 365:
ButPt, HexPt, OctPt and DecPt, were
- Page 366 and 367:
7.3 Results 7.3.1 DFT Calculations
- Page 368 and 369:
Structure HOMO LUMO EnPt (C2h) Prop
- Page 370 and 371:
Absorbance Table 7.2: Summary of pK
- Page 372 and 373:
coordination to the soft Pt(II) cen
- Page 374 and 375:
observed at -2962.4 and -3024.1 ppm
- Page 376 and 377:
H 3N NH 3 Pt NH 2 OH 2 n NH 3 NH 2
- Page 378 and 379:
k obs2 , in s -1 -3 TU 1.2x10 DMTU
- Page 380 and 381:
7.3.4 Activation Parameters The tem
- Page 382 and 383:
density is located on the metal cen
- Page 384 and 385:
acetylmethionine, which reported th
- Page 386 and 387:
References 1 (a) B. Rosenberg, L. V
- Page 388 and 389:
32 N. Summa, J. Maigut, R. Puchta a
- Page 390 and 391:
Appendix 7 Table S7.1: Summary of s
- Page 392 and 393:
k obs(2 nd ) , in s -1 0.00020 0.00
- Page 394 and 395:
ln(k 2(2 nd ) /T) -8.5 -9.0 -9.5 -1
- Page 396 and 397:
k obs(1 st ) , in s -1 0.06 TU DMTU
- Page 398 and 399:
ln(k 2(1 st ) /T) -3.2 TU DMTU TMTU
- Page 400 and 401:
Table S7.11: Summary of kobs(2 nd )
- Page 402 and 403:
Table S7.13: Average observed rate
- Page 404 and 405:
%T 22.0 20 18 16 14 12 10 8 6 4 2 0
- Page 406 and 407:
k st obs(1 ) , in s-1 0.10 0.08 0.0
- Page 408 and 409:
ln(k st 2(1 ) /T) -4.0 TU DMTU TMTU
- Page 410 and 411:
Figure S7.23: Mass spectra for HexP
- Page 412 and 413:
Table S21: Average observed rate co
- Page 414 and 415:
Table S7.23: Summary of kobs(2 nd )
- Page 416 and 417:
Table S7.25: Average observed rate
- Page 418 and 419:
90.0 80 70 60 50 40 30 20 %T 10 0 -
- Page 420 and 421:
Figure S7.37: Mass spectrum for Hex
- Page 422 and 423:
Chapter 8 Tuning Reactivity of plat
- Page 424 and 425:
dinuclear Pt(II) complexes to relea
- Page 426 and 427:
finally Pt2. The order of reactivit
- Page 428:
• prolonged survival in the cell