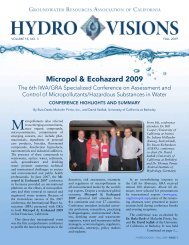
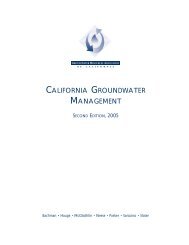
Dispersivity - Groundwater Resources Association of California
Dispersivity - Groundwater Resources Association of California
Dispersivity - Groundwater Resources Association of California

You also want an ePaper? Increase the reach of your titles
YUMPU automatically turns print PDFs into web optimized ePapers that Google loves.
GRA GRA Proudly Proudly Presents: Presents:<br />
GRACast: GRACast: May May 26, 26, 2011 2011<br />
Dr Dr Dr. Dr. Fred Fred Fred Fred Payne Payne Payne, Payne, ARCADIS ARCADIS ARCADIS ARCADIS<br />
“The “The Continuing Continuing Evolution Evolution<br />
<strong>of</strong> <strong>of</strong> <strong>of</strong> <strong>of</strong> Remediation Remediation Remediation Remediation Hydrogeology<br />
Hydrogeology<br />
Hydrogeology”<br />
Hydrogeology”<br />
Join JJJoin ii GRA GRA GRA GRA TODAY! TODAY! TODAY! TODAY!<br />
Email questions during the event to<br />
gracast@grac.org<br />
gracast@grac.org<br />
1
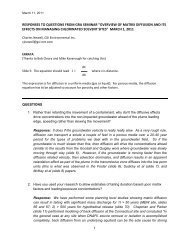
Mark Mark your your Calendar: Calendar:<br />
Upcoming Upcoming GRA GRA Events Events<br />
(find ( (find ( out out more more at at www.grac.org)<br />
www.grac.org) gg g) g)<br />
Join JJJoin ii GRA GRA GRA GRA TODAY! TODAY! TODAY! TODAY!<br />
• <strong>Groundwater</strong> /Surface Water Interaction: <strong>California</strong>’s Legal and<br />
Scientific Disconnect. June 14, 2011, Sacramento, CA<br />
GRACast: National <strong>Groundwater</strong> Monitoring Network . June 28,<br />
2011<br />
28 th Biennial Conference and 20 th GRA Annual Meeting. October 5<br />
and 6, Sacramento, CA<br />
Advanced Tools Workshop: November 17, 2011 (more info coming<br />
soon)<br />
Emerging Contaminants: February 2012 (more info coming soon)<br />
2
The Continuing Evolution <strong>of</strong><br />
Remediation Hydrogeology<br />
Getting Things Done in a<br />
Heterogeneous, Anisotropic World<br />
<strong>California</strong> GRA Webcast<br />
<strong>California</strong> GRA Webcast<br />
May 26, 2011<br />
Fred C. Payne, Ph.D. ARCADIS
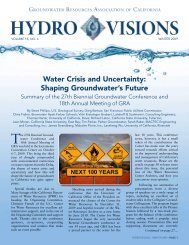
Evolving Remediation<br />
Hydrogeology - Outline<br />
Remediation hydrogeology, defined<br />
Hydrogeology Outline Hydraulics and transport<br />
Changing conceptual foundation<br />
Tracing the origins <strong>of</strong> dispersivity<br />
The advection-diffusion model comes <strong>of</strong><br />
age<br />
Mapping transport and storage<br />
Separating characterization from<br />
monitoring<br />
Advantage <strong>of</strong> real-time, adaptive highres<br />
characterization<br />
Using g improved p characterization to<br />
reduce remedy costs<br />
Saskatchewan River, Alberta<br />
4
Remediation Hydrogeology – An<br />
interdisciplinary practice <strong>of</strong> environmental<br />
science and engineering that has the<br />
objectives <strong>of</strong> quantifying and removing or<br />
containing unacceptable contaminants in<br />
groundwater.<br />
Mapping contaminant transport<br />
and storage in aquifers<br />
Quantifying potential for<br />
contaminant exposure<br />
Designing g g control strategies g and<br />
remedial actions that contain or<br />
eliminate the potential risks<br />
associated with contaminants in<br />
groundwater<br />
5
Why is Change Needed?<br />
Difficulties in predicting contaminant migration<br />
Remedies <strong>of</strong>ten disappoint<br />
Costs to closure are quite high<br />
Past experience is generating significant<br />
pressure to declare sites as “technically<br />
impracticable”<br />
impracticable<br />
6
If we abandon the simplifying assumptions,<br />
what can we gain?<br />
Improved predictability (although<br />
modeling is a more significant<br />
challenge)<br />
Typically, remedies can be much<br />
more focused, saving money on<br />
remedy design and operation<br />
Remedy effectiveness may<br />
increase significantly<br />
Site characterization requires<br />
increased investment, but:<br />
How do we get the data cost<br />
effectively?<br />
How can we use the data to<br />
reduce remedy costs?<br />
7
The Water Supply Hydraulics Legacy<br />
Focused on very large scale<br />
aquifer productivity<br />
Conservatively estimates<br />
aquifer yield<br />
Based on large-scale averages<br />
and steady-state observations<br />
Works very well for water<br />
supply, however:<br />
Bulk aquifer analysis can<br />
obscure important details<br />
Underestimates transport<br />
velocities<br />
Canadian River Municipal Water Authority<br />
2,250+ gpm
Conceptual Foundation<br />
That allowed linkage <strong>of</strong> transport<br />
analysis to hydraulics<br />
A series <strong>of</strong> simplifying<br />
assumptions regarding the<br />
aquifer matrix …<br />
Homogeneous<br />
Isotropic<br />
Gaussian<br />
Steady-State<br />
Well sorted coarse sand, Makaha Beach, Oahu<br />
9
The concept <strong>of</strong> dispersion was developed as an adjunct to<br />
large-scale groundwater hydraulics, to provide simplified<br />
predictions <strong>of</strong> contaminant migration<br />
velocity-independent<br />
y p<br />
dispersion (diffusivity)<br />
D = v D*<br />
L L x<br />
velocity-dependent<br />
dispersion<br />
(hydrodynamic<br />
dispersivity)<br />
presumed to be a<br />
minor factor<br />
The Gaussian outcome <strong>of</strong> the advection-dispersion equation (ADE):<br />
C <br />
0 L vx t vx L L vx t<br />
C erfc erfc exp exp<br />
erfc<br />
<br />
erfc<br />
2 <br />
<br />
2 DL t <br />
DL<br />
2 DL t
Tracing the origins <strong>of</strong> dispersivity<br />
The old view - “Classic”<br />
transverse dispersivity<br />
Calculated from<br />
mechanical dispersion<br />
coefficients (alpha x,y,z)<br />
that aren’t tied to any site<br />
structure or contaminant<br />
characteristics
Tracing the<br />
origins <strong>of</strong><br />
hydrodynamic<br />
dispersivity p y<br />
Danel’s work at<br />
UNESCO (1952) ( ) – he<br />
described a 6° “cone”<br />
in conceptual<br />
dispersion studies…<br />
The visual depictions<br />
associated with that<br />
work k gave a different diff t<br />
impression<br />
28° arc
Tracing the origins <strong>of</strong> hydrodynamic dispersivity<br />
<br />
1972
Freeze and Cherry followed Bear’s lead…<br />
1979
… as did Fetter and others<br />
1980 - 2001
Re-Thinking <strong>Dispersivity</strong><br />
Fluid dynamics – random walk prohibited in saturated porous medium laminar<br />
flow systems<br />
Logical (mathematical) analysis – reductio ad absurdum<br />
What do field studies show?<br />
Cape Cod tracer study<br />
Borden aquifer studies<br />
Ft Devens Devens, MA<br />
16
<strong>Dispersivity</strong> – A Founding Simplification That<br />
Needs Revision<br />
Two sources <strong>of</strong> dispersion:<br />
Contaminant molecules<br />
randomly spread out in<br />
groundwater and become<br />
more dilute with time – (this is<br />
aqueous-phase diffusion) time<br />
Water was assumed to<br />
randoml spreads in the<br />
saturated aquifer matrix,<br />
further spreading the<br />
contaminant molecules –<br />
(note that water is an<br />
incompressible fluid in<br />
laminar flow condition)<br />
NOT TRUE<br />
distance<br />
TRUE<br />
17
<strong>Dispersivity</strong> comes undone via reductio ad absurdum<br />
- Extending Pascal’s Triangle to Large Scales<br />
18
Extended Random Walk – Probability <strong>of</strong> lateral dispersion<br />
becomes immensely improbable<br />
Binn<br />
counts aftter<br />
a 10,000-ball<br />
trial<br />
300<br />
250<br />
200<br />
150<br />
100<br />
50<br />
0<br />
11,000 000 – step lattice<br />
0.5 m travel through 1 mm particles<br />
Average <strong>of</strong> 100 trials<br />
-400 -200 0 200 400<br />
Outlet channel position, relative to centerline<br />
45 45
DeMoivre-LaPlace Expansion for Extended Lattices<br />
Distance D fromm<br />
Centerlinee<br />
(m)<br />
4<br />
3<br />
2<br />
1<br />
0<br />
0 250 500 750 1000<br />
Distance Travelled (m)<br />
99% 9<br />
99.99% %<br />
99.99999%<br />
If 1 k l th l d lk di i<br />
If 1 kg leaves the source plane, random walk dispersion<br />
drives less than 1 mg beyond 3.5 m from the plume<br />
centerline, in 1,000 m <strong>of</strong> travel along the plume axis
Field research repeatedly confirms that transverse<br />
dispersivity is near-zero<br />
Borden aquifer studies – Rivett, Feenstra and Cherry<br />
Natural aquifers q show near-zero<br />
transverse dispersivity
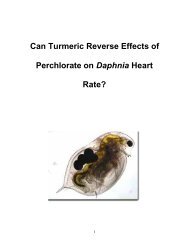
Cape Cod Tracer Studies<br />
LeBlanc, et al., 1991<br />
3t 3tracer iinjection j ti wells ll Garabedian and LeBlanc LeBlanc, 1991<br />
656 multi-level<br />
samplers over 200-m<br />
flow path<br />
Garabedian and<br />
LeBlanc LeBlanc, 1991<br />
Transverse horizontal<br />
dispersivity = 1.8 cm<br />
Transverse vertical<br />
dispersivity = 1.5 mm<br />
Hess, et al., 1992<br />
22
Borden Tracer Simulation<br />
Longitudinal dispersion increases with screened interval length – short screened intervals<br />
yield low dispersivity (i.e., longitudinal dispersion is partly an artifact <strong>of</strong> the screened<br />
interval – the longer the screen, the greater the apparent longitudinal dispersivity)
Implications <strong>of</strong> Near-Zero<br />
<strong>Dispersivity</strong><br />
Contaminant mass transport<br />
is should be controlled by the<br />
aquifer matrix structure. With<br />
very y limited spreading. p g<br />
Contaminants are likely to be<br />
concentrated in a small<br />
portion <strong>of</strong> the aquifer cross<br />
section<br />
Remedies may be designed<br />
ttottake k advantage d t <strong>of</strong> f thi this<br />
distribution pattern
Compare:<br />
Dispersive<br />
Prediction<br />
versus<br />
Actual Plume<br />
Development<br />
The<br />
Ft Ft. Devens<br />
Example<br />
Expected plume<br />
migration pattern,<br />
if the standard<br />
dispersivity model<br />
were correct
Actual<br />
Ft Ft. Devens<br />
Plume<br />
Negative<br />
transverse<br />
dispersivity<br />
(plume narrows)<br />
Transport<br />
velocity more<br />
than 10-fold<br />
greater than<br />
average velocity<br />
PCE > 1,000 ug/L<br />
extended more than 3-<br />
fold farther than<br />
projected with<br />
advection-dispersion<br />
IImplications: li ti<br />
- Plumes are long, narrow and more<br />
concentrated<br />
- Dispersion-based search patterns<br />
easily miss the plume
Jan-Feb 2005<br />
Contaminant transport<br />
isn’t random – it’s<br />
controlled by the<br />
hydrostratigraphy.<br />
Ch li i<br />
Channeling is now<br />
commonly reported in<br />
the literature
A New Conceptual Foundation<br />
That Precedes The Conceptual Site Model Development<br />
Homogeneous g<br />
Heterogeneous g<br />
Isotropic<br />
Gaussian<br />
Steady-State<br />
Anisotropic<br />
LogNormal<br />
Perpetual Transient State<br />
28
Fate and Transport in a Heterogeneous<br />
Aquifer – An early publication …<br />
29
<strong>Dispersivity</strong> Replaced – The Advection-Diffusion<br />
Approach Comes <strong>of</strong> Age<br />
Transport occurs in mobile<br />
pore space channels<br />
30
Aquifer Matrix<br />
Structure Effects<br />
– <strong>Groundwater</strong><br />
and Mass<br />
Contaminant<br />
Mass Transport<br />
Bulk averaging<br />
obscures velocity<br />
impacts <strong>of</strong><br />
heterogeneities g<br />
31
Matrix Structure Controls Diffusion Impact<br />
32
Aquifer Matrix Structure Effects – Mass Storage<br />
Two aquifer volumes with equal:<br />
Average hydraulic conductivity<br />
Mobile porosity<br />
<strong>Groundwater</strong> transport velocity<br />
In the high-mass-transfer<br />
geometry, the rate <strong>of</strong> f diffusive ff<br />
migration into the low-K zones is<br />
approximately 10-fold greater<br />
than for the low-mass-transfer<br />
low mass transfer<br />
case.<br />
Shorter diffusion path lengths<br />
Increase surface area for<br />
diff diffusive i exchange<br />
h
Major Concept – Diffusion Impacts Mass Transport and<br />
Storage in Real Aquifers<br />
multi-permeability aquifer<br />
diffusive mass storage<br />
TCE storage capacity in a<br />
heterogeneous aquifer<br />
34
Multi-Domain Transport and Storage<br />
35
Multi-Domain Transport and Storage<br />
36
A Closer Look at Heterogeneities<br />
10,000 mg/kg TOC < 500 mg/kg TOC<br />
37
A closer look at flow heterogeneity<br />
Flow (> 99%) Storage (> 99%)<br />
10 -2 cm/sec<br />
1,000 ft/year<br />
10-6 10 cm/sec<br />
0.1 ft/year<br />
10 -4 cm/sec<br />
10 ft/year<br />
38
Key Outcome: Plume Maturation in<br />
a MMulti-Porosity lti P it SSystem t<br />
Development<br />
<strong>of</strong> mass<br />
storage in<br />
low-mobilityy<br />
pore spaces,<br />
through<br />
aqueous-<br />
phase<br />
diffusion<br />
Early plume<br />
development<br />
Maturing<br />
plume<br />
After source<br />
removal<br />
39
Depth D (z-axxis)<br />
Dissolved-phase plume expansion<br />
High-K, High-C zone<br />
Diffusive mass transfer<br />
from high-K to low-K zones<br />
Low-K, Low-C zone
Depth D (z-axxis)<br />
Dissolved-phase plume contraction<br />
High-K, Low-C zone<br />
Diffusive mass transfer<br />
from low-K to high-K zones<br />
Low-K, Mid-C zone
Heterogeneities<br />
and Diffusive<br />
Storage Have a<br />
Major Impact on<br />
Migration <strong>of</strong> a<br />
Clean Water Front<br />
Heterogeneous,<br />
anisotropic system<br />
(most natural aquifers)<br />
Homogeneous,<br />
isotropic system<br />
(theoretical and<br />
few laboratory<br />
systems)
Impact <strong>of</strong> Plume Maturation on Cleanup Times<br />
43
Question & Answer Break<br />
Beaver Island, Northern Lake Michigan<br />
44
A Revised Conceptual<br />
Framework<br />
Heterogeneous<br />
Heterogeneous,<br />
anisotropic matrix<br />
Structured by y depositional p<br />
processes<br />
Becomes tractable<br />
through<br />
Intensified<br />
characterization<br />
Hydrostratigraphic<br />
analysis<br />
45
What We’ve Observed (1) – <strong>Groundwater</strong> flow (and target<br />
compound mass transport) is <strong>of</strong>ten concentrated in a small<br />
portion <strong>of</strong> the aquifer cross-section<br />
Depthh<br />
(z-axis)<br />
Mass flux distribution is<br />
ttypically i ll concentrated t t d iin a ffew<br />
high-conductivity conduits
What We’ve Observed (2) – <strong>Groundwater</strong> elevation gradients are<br />
poor predictors <strong>of</strong> local groundwater flow direction<br />
1 Mile<br />
40°<br />
<strong>of</strong>fset<br />
47
What We’ve Observed (3) – High-definition mapping allows<br />
remedy focusing – significant return on characterization<br />
investment during remedial action<br />
<strong>Groundwater</strong> flow axis<br />
Invasion front, with<br />
Mature plume area with<br />
mass concentrated in<br />
mass concentrated in<br />
higher-flow zones<br />
lower-flow (especially<br />
interbedded) zones
Three Premises on Getting<br />
Plumes to Closure<br />
Aquifer matrix structure, chemical properties<br />
and exposure duration control how easily we<br />
can get to site closure closure.<br />
For small plumes, intensive remedial action<br />
can <strong>of</strong>ten defeat the matrix structure and<br />
exposure duration problems problems, allowing us to<br />
reach a cost-effective site closure.<br />
For large plume footprints, intensive<br />
treatment <strong>of</strong> the entire footprint is normally<br />
not affordable and we work toward site<br />
closure with a combination <strong>of</strong> active<br />
treatment zones and zones <strong>of</strong> clean water<br />
flushing. In these cases, the target<br />
compound, the age <strong>of</strong> release and the<br />
aquifer matrix structure are all critical<br />
ddeterminants t i t in i how h easily il we get t tto closure.<br />
l
How do we get the data?<br />
Introducing Next Generation Site Characterization – Building Detailed<br />
Physical Site and Contaminant Distribution Mappings<br />
High-Definition mapping in 3-dimensions<br />
Real Real-time time data collection and adjustment <strong>of</strong> search patterns<br />
High-Definition Mapping Trial<br />
Collaborative Demonstration with<br />
Amsted Industries<br />
50
evisse<br />
design<br />
continnue<br />
operationn<br />
No<br />
Site Characterization<br />
Baseline geochemistry and hydrogeology sampling<br />
No<br />
Remedy selection and initial design<br />
Design support and pilot study sampling<br />
Key design assumptions<br />
validated?<br />
Yes<br />
Final design and full-scale system construction<br />
Full-scale system operation<br />
Key system operating parameters –<br />
technology-specific<br />
SSystem t variables i bl within ithi accepted t d<br />
range?<br />
Yes<br />
No<br />
Site Characterization is<br />
the Key to Closure:<br />
Conceptual Site Model<br />
Development<br />
Remedy Selection and<br />
Design, and<br />
Operational Decision-<br />
Making<br />
modify dif<br />
operation<br />
Troubleshooting based on expanded variables list<br />
Project objectives achieved? Adaptive Adaptive Design, Design, Data Data Discipline Discipline<br />
Yes<br />
and Decisiveness<br />
Remedy complete
Conceptual Site<br />
Model Development<br />
Built incrementally<br />
Data-driven<br />
Matures through<br />
hypothesis yp testingg<br />
Becomes increasingly<br />
quantitative,<br />
independent <strong>of</strong><br />
numerical modeling<br />
Continues to evolve<br />
th through h th the entire ti<br />
project life cycle,<br />
including remedy<br />
operation
Remedy Design Support Data<br />
Wh What t we need d … Methods to obtain data …<br />
Target compound distribution Hydrostratigraphic analysis<br />
Mass storage zones<br />
Mass transport zones<br />
Fluid flow characteristics<br />
Natural gradient transport<br />
velocities<br />
Fluid injectability<br />
Aquifer matrix mass transfer<br />
behavior<br />
High-mass-transfer versus<br />
low-mass-transfer<br />
NAPL mobility<br />
Cone penetrometry<br />
Hydraulic pr<strong>of</strong>iling tools<br />
Vertical aquifer q ppr<strong>of</strong>iling g<br />
Short, temporary screens<br />
Waterloo pr<strong>of</strong>iler<br />
Natural gradient tracer studies<br />
Reagent injection testing<br />
LNAPL tracing
Scale-Dependent<br />
Remedial Strategies<br />
Spectrum<br />
<strong>of</strong> Sites
Remedial Strategy Drives<br />
Characterization Requirements
Re-Thinking Monitoring Wells – Separate Site<br />
Characterization from Monitoring<br />
10-year life-cycle cost <strong>of</strong> a single<br />
monitoring well ~ $150,000<br />
(construct (construct, develop develop, monitor and<br />
report quarterly, abandon)<br />
AFCEE study – less than 10% <strong>of</strong><br />
analyses l exceeded d d regulatory l t<br />
criteria (all compounds analyzed)<br />
New approach – separate site<br />
characterization from monitoring<br />
well construction – characterize<br />
then determine most effective<br />
monitoring it i well ll llocations. ti<br />
Yields a significant reduction in the<br />
number <strong>of</strong> monitoring g wells<br />
56
Three-Fold Characterization Strategy<br />
1. Direct mapping framework: geology and target compound<br />
sample collection to build a rudimentary three-dimensional<br />
mapping;<br />
2. Interpolation (extending the mapping between points <strong>of</strong> direct<br />
observation) and extrapolation (extending the mapping outside<br />
the range <strong>of</strong> direct observations) – For example,<br />
hydrostratigraphic analysis to form an interpolated mapping from<br />
the explicit mapping points and to guide further sample<br />
collections, ll ti and; d<br />
3. Stimulus-response and hypothesis testing – on-going<br />
refinement <strong>of</strong> the target compound distribution and hydrogeology<br />
iinterpretations t t ti iin response tto pumping i and d iinjection j ti ttrials, i l<br />
remedy pilot testing and other transient-state system<br />
observations.
Basic Approaches to Building Scale-<br />
Dependent Characterization Datasets<br />
Direct Characterization<br />
Discrete-interval samples p<br />
Continuous lithologic logs<br />
Hydraulic pr<strong>of</strong>iling<br />
Interpolation and Extrapolation<br />
Hydrostratigraphic analysis<br />
GGeophysical h i l ttesting ti<br />
Stimulus-Response Testing<br />
Tracer injection<br />
Slug and pumping tests – focus on<br />
transients<br />
Remedy performance
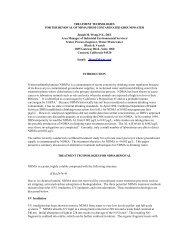
Example: Building and interpreting a high-<br />
resolution site characterization<br />
Source cut <strong>of</strong>f 1975<br />
Look inside the envelope: TCE resides in lower-K zones<br />
Interpretation: trailing edge <strong>of</strong> long-term washout<br />
High-Definition Mapping Trial<br />
Collaborative Demonstration with<br />
Amsted Industries<br />
59
Mapping at High Definition<br />
Challenge – 10+ yrs <strong>of</strong><br />
conventional investigation<br />
Plume mapped using 50+<br />
wells did not resolve site<br />
owner’s owner s concerns concernsabout about<br />
contaminant transport and<br />
past lagoon discharges<br />
High permeability sand<br />
aquifer<br />
Solution – High-Definition plume<br />
mapping to expedite<br />
characterization<br />
Adaptive scope <strong>of</strong> vertical<br />
pr<strong>of</strong>iling to map plume and<br />
evaluate remedy options
Prior Monitoring Well<br />
Network and 3D Plume<br />
Interpretation
High-Definition TCE Pr<strong>of</strong>iling
High-Definition TCE Plume
Building a Conceptual Site Model – Original<br />
Source, pre-1975<br />
64
Building a Conceptual Site Model – Clean<br />
water wash-out, post-1975<br />
65
Outcome<br />
Investment<br />
40-acre parcel, 100-ft thick,<br />
mapped at high-res (1,000<br />
discrete samples) for the life<br />
cycle cost <strong>of</strong> 3 monitoring wells<br />
Return on Investment<br />
Identified unknown plume with<br />
upgradient sources<br />
Demonstrated concentrated<br />
plume: More than 95% <strong>of</strong> the<br />
mass discharge occurs in less<br />
than 10% <strong>of</strong> the cross-section<br />
High-definition plume mapping<br />
will focus remedy
Putting the Evolved Hydrogeology to the Test ….<br />
33-mile-long mile long TCE plume plume in<br />
the Ogallala Aquifer (alluvial<br />
fan, 100 to 150 feet bgs)<br />
Performance based<br />
contract – MCLs in 10 years<br />
Principle p challenges: g<br />
Find and intercept TCE in<br />
transport<br />
PPotential t ti l TCE storage t in i<br />
the dispersed plume<br />
Former Reese AFB, Texas<br />
67
Former Reese AFB Environmental Sites<br />
Solvent Still Area<br />
Southwest Landfill<br />
Tower Area Plume<br />
Petroleum, Oil and Lubricants (POL) Area<br />
Plume Status - 2004<br />
68
2005
2007
ERD Treatment Sector<br />
2008
2009
2010
2010
2011<br />
75
Why are MCLs Possible at This Site?<br />
Site Hydrogeology<br />
No DNAPL was found below the aquifer surface<br />
Vadose zone source mass was completely removed<br />
Fast flowing, low-mass-transfer groundwater system<br />
Diffusive interaction limited – no significant mass storage effects outside<br />
the source zone<br />
Site Characterization<br />
Hydrogeology and conceptual site model continually re-assessed<br />
Remedy adjusted as-needed<br />
Regulatory<br />
Allows flexibility in site operation<br />
Collaborative environment<br />
Relations with Adjacent Landowners<br />
Gaining site access where it was previously denied<br />
Maintaining good working relationships was critical to the success <strong>of</strong> this<br />
project p j<br />
76
Recap<br />
Remediation hydrogeology is transitioning away from its older<br />
simplifying assumptions that were associated with hydraulic<br />
anal analysis. sis<br />
Recognizing the heterogeneous anisotropic nature <strong>of</strong> aquifers, it<br />
clear that site characterization efforts need to be intensified.<br />
Separation <strong>of</strong> monitoring and characterization processes is critical<br />
to cost-effective characterization and effective monitoring.<br />
IInvestment t t in i site it characterization h t i ti can yield i ld several-fold l f ld returns t<br />
through optimization <strong>of</strong> monitoring and cost reductions for remedy<br />
installation and operation.<br />
Real-time, high-resolution site characterization methods are<br />
developing rapidly.<br />
77
Beaver Island, Northern Lake Michiga<br />
78
Join Join GRA GRA TODAY! TODAY!<br />
Send your questions to this presentation<br />
anytime to gracast@grac.org<br />
For more information on GRA<br />
including membership<br />
opportunities, pp , pplease<br />
see our<br />
web site at<br />
www.grac.org<br />
Please help us make future events better by providing us feedback<br />
at our online survey at http://www.grac.org/gracastsurvey Last page