Testing for homogeneity of variance
Testing for homogeneity of variance
Testing for homogeneity of variance

You also want an ePaper? Increase the reach of your titles
YUMPU automatically turns print PDFs into web optimized ePapers that Google loves.
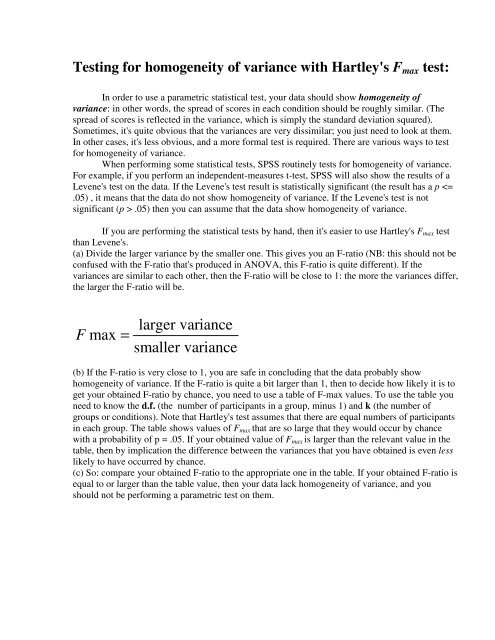
<strong>Testing</strong> <strong>for</strong> <strong>homogeneity</strong> <strong>of</strong> <strong>variance</strong> with Hartley's Fmax test:<br />
In order to use a parametric statistical test, your data should show <strong>homogeneity</strong> <strong>of</strong><br />
<strong>variance</strong>: in other words, the spread <strong>of</strong> scores in each condition should be roughly similar. (The<br />
spread <strong>of</strong> scores is reflected in the <strong>variance</strong>, which is simply the standard deviation squared).<br />
Sometimes, it's quite obvious that the <strong>variance</strong>s are very dissimilar; you just need to look at them.<br />
In other cases, it's less obvious, and a more <strong>for</strong>mal test is required. There are various ways to test<br />
<strong>for</strong> <strong>homogeneity</strong> <strong>of</strong> <strong>variance</strong>.<br />
When per<strong>for</strong>ming some statistical tests, SPSS routinely tests <strong>for</strong> <strong>homogeneity</strong> <strong>of</strong> <strong>variance</strong>.<br />
For example, if you per<strong>for</strong>m an independent-measures t-test, SPSS will also show the results <strong>of</strong> a<br />
Levene's test on the data. If the Levene's test result is statistically significant (the result has a p
k (number <strong>of</strong> groups)<br />
d.f. (number <strong>of</strong> participants<br />
per group - 1) 2 3 4 5 6 7<br />
2 39 87.5 142 202 266 333<br />
3 15.4 27.8 39.2 50.7 62 72.9<br />
4 9.6 15.5 20.6 25.2 29.5 33.6<br />
5 7.15 10.8 13.7 16.3 18.7 20.8<br />
6 5.82 8.38 10.4 12.1 13.7 15<br />
7 4.99 6.94 8.44 9.7 10.8 11.8<br />
8 4.43 6.00 7.18 8.12 9.03 9.8<br />
9 4.03 5.34 6.31 7.11 7.8 8.41<br />
10 3.72 4.85 5.67 6.34 6.92 7.42<br />
12 3.28 4.16 4.79 5.3 5.72 6.09<br />
15 2.86 3.54 4.01 4.37 4.68 4.95<br />
20 2.46 2.95 3.29 3.54 3.76 3.94<br />
30 2.07 2.4 2.61 2.78 2.91 3.02<br />
60 1.67 1.85 1.96 2.04 2.11 2.17<br />
A worked example:<br />
Suppose we do an experiment that has two conditions, A and B. Here are the data.<br />
score: condition:<br />
6 condition A<br />
7 condition A<br />
5 condition A<br />
6 condition A<br />
7 condition A<br />
8 condition A<br />
11 condition B<br />
12 condition B<br />
13 condition B<br />
11 condition B<br />
4 condition B<br />
16 condition B<br />
For condition A, the mean and s.d. are 6.50 and 1.05.<br />
For condition B, the mean and s.d. are 11.17 and 3.97.<br />
We want to run a t-test on these data, but be<strong>for</strong>e doing so, we want to check <strong>for</strong> <strong>homogeneity</strong> <strong>of</strong><br />
<strong>variance</strong>.
The <strong>variance</strong> <strong>for</strong> condition A is 1.05 2 , which is 1.1025.<br />
The <strong>variance</strong> <strong>for</strong> condition B is 3.97 2 , which is 15.7609.<br />
It looks like the <strong>variance</strong> <strong>for</strong> condition B is quite a bit bigger than the <strong>variance</strong> <strong>for</strong> condition A.<br />
Using the Fmax test:<br />
Fmax = 15.7609 / 1.1025 = 14.2956<br />
We have 6 participants per group, and 2 groups, so d.f. = 5 and k = 2. We compare 14.2956 to the<br />
relevant value in the table, which is 7.15. Our obtained F-ratio is larger than the value in the table, and<br />
so we would conclude that the <strong>variance</strong>s are significantly different from each other - i.e. that the data do<br />
not show <strong>homogeneity</strong> <strong>of</strong> <strong>variance</strong>, and there<strong>for</strong>e we should avoid using a parametric test like the t-test.<br />
number <strong>of</strong> groups<br />
number <strong>of</strong> participants per<br />
group - 1 2 3 4 5 6 7<br />
2 39 87.5 142 202 266 333<br />
3 15.4 27.8 39.2 50.7 62 72.9<br />
4 9.6 15.5 20.6 25.2 29.5 33.6<br />
5 7.15 10.8 13.7 16.3 18.7 20.8<br />
6 5.82 8.38 10.4 12.1 13.7 15<br />
7 4.99 6.94 8.44 9.7 10.8 11.8<br />
8 4.43 6 7.18 8.12 9.03 9.8<br />
9 4.03 5.34 6.31 7.11 7.8 8.41<br />
10 3.72 4.85 5.67 6.34 6.92 7.42<br />
12 3.28 4.16 4.79 5.3 5.72 6.09<br />
15 2.86 3.54 4.01 4.37 4.68 4.95<br />
20 2.46 2.95 3.29 3.54 3.76 3.94<br />
30 2.07 2.4 2.61 2.78 2.91 3.02<br />
60 1.67 1.85 1.96 2.04 2.11 2.17