

GPR for river dyke - GSB
GPR for river dyke - GSB
GPR for river dyke - GSB

Create successful ePaper yourself
Turn your PDF publications into a flip-book with our unique Google optimized e-Paper software.
In the radargram shown in Figure 9, two sets of anomaly are found. One is between the<br />
trace number 355 to 380 and the other is in between 320 to 340. The anomaly in the red<br />
circle represents the sluice gate. The lines representing the reflections from the ground<br />
layers suddenly end from both side of red circle indicating the existence of the sluice gate.<br />
The anomaly in between traces 320 to 350 shows a different reflection pattern from the other<br />
one. This discontinuity of signal may be due to the beginning part of the sluice gate<br />
structure.<br />
4.2.2 <strong>GPR</strong> survey on Rostampur area<br />
Figure 10: <strong>GPR</strong> test layout at Rostampur area<br />
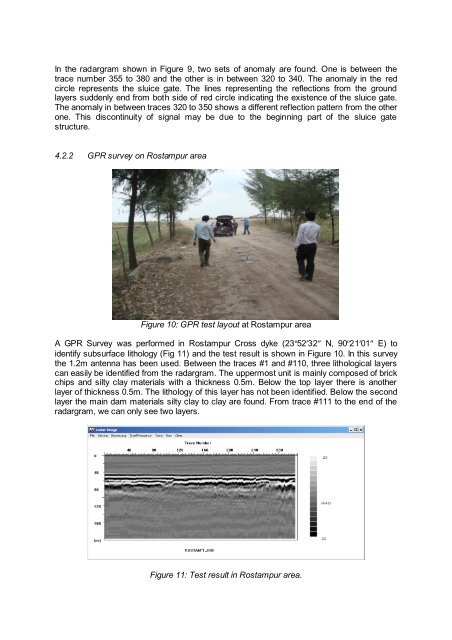
A <strong>GPR</strong> Survey was per<strong>for</strong>med in Rostampur Cross <strong>dyke</strong> (23º52′32″ N, 90º21′01″ E) to<br />
identify subsurface lithology (Fig 11) and the test result is shown in Figure 10. In this survey<br />
the 1.2m antenna has been used. Between the traces #1 and #110, three lithological layers<br />
can easily be identified from the radargram. The uppermost unit is mainly composed of brick<br />
chips and silty clay materials with a thickness 0.5m. Below the top layer there is another<br />
layer of thickness 0.5m. The lithology of this layer has not been identified. Below the second<br />
layer the main dam materials silty clay to clay are found. From trace #111 to the end of the<br />
radargram, we can only see two layers.<br />
Figure 11: Test result in Rostampur area.