A Sea-Floor Spreading Event Captured by Seismometers - Lamont ...
A Sea-Floor Spreading Event Captured by Seismometers - Lamont ...
A Sea-Floor Spreading Event Captured by Seismometers - Lamont ...

Create successful ePaper yourself
Turn your PDF publications into a flip-book with our unique Google optimized e-Paper software.
REPORTS<br />
1920<br />
29. R. I. Dzhioev et al., Phys. Rev. B 66, 153409<br />
(2002).<br />
30. A. Zrenner et al., Phys. Rev. Lett. 72, 3382 (1994).<br />
31. A. V. Khaetskii, D. Loss, L. Glazman, Phys. Rev. Lett. 88,<br />
186802 (2002).<br />
32. I. A. Merkulov, Al. L. Efros, M. Rosen, Phys. Rev. B 65,<br />
205309 (2002).<br />
33. J. Lehmann, D. Loss, Phys. Rev. B 73, 045328 (2006).<br />
34. We thank Y. K. Kato for useful advice and discussions<br />
and acknowledge support from NSF and the Air Force<br />
Office of Scientific Research.<br />
Supporting Online Material<br />
www.sciencemag.org/cgi/content/full/1133862/DC1<br />
A <strong>Sea</strong>-<strong>Floor</strong> <strong>Spreading</strong> <strong>Event</strong><br />
<strong>Captured</strong> <strong>by</strong> <strong>Seismometers</strong><br />
M. Tolstoy, 1 * J. P. Cowen, 2 E. T. Baker, 3 D. J. Fornari, 4 K. H. Rubin, 5 T. M. Shank, 4<br />
F. Waldhauser, 1 D. R. Bohnenstiehl, 1 D. W. Forsyth, 6 R. C. Holmes, 1 B. Love, 7<br />
M. R. Perfit, 8 R. T. Weekly, 1 S. A. Soule, 4 B. Glazer 2<br />
Two-thirds of Earth's surface is formed at mid-ocean ridges, yet sea-floor spreading events are<br />
poorly understood because they occur far beneath the ocean surface. At 9°50'N on the East Pacific<br />
Rise, ocean-bottom seismometers recently recorded the microearthquake character of a mid-ocean<br />
ridge eruption, including precursory activity. A gradual ramp-up in activity rates since seismic<br />
monitoring began at this site in October 2003 suggests that eruptions may be forecast in the fastspreading<br />
environment. The pattern culminates in an intense but brief (~6-hour) inferred diking<br />
event on 22 January 2006, followed <strong>by</strong> rapid tapering to markedly decreased levels of seismicity.<br />
The ocean floor is episodically created <strong>by</strong><br />
injections of magma in dikes that commonly<br />
erupt along divergent boundaries<br />
that separate tectonic plates. The timing and<br />
mechanics of these sea-floor spreading events<br />
must normally be inferred from remote seismic or<br />
hydroacoustic data and from sea-floor geology.<br />
Along fast-spreading ridges, most on-axis seismicity<br />
is too small in local magnitude (
ceptionally high light attenuation (∆c) values<br />
(>0.15 m –1 ) (Fig. 3), indicative of vigorous discharge<br />
of high-temperature hydrothermal fluids.<br />
Maximum ∆c was centered precisely over the<br />
OBS array during both cruises, with densityinversion<br />
layers found throughout the bottommost<br />
100 m, especially between 9°48.5′N and<br />
9°50.5′N. Their magnitude, variability, and near<br />
ubiquity over this area, along with exceptionally<br />
high methane concentrations, are symptomatic of<br />
a sea floor that discharges hot, potentially lowchlorinity,<br />
hydrothermal fluid. These qualities<br />
also suggest that an eruption had occurred less<br />
than 7 months before May 2006 (14).<br />
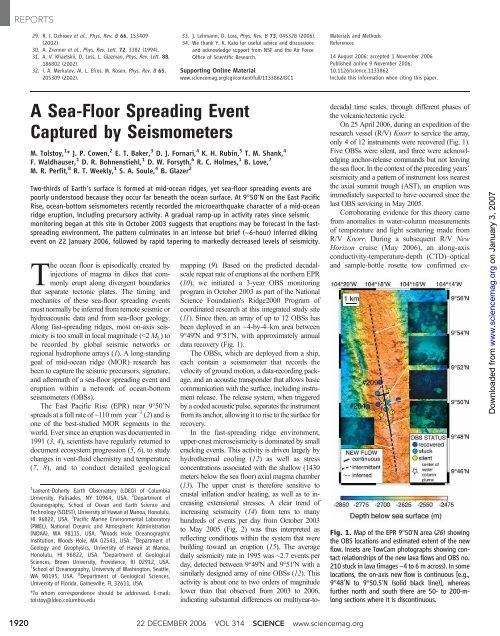
<strong>Sea</strong>-floor images collected using a digital<br />
towed camera system [TowCam (16)] confirmed<br />
the existence of new lavas and constrained the<br />
eruption's spatial extent (Fig. 1). The new lavas<br />
appear to be erupted from fissures within the<br />
AST, which reestablished quickly after the event<br />
<strong>by</strong> drain-back and collapse. Comparison of<br />
TowCam bathymetry with pre-eruption Alvin<br />
mapping (17) suggests that the AST is now 10 to<br />
15 m narrower and a few meters shallower at<br />
9°50.4′N than it was previously. Lava flow<br />
morphologies indicate that the highest effusion<br />
rates were near 9°50'N (18).<br />
Radiometric dating (14) of 10 rocks collected<br />
from the young terrain is under way, using 210 Po<br />
(4). Preliminary 210 Po results indicate that nine of<br />
the rocks were erupted within a year before their<br />
collection, with dates ranging from late summer<br />
2005 to January 2006.<br />
Based on the sea-floor images, the extent of<br />
water column anomalies, the preliminary lava<br />
ages, and the distribution of OBSs that failed to<br />
return, we estimate that the flow extended<br />
intermittently for ≥18 km along the ridge axis,<br />
from 9°46'N to 9°55.7'N, with off-axis extent<br />
ranging from 0 to ≥1 km.Theeruptionoccurred<br />
on the same segment (segment B) as the 1991 to<br />
1992 eruption, with a similar length scale.<br />
Data from only two of the four OBSs recovered<br />
in 2006 are presently available because<br />
of hard-drive problems, but efforts are being<br />
made to recover these data and more OBSs (14).<br />
The available data come from the northernmost<br />
instrument (no. 209), ~0.15 km west of the AST<br />
at 9°51'N, and the westernmost instrument (no.<br />
204), ~1.8 km west of the AST near 9°50'N<br />
(Fig. 1). Automatic phase picks (Fig. 2), combined<br />
with visual inspection of the seismograms,<br />
provide a picture of year-long high earthquake<br />
rates and abundant harmonic tremors visible at<br />
a range of frequencies, particularly in the 5- to<br />
25-Hz band. Periods of pronounced harmonic<br />
tremors reduce the signal-to-noise ratio, making<br />
automatic detection of earthquakes a less<br />
reliable indicator of large swarm activity. To<br />
better quantify the variation of seismic activity<br />
over time, we summed the root mean square<br />
(RMS) amplitude of the seismic vertical channel<br />
in the 3- to 18-Hz band within 10-min windows<br />
(Fig. 4). High-amplitude events observed on<br />
only one instrument may indicate the presence<br />
of swarms to the north or south of the array or<br />
very close to that instrument. The event on 22<br />
January is clearly the largest event at either<br />
REPORTS<br />
station and is well correlated between instruments,<br />
indicating local activity over a spatial<br />
scale important to both sensors.<br />
Fig. 2. Plot of the event rate from 3 October 2003 to 23 April 2006. Array turnarounds in April<br />
2004 and May 2005 are marked with vertical dotted lines. Different methods were used to estimate<br />
event rates for the various deployments (14). Results were normalized <strong>by</strong> comparing periods of<br />
array overlap. The inset plot shows the average daily event rates <strong>by</strong> year, including data from a<br />
1995 deployment (12).<br />
Fig. 3. Contour plot of Dc versus depth and latitude for an along-axis (ridge summit) tow-yo cast.<br />
Dc intensity is represented <strong>by</strong> colors. Potential density (sigma-theta; in kg m –3 ) contours (solid<br />
black lines) are superimposed over Dc. The dotted line indicates the saw-toothed tow pattern of the<br />
CTD-transmissometer-bottle rosette instrument package. The deepest density line indicates<br />
localized areas of instability in the lower part of the water column; the strong correlation between<br />
the vertical structures in Dc and the deep density contour line suggest that strong localized<br />
hydrothermal venting is driving the entrainment and subsequent rise of ambient bottom water.<br />
www.sciencemag.org SCIENCE VOL 314 22 DECEMBER 2006 1921<br />
on January 3, 2007<br />
www.sciencemag.org<br />
Downloaded from
REPORTS<br />
1922<br />
Seismograms and spectrograms from 22 January<br />
clearly show exceptionally high-amplitude<br />
seismic signals starting around 1345 (GMT)<br />
and continuing at high intensity for ~6 hours.<br />
Substantial earthquake activity lasted more than<br />
a week thereafter. The initial 6 hours weredominated<br />
<strong>by</strong> strong harmonic tremors and a<br />
single-station earthquake event rate often exceeding<br />
250 events per hour [compared with<br />
single-station rates of ~1.6 events per hour<br />
reported after the 1991 eruption (19)]. Both<br />
OBSs exhibit tremors at similar but not identical<br />
frequencies, indicating differences in the character<br />
of the resonator proximal to 9°51'N (no.<br />
209) and 9°50'N (no. 204). We interpret this<br />
period of most-intense activity, associated with<br />
the major spike in the seismic RMS amplitude<br />
(Fig. 4B), as propagation of the primary dike<br />
that fed this eruption. Plume distributions and<br />
high lava effusion rates inferred from lava<br />
morphology imply a dike that originated near<br />
9°50′N. This is consistent with 80 secondary<br />
wave–minus–primary wave measurements of the<br />
largest earthquakes (14), which indicate that the<br />
events were concentrated near 9°50.5′N before<br />
and during the first hour of the 6-hour period, and<br />
then were dispersed throughout the 9°49.2'N to<br />
9°50.5′N region for the remaining ~5+ hours.<br />
This supports the idea that individual eruptions<br />
occur at the fourth-order segment scale, defined<br />
<strong>by</strong> local axial discontinuities, even though<br />
volcanic systems may be organized at the thirdorder<br />
scale, defined <strong>by</strong> discontinuities with offaxis<br />
expressions (20, 3, 21, 22).<br />
At ~1445 (GMT), seismic amplitudes peaked<br />
at about five times higher than during the rest of<br />
the 6-hour high-intensity interval (Fig. 4B). This<br />
hour-long peak may coincide with the dike rising<br />
to the surface from the axial magma chamber<br />
depth of 1.43 km (13), implying a vertical propagation<br />
rate of ~1.4 km hour −1 , consistent with<br />
typical dike propagation rates at MORs (23).<br />
Thus, the vertical propagation of the crack may<br />
have been preceded <strong>by</strong> ~1 hour of precursory<br />
cracking and/or magma injection at depth,<br />
manifested <strong>by</strong> lower-amplitude but intense tremor<br />
and earthquake activity. Over the weeks after<br />
the inferred diking event, tremor and seismic<br />
activity tapered rapidly to background levels<br />
substantially lower than those in the preceding<br />
months. However, brief pulses of activity were<br />
evident through April 2006.<br />
Swarms of tremor and seismicity were<br />
observed during the preceding months as far<br />
back as May 2005 (Fig. 4A), when the last Alvin<br />
dives were conducted in this region (confirming<br />
an eruption at 9°50'N had not yet occurred). It is<br />
possible that periods of high activity may have<br />
been associated with either local minor intrusive<br />
diking/eruptive events or events north or south<br />
of the 9°50'N area, consistent with preliminary<br />
radiometric dating evidence for a mid-2005<br />
eruption at the southern end of the flow, observed<br />
contact relationships within the new flow, and<br />
evidence that the 1991-to-1992 eruptive activity<br />
lasted ~1 year (4). However, it is evident in the<br />
seismic data that the primary diking event in the<br />
immediate 9°50'N area began on 22 January 2006,<br />
consistent with the relative strength of the watercolumn<br />
signal and the stage of ecosystem recovery<br />
(14). Records from three recording temperature<br />
probes (8) deployed in high-temperature vents at<br />
the site also provide evidence that substantial<br />
changes occurred in the hydrothermal system in<br />
the January 2006 time frame (24).<br />
This event documents a known MOR eruption<br />
surface being paved over <strong>by</strong> lava from a<br />
repeat eruption, there<strong>by</strong> completing an ~15-year<br />
full volcanic cycle that has been scrutinized <strong>by</strong><br />
regular multidisciplinary monitoring. Our documentation<br />
of how seismic activity builds up<br />
before an eruption may make it possible to<br />
forecast future eruptions a year or more in advance.<br />
The brevity and intensity of the cul-<br />
Fig. 4. (A) Cumulative plot of RMS amplitude of the waveforms. OBS no. 204 is multiplied <strong>by</strong> 4 to<br />
assist comparison with OBS no. 209. (B) Spectrogram of seismic data from 1200 to 2400 on 22<br />
January 2006 from no. 209, showing the most intense activity of the year interpreted as the<br />
propagation of a dike from depth. The black line shows the RMS amplitude from Fig. 4A, which<br />
provides a quantitative measure of signal strength. db, decibels.<br />
22 DECEMBER 2006 VOL 314 SCIENCE www.sciencemag.org<br />
minating dike event suggest rapid tapping of the<br />
axial magma chamber as compared with slowerspreading<br />
ridges (23, 25). A 6-hour window for<br />
the primary diking event emphasizes the need for<br />
multidisciplinary in situ monitoring to fully<br />
characterize the geological, chemical, and biological<br />
phenomena associated with this fundamental<br />
process that shapes our planet.<br />
References and Notes<br />
1. C. G. Fox, H. Matsumoto, T.-K. A. Lau, J. Geophys. Res.<br />
106, 4183 (2001).<br />
2. S. M. Carbotte, K. C. MacDonald, J. Geophys. Res. 99,<br />
13609 (1994).<br />
3. R. M. Haymon et al., Earth Planet. Sci. Lett. 119, 85<br />
(1993).<br />
4. K. H. Rubin, J. D. MacDougall, M. R. Perfit, Nature 368,<br />
841 (1994).<br />
5. R. A. Lutz et al., Nature 371, 663 (1994).<br />
6. T. M. Shank et al., Deep-<strong>Sea</strong> Res. II 45, 465 (1998).<br />
7. K. L. Von Damm, M. D. Lilley, AGU Monogr. 144, 245 (2004).<br />
8. D. J. Fornari et al., J. Geophys. Res. 103, 9827 (1998).<br />
9. M. R. Perfit et al., Geology 22, 375 (1994).<br />
10. M. R. Perfit, W. W. Chadwick Jr., AGU Monogr. 106, 59<br />
(1998), and references therein.<br />
11. www.ridge2000.org.<br />
12. R. A. Sohn, J. A. Hildebrand, S. C. Webb, J. Geophys. Res.<br />
104, 25367 (1999).<br />
13. G. M. Kent, A. J. Harding, J. A. Orcutt, J. Geophys. Res.<br />
98, 13945 (1993).<br />
14. Materials and methods are available as supporting<br />
material on Science Online.<br />
15. M. Tolstoy, F. Waldhauser, in report of the Ridge 2000<br />
EPR ISS Science and 2006 Field Planning Workshop, 10<br />
to 12 April 2006, Palisades, NY; available at (www.<br />
ridge2000.org/science/downloads/meetings/<br />
EPRwksp_report_final.pdf).<br />
16. D. J. Fornari, Eos 84, 69 (2003).<br />
17. V. L. Ferrini et al., Geochem. Geophys. Geosys., in press.<br />
18. S. A. Soule et al., Geochem. Geophys. Geosys. 6, Q08005<br />
(2005).<br />
19. J. A. Hildebrand, S. C. Webb, L. M. Dorman, RIDGE <strong>Event</strong>s<br />
2, 6 (1991).<br />
20. K. C. Macdonald et al., Nature 335, 217 (1988).<br />
21. S. M. White et al., J. Geophys. Res. 107, B000571 (2002).<br />
22. R. M. Haymon, S. C. White, Earth Planet. Sci. Lett. 226,<br />
367 (2004).<br />
23. R. P. Dziak, C. G. Fox, Geophys. Res. Lett. 26, 3429 (1999).<br />
24. K. L. Von Damm, personal communication.<br />
25. M. Tolstoy, D. R. Bohnenstiehl, M. Edwards, G. Kurras,<br />
Geology 29, 1139 (2001).<br />
26. S. M. White, R. M. Haymon, S. M. Carbotte, Geochem.<br />
Geophys. Geosys., in press.<br />
27. This work was supported <strong>by</strong> NSF under grant<br />
OCE-0327283 (M.T., F.W., D.R.B., R.C.H., and R.T.W.),<br />
grant OCE-0222069 and University of Hawaii–NASA<br />
Astrobiology Institute (J.P.C.), NOAA Vents Program<br />
(E.T.B.), grant OCE-9819261 (D.J.F.), grant OCE-0525863<br />
(D.J.F. and S.A.S.), and grant OCE-0636439 (K.H.R.). We<br />
thankS.C.Solomon,K.C.Macdonald,andW.W.Chadwick<br />
for constructive reviews and the captain, crew, and<br />
science parties of the R/V New Horizon and R/V Knorr.<br />
M.T. thanks J. Cameron; Disney; Walden Media; and the<br />
captain, crew, and science party led <strong>by</strong> A. M. Sagalevitch of<br />
the R/V Keldysh for enabling early OBS deployment. This is<br />
LDEO contribution number 6983, SOEST contribution<br />
number 6996, and PMEL contribution number 2951.<br />
Supporting Online Material<br />
www.sciencemag.org/cgi/content/full/1133950/DC1<br />
Materials and Methods<br />
Fig. S1<br />
References and Notes<br />
16 August 2006; accepted 7 November 2006<br />
Published online 23 November 2006;<br />
10.1126/science.1133950<br />
Include this information when citing this paper.<br />
on January 3, 2007<br />
www.sciencemag.org<br />
Downloaded from