A single-tier pension: what does it really mean? - The Institute For ...
A single-tier pension: what does it really mean? - The Institute For ...
A single-tier pension: what does it really mean? - The Institute For ...

You also want an ePaper? Increase the reach of your titles
YUMPU automatically turns print PDFs into web optimized ePapers that Google loves.
A <strong>single</strong>-<strong>tier</strong> <strong>pension</strong>: <strong>what</strong> <strong>does</strong> <strong>it</strong> <strong>really</strong> <strong>mean</strong>?<br />
fewer than 10 years of ent<strong>it</strong>lement to the <strong>single</strong>-<strong>tier</strong> <strong>pension</strong> and therefore would<br />
receive nothing (unless they make add<strong>it</strong>ional voluntary class 3 NI contributions).<br />
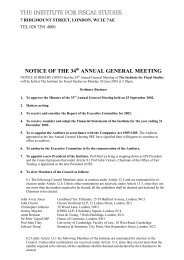
<strong>The</strong> patterns of gains across different groups are – unsurprisingly – similar to<br />
those for gains in state <strong>pension</strong> income shown in Table 4.6 (reproduced from<br />
Table 4.6. Change in present discounted value of <strong>pension</strong> income from<br />
proposed system and change in <strong>pension</strong> income at SPA – assuming cease<br />
remaining contributory activ<strong>it</strong>y at SPA<br />
Pension income at SPA PDV of <strong>pension</strong> income<br />
over years post-SPA<br />
% gain % lose Mean<br />
change<br />
% gain % lose Mean<br />
change<br />
All 43% 19% 2.74 98% 2% 4,013<br />
Male 35% 21% 1.62 100% 0% 3,396<br />
Female 61% 14% 5.23 94% 6% 5,381<br />
SPA = 2016 18% 1% 2.21 99% 1% 4,135<br />
SPA = 2017 52% 26% 2.07 99% 1% 3,670<br />
SPA = 2018 51% 28% 2.62 99% 1% 3,864<br />
SPA = 2019 59% 27% 4.93 96% 4% 4,561<br />
Single 50% 16% 3.79 100% 0% 5,268<br />
Couple 40% 20% 2.42 98% 2% 3,632<br />
Any children 44% 20% 2.80 99% 1% 3,967<br />
No children 37% 15% 2.41 98% 2% 4,021<br />
Low education 42% 23% 2.81 98% 2% 4,662<br />
Mid education 44% 18% 2.94 99% 1% 4,128<br />
High education 41% 15% 2.35 98% 2% 2,809<br />
Quintiles of total<br />
household net wealth<br />
Lowest quintile 51% 22% 3.97 97% 3% 5,607<br />
2 34% 34% 1.82 99% 1% 4,968<br />
3 50% 19% 3.55 99% 1% 4,556<br />
4 39% 11% 2.19 99% 1% 2,621<br />
Highest quintile 39% 10% 2.18 97% 3% 2,368<br />
Ever paid reduced-rate NI 51% 17% 5.51 90% 10% 4,934<br />
Self-employment years<br />
None 41% 20% 2.19 98% 2% 3,708<br />
1 to 5 39% 20% 1.79 98% 2% 3,058<br />
6 to 10 48% 21% 3.41 95% 5% 4,086<br />
More than 10 55% 10% 7.51 100% 0% 7,279<br />
Contracted-out years<br />
None 54% 30% 4.63 92% 8% 6,310<br />
1 to 5 52% 27% 4.72 97% 3% 7,017<br />
6 to 10 35% 31% 1.89 100% 0% 4,655<br />
More than 10 39% 14% 2.07 100% 0% 2,940<br />
Note: This table assumes a 3% discount rate. Also see note to Table 4.4.<br />
42