A single-tier pension: what does it really mean? - The Institute For ...
A single-tier pension: what does it really mean? - The Institute For ...
A single-tier pension: what does it really mean? - The Institute For ...

Create successful ePaper yourself
Turn your PDF publications into a flip-book with our unique Google optimized e-Paper software.
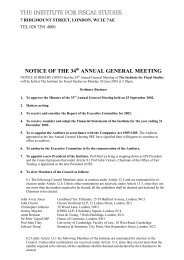
Figure 4.5 continued<br />
C. Single-<strong>tier</strong> system<br />
Cumulative percentage of individuals<br />
100%<br />
90%<br />
80%<br />
70%<br />
60%<br />
50%<br />
40%<br />
30%<br />
20%<br />
10%<br />
All<br />
Men<br />
Women<br />
Short-run effect on <strong>pension</strong>er incomes<br />
Single-<strong>tier</strong><br />
amount<br />
0%<br />
50 60 70 80 90 100 110 120 130 140 150 160 170 180 190 200<br />
State <strong>pension</strong> income at SPA (£ per week; 2013–14 earnings terms)<br />
Note: Assumes individuals continue contributing until SPA under both systems.<br />
Source: Authors’ calculations using English Long<strong>it</strong>udinal Study of Ageing and National Insurance<br />
administrative data.<br />
Panel C shows the income these same people would have under the <strong>single</strong>-<strong>tier</strong><br />
<strong>pension</strong>. This shows that 39% of individuals (42% of men and 35% of women)<br />
would accrue a state <strong>pension</strong> under the proposed system worth at least the full<br />
<strong>single</strong>-<strong>tier</strong> amount. This is higher than the 31% of individuals (34% of men and<br />
23% of women) shown in Figure 4.3 for the case when we assume all remaining<br />
contributory activ<strong>it</strong>y stops in 2016. Table A.3 in Appendix A summarises these<br />
figures in a similar way to Table 4.2. 45<br />
Panel B of Figure 4.5 shows the change between the two systems. When<br />
compared w<strong>it</strong>h Figure 4.2, <strong>it</strong> illustrates that more people stand to lose from the<br />
proposed reforms once we take into account the possibil<strong>it</strong>y of add<strong>it</strong>ional<br />
contributions after 2016, although the proportion of people gaining also<br />
increases. Across the sample as a whole, 19% (21% of men and 14% of women)<br />
stand to receive a lower state <strong>pension</strong> income at SPA under the proposed system<br />
than under the current system, allowing for continued contributions up to SPA.<br />
This compares w<strong>it</strong>h our estimate that just 4% would lose if individuals expect to<br />
cease contributions in 2016 (see Table 4.4). <strong>The</strong>re are two important factors<br />
underlying this pattern.<br />
First, those who will already have accrued £146.30 under the current system by<br />
2016 will find that – unlike under the current system – under the <strong>single</strong>-<strong>tier</strong><br />
system they will be unable to accrue any further <strong>pension</strong> rights after April 2016.<br />
<strong>For</strong> example, for a high earner, this could <strong>mean</strong> forgoing S2P income worth up to<br />
45 http://www.ifs.org.uk/docs/report_<strong>single</strong>-<strong>tier</strong>_<strong>pension</strong>_appendices.pdf.<br />
37