

Full Report - Center for Collaborative Education
Full Report - Center for Collaborative Education
Full Report - Center for Collaborative Education

You also want an ePaper? Increase the reach of your titles
YUMPU automatically turns print PDFs into web optimized ePapers that Google loves.
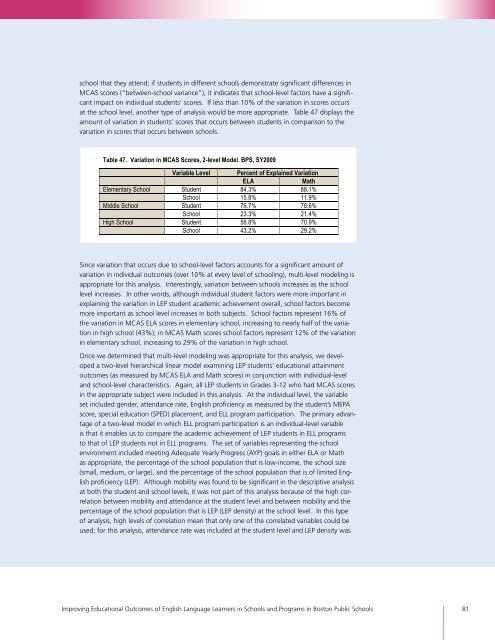
school that they attend; if students in different schools demonstrate significant differences in<br />
MCAS scores (“between-school variance”), it indicates that school-level factors have a significant<br />
impact on individual students’ scores. If less than 10% of the variation in scores occurs<br />
at the school level, another type of analysis would be more appropriate. Table 47 displays the<br />
amount of variation in students’ scores that occurs between students in comparison to the<br />
variation in scores that occurs between schools.<br />
Table 47. Variation in MCAS Scores, 2-level Model. BPS, SY2009<br />
Variable Level Percent of Explained Variation<br />
ELA Math<br />
Elementary School Student 84.3% 88.1%<br />
School 15.8% 11.9%<br />
Middle School Student 76.7% 78.6%<br />
School 23.3% 21.4%<br />
High School Student 56.8% 70.9%<br />
School 43.2% 29.2%<br />
!<br />
Since variation that occurs due to school-level factors accounts <strong>for</strong> a significant amount of<br />
variation in individual outcomes (over 10% at every level of schooling), multi-level modeling is<br />
appropriate <strong>for</strong> this analysis. Interestingly, variation between schools increases as the school<br />
level increases. In other words, although individual student factors were more important in<br />
explaining the variation in LEP student academic achievement overall, school factors become<br />
more important as school level increases in both subjects. School factors represent 16% of<br />
the variation in MCAS ELA scores in elementary school, increasing to nearly half of the variation<br />
in high school (43%); in MCAS Math scores school factors represent 12% of the variation<br />
in elementary school, increasing to 29% of the variation in high school.<br />
Once we determined that multi-level modeling was appropriate <strong>for</strong> this analysis, we developed<br />
a two-level hierarchical linear model examining LEP students’ educational attainment<br />
outcomes (as measured by MCAS ELA and Math scores) in conjunction with individual-level<br />
and school-level characteristics. Again, all LEP students in Grades 3-12 who had MCAS scores<br />
in the appropriate subject were included in this analysis. At the individual level, the variable<br />
set included gender, attendance rate, English proficiency as measured by the student’s MEPA<br />
score, special education (SPED) placement, and ELL program participation. The primary advantage<br />
of a two-level model in which ELL program participation is an individual-level variable<br />
is that it enables us to compare the academic achievement of LEP students in ELL programs<br />
to that of LEP students not in ELL programs. The set of variables representing the school<br />
environment included meeting Adequate Yearly Progress (AYP) goals in either ELA or Math<br />
as appropriate, the percentage of the school population that is low-income, the school size<br />
(small, medium, or large), and the percentage of the school population that is of limited English<br />
proficiency (LEP). Although mobility was found to be significant in the descriptive analysis<br />
at both the student and school levels, it was not part of this analysis because of the high correlation<br />
between mobility and attendance at the student level and between mobility and the<br />
percentage of the school population that is LEP (LEP density) at the school level. In this type<br />
of analysis, high levels of correlation mean that only one of the correlated variables could be<br />
used; <strong>for</strong> this analysis, attendance rate was included at the student level and LEP density was<br />
Improving <strong>Education</strong>al Outcomes of English Language Learners in Schools and Programs in Boston Public Schools 81