Full Report - Center for Collaborative Education
Full Report - Center for Collaborative Education Full Report - Center for Collaborative Education
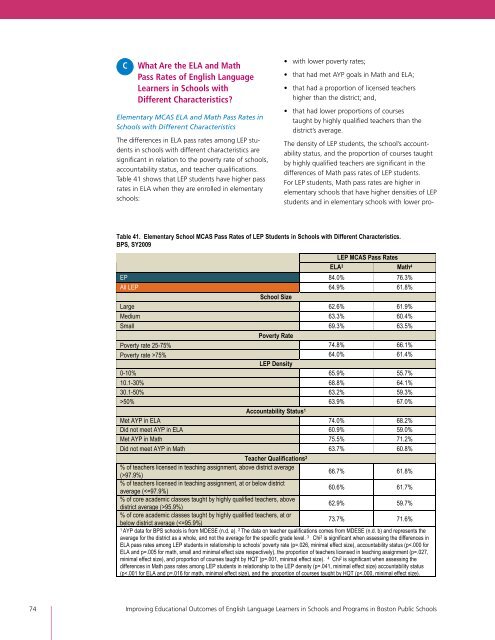
C What Are the ELA and Math Pass Rates of English Language Learners in Schools with Different Characteristics? Elementary MCAS ELA and Math Pass Rates in Schools with Different Characteristics The differences in ELA pass rates among LEP students in schools with different characteristics are significant in relation to the poverty rate of schools, accountability status, and teacher qualifications. Table 41 shows that LEP students have higher pass rates in ELA when they are enrolled in elementary schools: • with lower poverty rates; • that had met AYP goals in Math and ELA; • that had a proportion of licensed teachers higher than the district; and, • that had lower proportions of courses taught by highly qualified teachers than the district’s average. The density of LEP students, the school’s accountability status, and the proportion of courses taught by highly qualified teachers are significant in the differences of Math pass rates of LEP students. For LEP students, Math pass rates are higher in elementary schools that have higher densities of LEP students and in elementary schools with lower pro- Table 41. Elementary School MCAS Pass Rates of LEP Students in Schools with Different Characteristics. BPS, SY2009 LEP MCAS Pass Rates ELA3 Math4 EP 84.0% 76.3% All LEP 64.9% 61.8% School Size Large 62.6% 61.9% Medium 63.3% 60.4% Small 69.3% 63.5% Poverty Rate Poverty rate 25-75% 74.8% 66.1% Poverty rate >75% 64.0% 61.4% LEP Density 0-10% 65.9% 55.7% 10.1-30% 68.8% 64.1% 30.1-50% 63.2% 59.3% >50% 63.9% 67.0% Accountability Status1 Met AYP in ELA 74.0% 68.2% Did not meet AYP in ELA 60.9% 59.0% Met AYP in Math 75.5% 71.2% Did not meet AYP in Math 63.7% 60.8% Teacher Qualifications2 % of teachers licensed in teaching assignment, above district average (>97.9%) 66.7% 61.8% % of teachers licensed in teaching assignment, at or below district average (95.9%) 62.9% 59.7% % of core academic classes taught by highly qualified teachers, at or below district average (
portions of core academic courses taught by highly qualified teachers than is prevalent in the district. Middle School ELA and Math Pass Rates in Schools of Different Characteristics The differences in ELA pass rates among LEP students in different types of schools are statistically significant in relation to the size, poverty rate, and LEP density of the schools, and to their accountability status. LEP students’ middle school ELA pass rates are higher when they are enrolled: • in large middle schools; • in schools with lower poverty rates; • in schools with a high LEP density; and, ! • in schools that met AYP goals in ELA. Differences in Math pass rates among LEP students are significant in regard to school size, school poverty rate, the density of LEP students, the school’s accountability status, the proportion of teachers licensed in teaching assignment, and the proportion of courses taught by highly qualified teachers. LEP students showed higher MCAS Math pass rates when they were enrolled in large middle schools, in schools with lower poverty rates, in schools that met AYP goals in ELA and Math, and in schools with teacher qualifications at or below the district average. Table 42. Middle School MCAS Pass Rates of LEP Students in Schools with Different Characteristics. BPS, SY2009 LEP MCAS Pass Rates ELA3 Math4 EP 90.3% 65.6% All LEP 59.0% 37.3% School Size Large 100% 100% Medium 56.9% 32.7% Small 61.7% 45.4% Poverty Rate Poverty rate 25-75% 86.4% 67.6% Poverty rate >75% 57.7% 36.4% LEP Density 0-10% 67.0% 48.9% 10.1-30% 59.3% 41.0% 30.1-50% 54.6% 25.7% >50% 78.3% 43.5% Accountability Status1 Met AYP in ELA 68.0% 49.3% Did not meet AYP in ELA 56.2% 34.2% Met AYP in Math 62.6% 55.6% Did not meet AYP in Math 58.3% 34.5% Teacher Qualifications2 % of teachers licensed in teaching assignment, above district average (>97.9%) 61.4% 34.9% % of teachers licensed in teaching assignment, at or below district average (95.9%) 58.1% 35.1% % of core academic classes taught by highly qualified teachers, at or below district average (
- Page 29 and 30: ed a significantly smaller proporti
- Page 31 and 32: In Sum In this chapter we focused o
- Page 33 and 34: One of the deepest and most far-rea
- Page 35 and 36: the transfer of large numbers of LE
- Page 37 and 38: education. There are no studies of
- Page 39 and 40: IN DEPTH: Enrollment of English Lan
- Page 41 and 42: Table 14. Nature of Primary Disabil
- Page 43 and 44: choices. From the data gathered, it
- Page 45 and 46: Becoming fully literate in English,
- Page 47 and 48: Populations focused upon in this an
- Page 49 and 50: Table 19. English Proficiency Level
- Page 51 and 52: who attained the level of English p
- Page 53 and 54: ed among those LEP students scoring
- Page 55 and 56: High dropout rates among Boston Pub
- Page 57 and 58: B What Is the Annual High School Dr
- Page 59 and 60: C What Are the Rates of Attendance,
- Page 61 and 62: Table 26. Median Attendance Rates o
- Page 63 and 64: Table 29. Attendance, Out-of-School
- Page 65 and 66: Table 31. Annual High School Dropou
- Page 67 and 68: In Sum This chapter has focused on
- Page 69 and 70: The tests of the Massachusetts Comp
- Page 71 and 72: student achievement (Rumberger, 199
- Page 73 and 74: Table 34. MCAS Math Pass Rates of S
- Page 75 and 76: Table 36. MCAS ELA, Math, and Scien
- Page 77 and 78: Pass Rates in MCAS ELA, Math, and S
- Page 79: IN DEPTH: Attendance Rates of MCAS
- Page 83 and 84: D What are the MCAS ELA and Math Pa
- Page 85 and 86: LEP Students at MEPA Performance Le
- Page 87 and 88: school that they attend; if student
- Page 89 and 90: Results: English Language Arts In a
- Page 91 and 92: 1 Massachusetts meets the requireme
- Page 93 and 94: A Overall Findings and General Reco
- Page 95 and 96: Designation as student with a disab
- Page 97 and 98: B Specific Findings and Recommendat
- Page 99 and 100: Recommendation 7: Parents of LEP st
- Page 101 and 102: Recommendation 14: Monitor indicato
- Page 103 and 104: (2) We found instances in which stu
- Page 105 and 106: Recommendation 30: The quality of i
- Page 107 and 108: Commonwealth of Massachusetts. (201
- Page 109 and 110: Nathan, J., & Thao, S. (2007). Smal
- Page 111 and 112: Vaznis, J. (2011, Sept. 18). US fin
- Page 113 and 114: Overview The report sought to answe
- Page 115 and 116: Table 1. Variables, Definitions and
- Page 117 and 118: In TBE learn solely in English. In
- Page 119 and 120: Table 2: Variables, Definitions and
- Page 121 and 122: ! ! ! 5. Limitations of the Data Wh
- Page 123 and 124: Table 8: MCAS ELA Pass Rates of LEP
- Page 125 and 126: Table 10. Variables Considered in H
- Page 127 and 128: APPENDIX 2: Additional Tables and F
- Page 129 and 130: ! Table 3.2. Characteristics of Eng
C What Are the ELA and Math<br />
Pass Rates of English Language<br />
Learners in Schools with<br />
Different Characteristics?<br />
Elementary MCAS ELA and Math Pass Rates in<br />
Schools with Different Characteristics<br />
The differences in ELA pass rates among LEP students<br />
in schools with different characteristics are<br />
significant in relation to the poverty rate of schools,<br />
accountability status, and teacher qualifications.<br />
Table 41 shows that LEP students have higher pass<br />
rates in ELA when they are enrolled in elementary<br />
schools:<br />
• with lower poverty rates;<br />
• that had met AYP goals in Math and ELA;<br />
• that had a proportion of licensed teachers<br />
higher than the district; and,<br />
• that had lower proportions of courses<br />
taught by highly qualified teachers than the<br />
district’s average.<br />
The density of LEP students, the school’s accountability<br />
status, and the proportion of courses taught<br />
by highly qualified teachers are significant in the<br />
differences of Math pass rates of LEP students.<br />
For LEP students, Math pass rates are higher in<br />
elementary schools that have higher densities of LEP<br />
students and in elementary schools with lower pro-<br />
Table 41. Elementary School MCAS Pass Rates of LEP Students in Schools with Different Characteristics.<br />
BPS, SY2009<br />
LEP MCAS Pass Rates<br />
ELA3 Math4 EP 84.0% 76.3%<br />
All LEP 64.9% 61.8%<br />
School Size<br />
Large 62.6% 61.9%<br />
Medium 63.3% 60.4%<br />
Small 69.3% 63.5%<br />
Poverty Rate<br />
Poverty rate 25-75% 74.8% 66.1%<br />
Poverty rate >75% 64.0% 61.4%<br />
LEP Density<br />
0-10% 65.9% 55.7%<br />
10.1-30% 68.8% 64.1%<br />
30.1-50% 63.2% 59.3%<br />
>50% 63.9% 67.0%<br />
Accountability Status1 Met AYP in ELA 74.0% 68.2%<br />
Did not meet AYP in ELA 60.9% 59.0%<br />
Met AYP in Math 75.5% 71.2%<br />
Did not meet AYP in Math 63.7% 60.8%<br />
Teacher Qualifications2 % of teachers licensed in teaching assignment, above district average<br />
(>97.9%)<br />
66.7% 61.8%<br />
% of teachers licensed in teaching assignment, at or below district<br />
average (95.9%)<br />
62.9% 59.7%<br />
% of core academic classes taught by highly qualified teachers, at or<br />
below district average (


