

Full Report - Center for Collaborative Education
Full Report - Center for Collaborative Education
Full Report - Center for Collaborative Education

You also want an ePaper? Increase the reach of your titles
YUMPU automatically turns print PDFs into web optimized ePapers that Google loves.
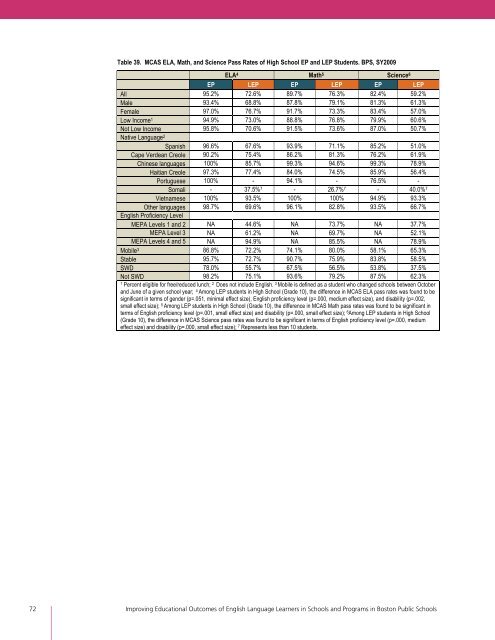
Table 39. MCAS ELA, Math, and Science Pass Rates of High School EP and LEP Students. BPS, SY2009<br />
ELA 4 Math 5 Science 6<br />
EP LEP EP LEP EP LEP<br />
All 95.2% 72.6% 89.7% 76.3% 82.4% 59.2%<br />
Male 93.4% 68.8% 87.8% 79.1% 81.3% 61.3%<br />
Female 97.0% 76.7% 91.7% 73.3% 83.4% 57.0%<br />
Low Income 1 94.9% 73.0% 88.8% 76.8% 79.9% 60.6%<br />
Not Low Income 95.8% 70.6% 91.5% 73.6% 87.0% 50.7%<br />
Native Language 2<br />
Spanish 96.6% 67.6% 93.9% 71.1% 85.2% 51.0%<br />
Cape Verdean Creole 90.2% 75.4% 86.2% 81.3% 76.2% 61.9%<br />
Chinese languages 100% 85.7% 99.3% 94.6% 99.3% 78.9%<br />
Haitian Creole 97.3% 77.4% 84.0% 74.5% 85.9% 56.4%<br />
Portuguese 100% - 94.1% - 76.5% -<br />
Somali - 37.5% 7 - 26.7% 7 - 40.0% 7<br />
Vietnamese 100% 93.5% 100% 100% 94.9% 93.3%<br />
Other languages 98.7% 69.6% 96.1% 82.8% 93.5% 66.7%<br />
English Proficiency Level<br />
MEPA Levels 1 and 2 NA 44.6% NA 73.7% NA 37.7%<br />
MEPA Level 3 NA 61.2% NA 69.7% NA 52.1%<br />
MEPA Levels 4 and 5 NA 94.9% NA 85.5% NA 78.9%<br />
Mobile 3 86.8% 72.2% 74.1% 80.0% 58.1% 65.3%<br />
Stable 95.7% 72.7% 90.7% 75.9% 83.8% 58.5%<br />
SWD 78.0% 55.7% 67.5% 56.5% 53.8% 37.5%<br />
Not SWD 98.2% 75.1% 93.6% 79.2% 87.5% 62.3%<br />
1 Percent eligible <strong>for</strong> free/reduced lunch; 2 Does not include English. 3 Mobile is defined as a student who changed schools between October<br />
and June of a given school year; 4 Among LEP students in High School (Grade 10), the difference in MCAS ELA pass rates was found to be<br />
significant in terms of gender (p=.051, minimal effect size), English proficiency level (p=.000, medium effect size), and disability (p=.002,<br />
small effect size); 5 Among LEP students in High School (Grade 10), the difference in MCAS Math pass rates was found to be significant in<br />
terms of English proficiency level (p=.001, small effect size) and disability (p=.000, small effect size); 6 Among LEP students in High School<br />
(Grade 10), the difference in MCAS Science pass rates was found to be significant in terms of English proficiency level (p=.000, medium<br />
effect size) and disability (p=.000, small effect size); 7 Represents less than 10 students.<br />
72 Improving <strong>Education</strong>al Outcomes of English Language Learners in Schools and Programs in Boston Public Schools