

Full Report - Center for Collaborative Education
Full Report - Center for Collaborative Education
Full Report - Center for Collaborative Education

You also want an ePaper? Increase the reach of your titles
YUMPU automatically turns print PDFs into web optimized ePapers that Google loves.
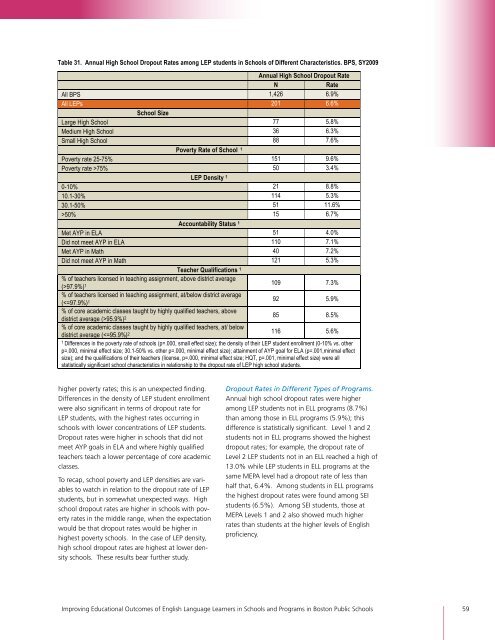
Table 31. Annual High School Dropout Rates among LEP students in Schools of Different Characteristics. BPS, SY2009<br />
Annual High School Dropout Rate<br />
N Rate<br />
All BPS 1,426 6.9%<br />
All LEPs 201 6.6%<br />
School Size<br />
Large High School 77 5.8%<br />
Medium High School 36 6.3%<br />
Small High School 88 7.6%<br />
Poverty Rate of School 1<br />
Poverty rate 25-75% 151 9.6%<br />
Poverty rate >75% 50 3.4%<br />
LEP Density 1<br />
0-10% 21 8.8%<br />
10.1-30% 114 5.3%<br />
30.1-50% 51 11.6%<br />
>50% 15 6.7%<br />
Accountability Status 1<br />
Met AYP in ELA 51 4.0%<br />
Did not meet AYP in ELA 110 7.1%<br />
Met AYP in Math 40 7.2%<br />
Did not meet AYP in Math 121 5.3%<br />
Teacher Qualifications 1<br />
% of teachers licensed in teaching assignment, above district average<br />
109 7.3%<br />
(>97.9%) 1<br />
% of teachers licensed in teaching assignment, at/below district average<br />
(95.9%) 2<br />
85 8.5%<br />
% of core academic classes taught by highly qualified teachers, at/ below<br />
district average (