Full Report - Center for Collaborative Education
Full Report - Center for Collaborative Education Full Report - Center for Collaborative Education
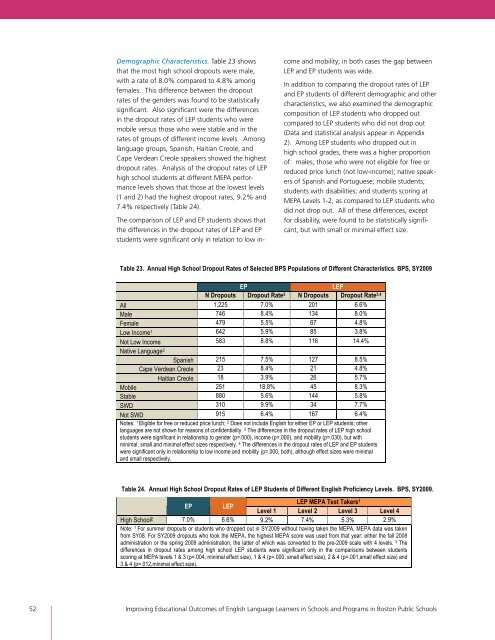
Demographic Characteristics. Table 23 shows that the most high school dropouts were male, with a rate of 8.0% compared to 4.8% among females. This difference between the dropout rates of the genders was found to be statistically significant. Also significant were the differences in the dropout rates of LEP students who were mobile versus those who were stable and in the rates of groups of different income levels. Among language groups, Spanish, Haitian Creole, and Cape Verdean Creole speakers showed the highest dropout rates. Analysis of the dropout rates of LEP high school students at different MEPA performance levels shows that those at the lowest levels (1 and 2) had the highest dropout rates, 9.2% and 7.4% respectively (Table 24). The comparison of LEP and EP students shows that the differences in the dropout rates of LEP and EP students were significant only in relation to low in- come and mobility; in both cases the gap between LEP and EP students was wide. In addition to comparing the dropout rates of LEP and EP students of different demographic and other characteristics, we also examined the demographic composition of LEP students who dropped out compared to LEP students who did not drop out (Data and statistical analysis appear in Appendix 2). Among LEP students who dropped out in high school grades, there was a higher proportion of: males; those who were not eligible for free or reduced price lunch (not low-income); native speakers of Spanish and Portuguese; mobile students; students with disabilities; and students scoring at MEPA Levels 1-2, as compared to LEP students who did not drop out. All of these differences, except for disability, were found to be statistically significant, but with small or minimal effect size. Table 23. Annual High School Dropout Rates of Selected BPS Populations of Different Characteristics. BPS, SY2009 EP LEP N Dropouts Dropout Rate3 N Dropouts Dropout Rate3,4 All 1,225 7.0% 201 6.6% Male 746 8.4% 134 8.0% Female 479 5.5% 67 4.8% Low Income1 642 5.9% 85 3.8% Not Low Income Native Language 583 8.8% 116 14.4% 2 Spanish 215 7.5% 127 8.5% Cape Verdean Creole 23 8.4% 21 4.8% Haitian Creole 18 3.9% 26 5.7% Mobile 251 18.8% 45 8.3% Stable 880 5.6% 144 5.8% SWD 310 9.9% 34 7.7% Not SWD 915 6.4% 167 6.4% Notes: 1 Eligible for free or reduced price lunch; 2 Does not include English for either EP or LEP students; other languages are not shown for reasons of confidentiality. 3 The differences in the dropout rates of LEP high school students were significant in relationship to gender (p=.000), income (p=.000), and mobility (p=.030), but with minimal, small and minimal effect sizes respectively. 4 The differences in the dropout rates of LEP and EP students were significant only in relationship to low income and mobility (p=.000, both), although effect sizes were minimal and small respectively. Table 24. Annual High School Dropout Rates of LEP Students of Different English Proficiency Levels. BPS, SY2009. LEP MEPA Test Takers1 EP LEP Level 1 Level 2 Level 3 Level 4 High School2 7.0% 6.6% 9.2% 7.4% 5.3% 2.9% Note: 1 For summer dropouts or students who dropped out in SY2009 without having taken the MEPA, MEPA data was taken from SY08. For SY2009 dropouts who took the MEPA, the highest MEPA score was used from that year: either the fall 2008 administration or the spring 2009 administration, the latter of which was converted to the pre-2009 scale with 4 levels. 2 The differences in dropout rates among high school LEP students were significant only in the comparisons between students scoring at MEPA levels 1 & 3 (p=.004, minimal effect size), 1 & 4 (p=.000, small effect size), 2 & 4 (p=.001,small effect size) and 3 & 4 (p=.012,minimal effect size). 52 Improving Educational Outcomes of English Language Learners in Schools and Programs in Boston Public Schools
C What Are the Rates of Attendance, Suspension, and Retention of English Language Learners? How Do They Compare to Those of English Proficient Students? In this section we analyze the behavior of three indicators –attendance, out-of-school suspensions and retention – that have been shown in the educational research literature to be related to the dropout rates of students (Rumberger, 2006). Median Attendance. The median attendance rate is an indicator of student engagement. In SY2009, the median attendance rate among LEP students was higher than among English proficient students. This is the case district-wide and in elementary and high schools; the differences in median attendance between LEP students and English proficient students both district-wide and in elementary school were statistically significant. Within the LEP student group, median attendance rate was highest among elementary school students, decreasing substantially as grade level increases, which was a pattern that repeated across all groups. Out-of-School Suspension Rate. Out-of-school suspension is an indicator of discipline problems experienced by students. Taken as a group, LEP students had lower suspension rates (3.8%) than English proficient students. Among elementary and high school students, LEP students had among the lowest rates (2.0% and 2.9% respectively). Differences in rates between LEP and EP students were statistically significant in the aggregate and among middle and high school groups. Out-of-school suspension rates varied by grade level among LEP students, reaching a high of 10.6% among middle school students. Retention Rate. Retention in grade is usually related to a student’s low academic achievement. The retention rate for LEP students was higher than that for any other group overall and in elementary and high school levels. Among LEP students, retention rates were highest among high school students; at 20.9%; the high school retention rate was more than triple that of elementary school students and four times that of middle schoolers. Table 25. Median Attendance, Out-of-School Suspensions and Retention Rates of Students of Different Language Proficiencies, K-12. BPS, SY2009 All BPS EP LEP Median Attendance Rates 1 All 94.4% 94.4% 95.5% Elementary School 95.5% 95.0% 96.1% Middle School 95.0% 95.4% 95.0% High School 92.7% 92.5% 92.8% Out-of-School Suspension Rates 2 All 5.8% 6.3% 3.8% Elementary School 3.0% 3.3% 2.0% Middle School 11.7% 12.0% 10.6% High School 5.8% 6.4% 2.9% Retention Rates (SY2008-SY2009) 3 All 7.0% 6.5% 9.5% Elementary School 4.6% 4.1% 6.0% Middle School 4.6% 4.5% 5.0% High School 11.6% 10.3% 20.9% Notes: 1 Significance of the differences in attendance rates between LEP and EP students was tested using a T-test. The differences were significant among students in all grade levels and among students in elementary grades (p=.000). 2 Differences between LEP and EP students in regard to out-of-school suspensions was tested using Chi 2 . Differences were found to be significant among students in all (p=.000, minimal effect size); elementary (p=.000, minimal effect size); and high school (p=.000, minimal effect size) grade levels. 3 Differences between LEP and EP students in regard to retention were also tested using Chi 2 . Differences were found to be significant among students in all (p=.000, minimal effect size); elementary (p=.000, minimal effect size); and high school (p=.000, small effect size) grade levels. Improving Educational Outcomes of English Language Learners in Schools and Programs in Boston Public Schools 53
- Page 7 and 8: CHAPTER I. INTRODUCTION
- Page 9 and 10: Language Learners (OELL) has attemp
- Page 11 and 12: CHAPTER II. THE STUDY
- Page 13 and 14: epresented by the blocks in differe
- Page 15 and 16: Table 2. Variables, Definitions, an
- Page 17 and 18: CHAPTER III. ENROLLMENT AND CHARACT
- Page 19 and 20: Figure 1. Change in Enrollment of S
- Page 21 and 22: Native speakers of Haitian Creole a
- Page 23 and 24: In Sum Following a swift decline in
- Page 25 and 26: One of the foci of this study is th
- Page 27 and 28: School Poverty Rate. Income status
- Page 29 and 30: ed a significantly smaller proporti
- Page 31 and 32: In Sum In this chapter we focused o
- Page 33 and 34: One of the deepest and most far-rea
- Page 35 and 36: the transfer of large numbers of LE
- Page 37 and 38: education. There are no studies of
- Page 39 and 40: IN DEPTH: Enrollment of English Lan
- Page 41 and 42: Table 14. Nature of Primary Disabil
- Page 43 and 44: choices. From the data gathered, it
- Page 45 and 46: Becoming fully literate in English,
- Page 47 and 48: Populations focused upon in this an
- Page 49 and 50: Table 19. English Proficiency Level
- Page 51 and 52: who attained the level of English p
- Page 53 and 54: ed among those LEP students scoring
- Page 55 and 56: High dropout rates among Boston Pub
- Page 57: B What Is the Annual High School Dr
- Page 61 and 62: Table 26. Median Attendance Rates o
- Page 63 and 64: Table 29. Attendance, Out-of-School
- Page 65 and 66: Table 31. Annual High School Dropou
- Page 67 and 68: In Sum This chapter has focused on
- Page 69 and 70: The tests of the Massachusetts Comp
- Page 71 and 72: student achievement (Rumberger, 199
- Page 73 and 74: Table 34. MCAS Math Pass Rates of S
- Page 75 and 76: Table 36. MCAS ELA, Math, and Scien
- Page 77 and 78: Pass Rates in MCAS ELA, Math, and S
- Page 79 and 80: IN DEPTH: Attendance Rates of MCAS
- Page 81 and 82: portions of core academic courses t
- Page 83 and 84: D What are the MCAS ELA and Math Pa
- Page 85 and 86: LEP Students at MEPA Performance Le
- Page 87 and 88: school that they attend; if student
- Page 89 and 90: Results: English Language Arts In a
- Page 91 and 92: 1 Massachusetts meets the requireme
- Page 93 and 94: A Overall Findings and General Reco
- Page 95 and 96: Designation as student with a disab
- Page 97 and 98: B Specific Findings and Recommendat
- Page 99 and 100: Recommendation 7: Parents of LEP st
- Page 101 and 102: Recommendation 14: Monitor indicato
- Page 103 and 104: (2) We found instances in which stu
- Page 105 and 106: Recommendation 30: The quality of i
- Page 107 and 108: Commonwealth of Massachusetts. (201
Demographic Characteristics. Table 23 shows<br />
that the most high school dropouts were male,<br />
with a rate of 8.0% compared to 4.8% among<br />
females. This difference between the dropout<br />
rates of the genders was found to be statistically<br />
significant. Also significant were the differences<br />
in the dropout rates of LEP students who were<br />
mobile versus those who were stable and in the<br />
rates of groups of different income levels. Among<br />
language groups, Spanish, Haitian Creole, and<br />
Cape Verdean Creole speakers showed the highest<br />
dropout rates. Analysis of the dropout rates of LEP<br />
high school students at different MEPA per<strong>for</strong>mance<br />
levels shows that those at the lowest levels<br />
(1 and 2) had the highest dropout rates, 9.2% and<br />
7.4% respectively (Table 24).<br />
The comparison of LEP and EP students shows that<br />
the differences in the dropout rates of LEP and EP<br />
students were significant only in relation to low in-<br />
come and mobility; in both cases the gap between<br />
LEP and EP students was wide.<br />
In addition to comparing the dropout rates of LEP<br />
and EP students of different demographic and other<br />
characteristics, we also examined the demographic<br />
composition of LEP students who dropped out<br />
compared to LEP students who did not drop out<br />
(Data and statistical analysis appear in Appendix<br />
2). Among LEP students who dropped out in<br />
high school grades, there was a higher proportion<br />
of: males; those who were not eligible <strong>for</strong> free or<br />
reduced price lunch (not low-income); native speakers<br />
of Spanish and Portuguese; mobile students;<br />
students with disabilities; and students scoring at<br />
MEPA Levels 1-2, as compared to LEP students who<br />
did not drop out. All of these differences, except<br />
<strong>for</strong> disability, were found to be statistically significant,<br />
but with small or minimal effect size.<br />
Table 23. Annual High School Dropout Rates of Selected BPS Populations of Different Characteristics. BPS, SY2009<br />
EP LEP<br />
N Dropouts Dropout Rate3 N Dropouts Dropout Rate3,4 All 1,225 7.0% 201 6.6%<br />
Male 746 8.4% 134 8.0%<br />
Female 479 5.5% 67 4.8%<br />
Low Income1 642 5.9% 85 3.8%<br />
Not Low Income<br />
Native Language<br />
583 8.8% 116 14.4%<br />
2<br />
Spanish 215 7.5% 127 8.5%<br />
Cape Verdean Creole 23 8.4% 21 4.8%<br />
Haitian Creole 18 3.9% 26 5.7%<br />
Mobile 251 18.8% 45 8.3%<br />
Stable 880 5.6% 144 5.8%<br />
SWD 310 9.9% 34 7.7%<br />
Not SWD 915 6.4% 167 6.4%<br />
Notes: 1 Eligible <strong>for</strong> free or reduced price lunch; 2 Does not include English <strong>for</strong> either EP or LEP students; other<br />
languages are not shown <strong>for</strong> reasons of confidentiality. 3 The differences in the dropout rates of LEP high school<br />
students were significant in relationship to gender (p=.000), income (p=.000), and mobility (p=.030), but with<br />
minimal, small and minimal effect sizes respectively. 4 The differences in the dropout rates of LEP and EP students<br />
were significant only in relationship to low income and mobility (p=.000, both), although effect sizes were minimal<br />
and small respectively.<br />
Table 24. Annual High School Dropout Rates of LEP Students of Different English Proficiency Levels. BPS, SY2009.<br />
LEP MEPA Test Takers1 EP LEP<br />
Level 1 Level 2 Level 3 Level 4<br />
High School2 7.0% 6.6% 9.2% 7.4% 5.3% 2.9%<br />
Note: 1 For summer dropouts or students who dropped out in SY2009 without having taken the MEPA, MEPA data was taken<br />
from SY08. For SY2009 dropouts who took the MEPA, the highest MEPA score was used from that year: either the fall 2008<br />
administration or the spring 2009 administration, the latter of which was converted to the pre-2009 scale with 4 levels. 2 The<br />
differences in dropout rates among high school LEP students were significant only in the comparisons between students<br />
scoring at MEPA levels 1 & 3 (p=.004, minimal effect size), 1 & 4 (p=.000, small effect size), 2 & 4 (p=.001,small effect size) and<br />
3 & 4 (p=.012,minimal effect size).<br />
52 Improving <strong>Education</strong>al Outcomes of English Language Learners in Schools and Programs in Boston Public Schools


