

Full Report - Center for Collaborative Education
Full Report - Center for Collaborative Education
Full Report - Center for Collaborative Education

Create successful ePaper yourself
Turn your PDF publications into a flip-book with our unique Google optimized e-Paper software.
Populations focused upon in this and<br />
subsequent chapters:<br />
Total All BPS<br />
Native<br />
Language<br />
Native English Speaker (NES)<br />
Native Speakers of Other Languages<br />
(NSOL)<br />
Language<br />
Proficiency<br />
English Proficient (EP)<br />
NES<br />
NSOL-<br />
EP<br />
FLEP<br />
Limited<br />
English<br />
Proficiency (LEP)<br />
Program<br />
Participation<br />
Not in ELL Program<br />
Not in<br />
ELL<br />
Prog<br />
In<br />
ELL Prog<br />
A How Are English Proficiency<br />
Levels Distributed Across<br />
English Language Learners?<br />
In SY2009, LEP students in Boston scored in the<br />
middle levels of proficiency, Levels3 and 4 (61.7%).<br />
The highest proportion of LEP students (32.0%)<br />
scored at MEPA per<strong>for</strong>mance Level 3 in SY2009.<br />
Researchers point out that the trajectory through<br />
the low levels of English proficiency is usually quick<br />
and that the movement through the middle levels<br />
tends to be the most time-consuming (Thomas<br />
&Collier, 1997). The trend over the study period<br />
was <strong>for</strong> the proportion of students at the higher<br />
MEPA levels to increase (Appendix 2). Comparing<br />
across grade levels shows that high schools had the<br />
highest proportion of students at MEPA per<strong>for</strong>mance<br />
Level 3.<br />
B What Are the Characteristics of<br />
English Language Learners at Different<br />
English Proficiency Levels? 4<br />
LEP students at MEPA Levels 1 and 2 have a higher<br />
proportion of males and of mobile students than<br />
LEP students per<strong>for</strong>ming at MEPA Levels 3 to 5. In<br />
this group the proportion of mobile students was<br />
more than three times that of students at Level 3<br />
and more than seven times that of those at Levels<br />
4 and 5. Among LEP students scoring at Level 3,<br />
the most salient characteristic is the high proportion<br />
who has been determined to be students with<br />
disabilities (22.4%). Among students at Levels 4<br />
and 5, the most salient characteristics are their low<br />
mobility (3.8% changed schools in SY2009) and the<br />
higher representation of girls in their numbers. In<br />
terms of the English proficiency of students of different<br />
native language groups, the representation<br />
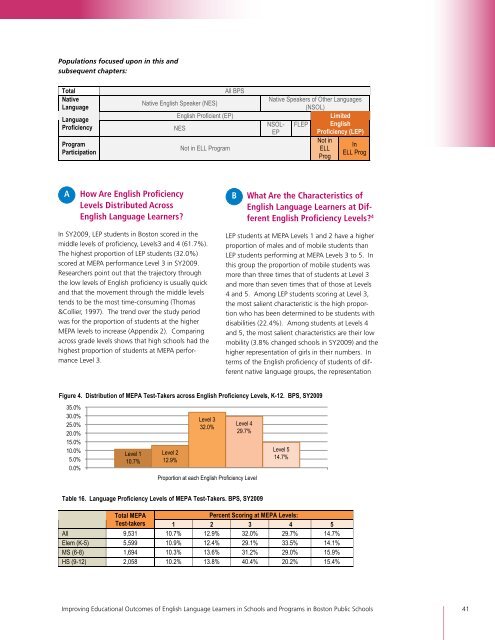
Figure 4. Distribution of MEPA Test-Takers across English Proficiency Levels, K-12. BPS, SY2009<br />
35.0%<br />
30.0%<br />
25.0%<br />
20.0%<br />
15.0%<br />
10.0%<br />
5.0%<br />
0.0%<br />
Level 1<br />
10.7%<br />
Level 2<br />
12.9%<br />
Level 3<br />
32.0%<br />
Level 4<br />
29.7%<br />
Proportion at each English Proficiency Level<br />
Table 16. Language Proficiency Levels of MEPA Test-Takers. BPS, SY2009<br />
Improving <strong>Education</strong>al Outcomes of English Language Learners in Schools and Programs in Boston Public Schools 41<br />
Level 5<br />
14.7%<br />
Total MEPA<br />
Percent Scoring at MEPA Levels:<br />
Test-takers 1 2 3 4 5<br />
All 9,531 10.7% 12.9% 32.0% 29.7% 14.7%<br />
Elem (K-5) 5,599 10.9% 12.4% 29.1% 33.5% 14.1%<br />
MS (6-8) 1,694 10.3% 13.6% 31.2% 29.0% 15.9%<br />
HS (9-12) 2,058 10.2% 13.8% 40.4% 20.2% 15.4%