

Full Report - Center for Collaborative Education
Full Report - Center for Collaborative Education
Full Report - Center for Collaborative Education

Create successful ePaper yourself
Turn your PDF publications into a flip-book with our unique Google optimized e-Paper software.
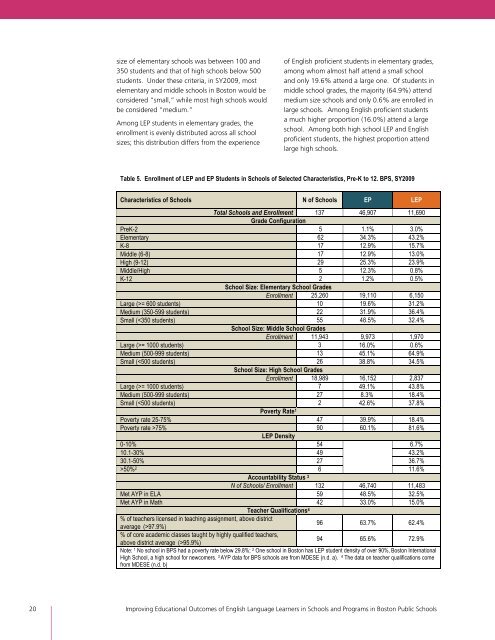
size of elementary schools was between 100 and<br />
350 students and that of high schools below 500<br />
students. Under these criteria, in SY2009, most<br />
elementary and middle schools in Boston would be<br />
considered “small,” while most high schools would<br />
be considered “medium.”<br />
Among LEP students in elementary grades, the<br />
enrollment is evenly distributed across all school<br />
sizes; this distribution differs from the experience<br />
of English proficient students in elementary grades,<br />
among whom almost half attend a small school<br />
and only 19.6% attend a large one. Of students in<br />
middle school grades, the majority (64.9%) attend<br />
medium size schools and only 0.6% are enrolled in<br />
large schools. Among English proficient students<br />
a much higher proportion (16.0%) attend a large<br />
school. Among both high school LEP and English<br />
proficient students, the highest proportion attend<br />
large high schools.<br />
Table 5. Enrollment of LEP and EP Students in Schools of Selected Characteristics, Pre-K to 12. BPS, SY2009<br />
Characteristics of Schools N of Schools EP LEP<br />
Total Schools and Enrollment<br />
Grade Configuration<br />
137 46,907 11,690<br />
PreK-2 5 1.1% 3.0%<br />
Elementary 62 34.3% 43.2%<br />
K-8 17 12.9% 15.7%<br />
Middle (6-8) 17 12.9% 13.0%<br />
High (9-12) 29 25.3% 23.9%<br />
Middle/High 5 12.3% 0.8%<br />
K-12 2<br />
School Size: Elementary School Grades<br />
1.2% 0.5%<br />
Enrollment 25,260 19,110 6,150<br />
Large (>= 600 students) 10 19.6% 31.2%<br />
Medium (350-599 students) 22 31.9% 36.4%<br />
Small (= 1000 students) 3 16.0% 0.6%<br />
Medium (500-999 students) 13 45.1% 64.9%<br />
Small (= 1000 students) 7 49.1% 43.8%<br />
Medium (500-999 students) 27 8.3% 18.4%<br />
Small (75% 90 60.1% 81.6%<br />
LEP Density<br />
0-10% 54 6.7%<br />
10.1-30% 49 43.2%<br />
30.1-50% 27 36.7%<br />
>50% 2 6<br />
Accountability Status 3<br />
N of Schools/ Enrollment 132 46,740 11,483<br />
Met AYP in ELA 59 48.5% 32.5%<br />
Met AYP in Math 42 33.0% 15.0%<br />
Teacher Qualifications 4<br />
% of teachers licensed in teaching assignment, above district<br />
average (>97.9%) 96 63.7% 62.4%<br />
% of core academic classes taught by highly qualified teachers,<br />
above district average (>95.9%) 94 65.6% 72.9%<br />
Note: 1 No school in BPS had a poverty rate below 29.8%; 2 One school in Boston has LEP student density of over 90%, Boston International<br />
High School, a high school <strong>for</strong> newcomers. 3 AYP data <strong>for</strong> BPS schools are from MDESE (n.d. a). 4 The data on teacher qualifications come<br />
from MDESE (n.d. b)<br />
20 Improving <strong>Education</strong>al Outcomes of English Language Learners in Schools and Programs in Boston Public Schools<br />
11.6%