

Full Report - Center for Collaborative Education
Full Report - Center for Collaborative Education
Full Report - Center for Collaborative Education

Create successful ePaper yourself
Turn your PDF publications into a flip-book with our unique Google optimized e-Paper software.
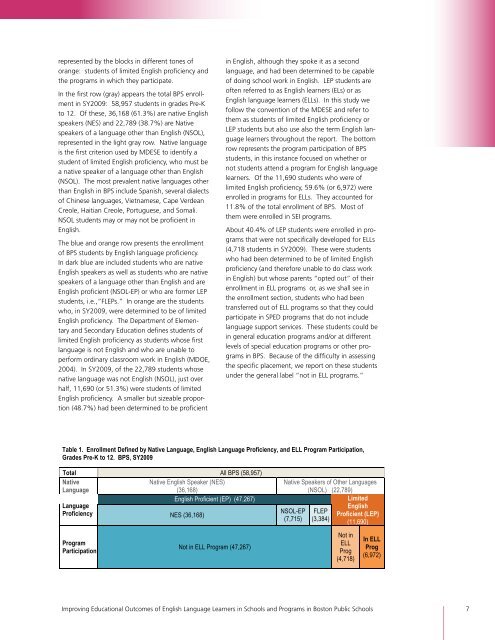
epresented by the blocks in different tones of<br />
orange: students of limited English proficiency and<br />
the programs in which they participate.<br />
In the first row (gray) appears the total BPS enrollment<br />
in SY2009: 58,957 students in grades Pre-K<br />
to 12. Of these, 36,168 (61.3%) are native English<br />
speakers (NES) and 22,789 (38.7%) are Native<br />
speakers of a language other than English (NSOL),<br />
represented in the light gray row. Native language<br />
is the first criterion used by MDESE to identify a<br />
student of limited English proficiency, who must be<br />
a native speaker of a language other than English<br />
(NSOL). The most prevalent native languages other<br />
than English in BPS include Spanish, several dialects<br />
of Chinese languages, Vietnamese, Cape Verdean<br />
Creole, Haitian Creole, Portuguese, and Somali.<br />
NSOL students may or may not be proficient in<br />
English.<br />
The blue and orange row presents the enrollment<br />
of BPS students by English language proficiency.<br />
In dark blue are included students who are native<br />
English speakers as well as students who are native<br />
speakers of a language other than English and are<br />
English proficient (NSOL-EP) or who are <strong>for</strong>mer LEP<br />
students, i.e.,“FLEPs.” In orange are the students<br />
who, in SY2009, were determined to be of limited<br />
English proficiency. The Department of Elementary<br />
and Secondary <strong>Education</strong> defines students of<br />
limited English proficiency as students whose first<br />
language is not English and who are unable to<br />
per<strong>for</strong>m ordinary classroom work in English (MDOE,<br />
2004). In SY2009, of the 22,789 students whose<br />
native language was not English (NSOL), just over<br />
half, 11,690 (or 51.3%) were students of limited<br />
English proficiency. A smaller but sizeable proportion<br />
(48.7%) had been determined to be proficient<br />
in English, although they spoke it as a second<br />
language, and had been determined to be capable<br />
of doing school work in English. LEP students are<br />
often referred to as English learners (ELs) or as<br />
English language learners (ELLs). In this study we<br />
follow the convention of the MDESE and refer to<br />
them as students of limited English proficiency or<br />
LEP students but also use also the term English language<br />
learners throughout the report. The bottom<br />
row represents the program participation of BPS<br />
students, in this instance focused on whether or<br />
not students attend a program <strong>for</strong> English language<br />
learners. Of the 11,690 students who were of<br />
limited English proficiency, 59.6% (or 6,972) were<br />
enrolled in programs <strong>for</strong> ELLs. They accounted <strong>for</strong><br />
11.8% of the total enrollment of BPS. Most of<br />
them were enrolled in SEI programs.<br />
About 40.4% of LEP students were enrolled in programs<br />
that were not specifically developed <strong>for</strong> ELLs<br />
(4,718 students in SY2009). These were students<br />
who had been determined to be of limited English<br />
proficiency (and there<strong>for</strong>e unable to do class work<br />
in English) but whose parents “opted out” of their<br />
enrollment in ELL programs or, as we shall see in<br />
the enrollment section, students who had been<br />
transferred out of ELL programs so that they could<br />
participate in SPED programs that do not include<br />
language support services. These students could be<br />
in general education programs and/or at different<br />
levels of special education programs or other programs<br />
in BPS. Because of the difficulty in assessing<br />
the specific placement, we report on these students<br />
under the general label “not in ELL programs.”<br />
Table 1. Enrollment Defined by Native Language, English Language Proficiency, and ELL Program Participation,<br />
Grades Pre-K to 12. BPS, SY2009<br />
Total All BPS (58,957)<br />
Native<br />
Native English Speaker (NES)<br />
Native Speakers of Other Languages<br />
Language<br />
(36,168)<br />
(NSOL) (22,789)<br />
English Proficient (EP) (47,267)<br />
Limited<br />
Language<br />
Proficiency NES (36,168)<br />
NSOL-EP<br />
(7,715)<br />
FLEP<br />
(3,384)<br />
English<br />
Proficient (LEP)<br />
(11,690)<br />
Program<br />
Participation<br />
Not in ELL Program (47,267)<br />
Not in<br />
ELL<br />
Prog<br />
(4,718)<br />
In ELL<br />
Prog<br />
(6,972)<br />
Improving <strong>Education</strong>al Outcomes of English Language Learners in Schools and Programs in Boston Public Schools 7