

Full Report - Center for Collaborative Education
Full Report - Center for Collaborative Education
Full Report - Center for Collaborative Education

Create successful ePaper yourself
Turn your PDF publications into a flip-book with our unique Google optimized e-Paper software.
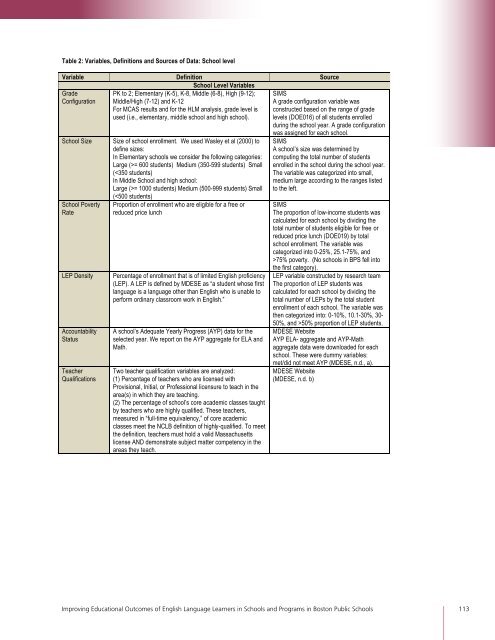
Table 2: Variables, Definitions and Sources of Data: School level<br />
Variable Definition<br />
School Level Variables<br />
Source<br />
Grade<br />
PK to 2; Elementary (K-5), K-8, Middle (6-8), High (9-12); SIMS<br />
Configuration Middle/High (7-12) and K-12<br />
A grade configuration variable was<br />
For MCAS results and <strong>for</strong> the HLM analysis, grade level is constructed based on the range of grade<br />
used (i.e., elementary, middle school and high school). levels (DOE016) of all students enrolled<br />
during the school year. A grade configuration<br />
was assigned <strong>for</strong> each school.<br />
School Size Size of school enrollment. We used Wasley et al (2000) to SIMS<br />
define sizes:<br />
A school’s size was determined by<br />
In Elementary schools we consider the following categories: computing the total number of students<br />
Large (>= 600 students) Medium (350-599 students) Small enrolled in the school during the school year.<br />
(= 1000 students) Medium (500-999 students) Small<br />
(75% poverty. (No schools in BPS fell into<br />
the first category).<br />
LEP Density Percentage of enrollment that is of limited English proficiency LEP variable constructed by research team<br />
(LEP). A LEP is defined by MDESE as “a student whose first The proportion of LEP students was<br />
language is a language other than English who is unable to calculated <strong>for</strong> each school by dividing the<br />
per<strong>for</strong>m ordinary classroom work in English.”<br />
total number of LEPs by the total student<br />
enrollment of each school. The variable was<br />
then categorized into: 0-10%, 10.1-30%, 30-<br />
50%, and >50% proportion of LEP students.<br />
Accountability A school’s Adequate Yearly Progress (AYP) data <strong>for</strong> the MDESE Website<br />
Status<br />
selected year. We report on the AYP aggregate <strong>for</strong> ELA and AYP ELA- aggregate and AYP-Math<br />
Math.<br />
aggregate data were downloaded <strong>for</strong> each<br />
school. These were dummy variables:<br />
met/did not meet AYP (MDESE, n.d., a).<br />
Teacher Two teacher qualification variables are analyzed:<br />
MDESE Website<br />
Qualifications<br />
!<br />
(1) Percentage of teachers who are licensed with<br />
Provisional, Initial, or Professional licensure to teach in the<br />
area(s) in which they are teaching.<br />
(2) The percentage of school’s core academic classes taught<br />
by teachers who are highly qualified. These teachers,<br />
measured in “full-time equivalency,” of core academic<br />
classes meet the NCLB definition of highly-qualified. To meet<br />
the definition, teachers must hold a valid Massachusetts<br />
license AND demonstrate subject matter competency in the<br />
areas they teach.<br />
(MDESE, n.d. b)<br />
Improving <strong>Education</strong>al Outcomes of English Language Learners in Schools and Programs in Boston Public Schools 113