Benthic Communities at Horns Rev Before, During and After Con
Benthic Communities at Horns Rev Before, During and After Con
Benthic Communities at Horns Rev Before, During and After Con

Create successful ePaper yourself
Turn your PDF publications into a flip-book with our unique Google optimized e-Paper software.
Published:<br />
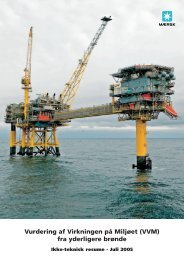
<strong>Benthic</strong> <strong>Communities</strong> <strong>at</strong> <strong>Horns</strong> <strong>Rev</strong><br />
<strong>Before</strong>, <strong>During</strong> <strong>and</strong> <strong>After</strong> <strong>Con</strong>struction<br />
of <strong>Horns</strong> <strong>Rev</strong> Offshore<br />
Wind Farm<br />
31. May 2006<br />
Final Report<br />
Annual Report 2005<br />
Prepared: Simon B. Leonhard<br />
John Pedersen<br />
Editing: Gitte Spanggaard<br />
Checked: Bjarne Moeslund Artwork: Kirsten Nygaard<br />
Approved: Simon B. Leonhard Cover photos: Jens Christensen<br />
Simon B. Leonhard<br />
Photos: Jens Christensen<br />
Maks Klaustrup<br />
Christian B. Hvidt<br />
Simon B. Leonhard<br />
English review: M<strong>at</strong>thew Cochran<br />
© No part of this public<strong>at</strong>ion may be reproduced by any means without clear reference to the<br />
source.
<strong>Horns</strong> <strong>Rev</strong>. <strong>Benthic</strong> communities Page 3<br />
Table of contents Page<br />
1. Introduction.................................................................................................................16<br />
1.1. Background .........................................................................................................16<br />
1.2. <strong>Horns</strong> <strong>Rev</strong> ...........................................................................................................17<br />
1.2.1. Geology <strong>and</strong> geomorphology......................................................................18<br />
1.2.2. Hydrography ...............................................................................................19<br />
1.3. <strong>Horns</strong> <strong>Rev</strong> Offshore Wind Farm.........................................................................20<br />
1.3.1. <strong>Con</strong>struction <strong>and</strong> layout ..............................................................................20<br />
1.3.2. Design<strong>at</strong>ed areas..........................................................................................22<br />
1.4. <strong>Benthic</strong> communities <strong>at</strong> <strong>Horns</strong> <strong>Rev</strong> ....................................................................23<br />
1.4.1. <strong>Benthic</strong> veget<strong>at</strong>ion.......................................................................................23<br />
1.4.2. <strong>Benthic</strong> fauna ..............................................................................................23<br />
1.4.3. Popul<strong>at</strong>ion ecology <strong>and</strong> distribution <strong>at</strong> <strong>Horns</strong> <strong>Rev</strong> .....................................23<br />
1.5. Scope of investig<strong>at</strong>ions .......................................................................................26<br />
1.5.1. Possible <strong>and</strong> expected effects on benthic communities ..............................26<br />
1.5.2. Criterion ......................................................................................................29<br />
1.5.3. Hypotheses regarding effects ......................................................................30<br />
2. Methods.......................................................................................................................31<br />
2.1. Infauna.................................................................................................................31<br />
2.1.1. Field surveys ...............................................................................................32<br />
2.2. Hard bottom substr<strong>at</strong>e .........................................................................................32<br />
2.2.1. Field surveys ...............................................................................................33<br />
2.3. Sample h<strong>and</strong>ling..................................................................................................35<br />
2.3.1. Sediment......................................................................................................35<br />
2.3.2. Benthos........................................................................................................35<br />
2.4. Test fishing..........................................................................................................35<br />
2.4.1. Objective .....................................................................................................36<br />
2.5. D<strong>at</strong>a analyses.......................................................................................................36<br />
2.5.1. Sediment characteristics..............................................................................37<br />
2.5.2. Species composition....................................................................................37<br />
3. Results.........................................................................................................................40<br />
3.1. Sediment..............................................................................................................40<br />
3.2. Infauna.................................................................................................................42<br />
3.2.1. Structure of the community.........................................................................47<br />
3.3. Hard bottom substr<strong>at</strong>e .........................................................................................50<br />
3.3.1. Veget<strong>at</strong>ion ...................................................................................................50<br />
3.3.2. Epifauna ......................................................................................................52<br />
3.3.3. Fish..............................................................................................................69<br />
4. Discussion ...................................................................................................................71<br />
4.1. N<strong>at</strong>ural p<strong>at</strong>terns in distribution <strong>and</strong> abundance...................................................71<br />
4.2. Effects from the wind farm .................................................................................71<br />
4.2.1. <strong>Con</strong>struction ................................................................................................71<br />
4.2.2. Oper<strong>at</strong>ion.....................................................................................................80<br />
4.2.3. Cumul<strong>at</strong>ive effects ......................................................................................80<br />
4.3. Methodological consider<strong>at</strong>ions for future studies (lessons learned)...................80<br />
5. <strong>Con</strong>clusion ..................................................................................................................81<br />
Doc. No. 2572-03-005 rev. 4
<strong>Horns</strong> <strong>Rev</strong>. <strong>Benthic</strong> communities Page 4<br />
6. Acknowledgements.....................................................................................................83<br />
7. References...................................................................................................................84<br />
8. Appendixes..................................................................................................................90<br />
8.1. Appendix 1. Coordin<strong>at</strong>es of the wind farm <strong>and</strong> list of Positions ........................90<br />
8.2. Appendix 2. Species Lists...................................................................................92<br />
8.2.1. Appendix 2.1. Infauna 1999-2005 ..............................................................93<br />
8.2.2. Appendix2.2. Algae ....................................................................................94<br />
8.2.3. Appendix 2.3. Fish ......................................................................................94<br />
8.2.4. Appendix 2.4. Hard bottom substr<strong>at</strong>e. Benthos ..........................................95<br />
8.3. Appendix 3. Infauna............................................................................................98<br />
8.3.1. Appendix 3.1. Infauna mean abundance 1999-2004...................................98<br />
8.3.2. Appendix 3.2. Infauna mean abundance 1999-2005 (spring).....................99<br />
8.3.3. Appendix 3.3. Infauna mean biomass WW. 1999-2004 ...........................100<br />
8.3.4. Appendix 3.4. Infauna mean biomass WW 1999-2005 (Spring)..............101<br />
8.3.5. Appendix 3.4. Infauna mean biomass DW 1999-2005 (Spring)...............102<br />
8.4. Appendix 4. Hard bottom substr<strong>at</strong>e ..................................................................103<br />
8.4.1. Appendix 4.1. Rel<strong>at</strong>ive coverage. Monopiles ...........................................103<br />
8.4.2. Appendix 4.3. Mean abundance. Monopiles 2003-2005 ..........................107<br />
8.4.3. Appendix 4.4. Mean abundance. Scour protections 2003-2005 ...............113<br />
8.4.4. Appendix 4.5. Mean biomass WW. Monopiles 2003-2005......................116<br />
8.4.5. Appendix 4.6. Mean biomass WW. Scour protections 2003-2005...........122<br />
8.4.6. Appendix 4.7. Mean biomass DW. Monopiles 2003-2005.......................125<br />
8.4.7. Appendix 4.8. mean biomass DW. Scour protections 2003-2005 ............131<br />
Doc. No. 2572-03-005 rev. 4
<strong>Horns</strong> <strong>Rev</strong>. <strong>Benthic</strong> communities Page 5<br />
Summary<br />
In 1997, the <strong>Horns</strong> <strong>Rev</strong> area was design<strong>at</strong>ed as one of five areas suitable for future offshore<br />
wind farm development pursuant to the Danish Action Plan for Offshore Wind<br />
Farms. In 2002, the <strong>Horns</strong> <strong>Rev</strong> Offshore Wind Farm was established with a production<br />
capacity of 160 MW.<br />
As part of the demonstr<strong>at</strong>ion project, a monitoring programme was initi<strong>at</strong>ed to investig<strong>at</strong>e<br />
the effects on the environment before, during <strong>and</strong> after the completion of the wind farm.<br />
The objective of the programme was to ensure th<strong>at</strong> offshore wind power does not have<br />
damaging effects on n<strong>at</strong>ural ecosystems <strong>and</strong> to provide a solid basis for decisions for further<br />
offshore wind power development. The present study describes the effects on the benthic<br />
fauna <strong>and</strong> flora communities in the area design<strong>at</strong>ed for <strong>and</strong> l<strong>at</strong>er developed into the<br />
<strong>Horns</strong> <strong>Rev</strong> Offshore Wind Farm.<br />
<strong>Horns</strong> <strong>Rev</strong> – the site of loc<strong>at</strong>ion<br />
<strong>Horns</strong> <strong>Rev</strong> is an extension of Blåv<strong>and</strong>s Huk, which extends more than 40 km to the west<br />
into the North Sea. The width of the reef varies between 1 km <strong>and</strong> 5 km <strong>and</strong> forms the<br />
northern extremity of the European Wadden Sea. <strong>Horns</strong> <strong>Rev</strong> was formed by sediment deposited<br />
during earlier geological periods. Today these deposits are covered by huge accumul<strong>at</strong>ions<br />
of marine s<strong>and</strong> <strong>and</strong> are subject to continuous s<strong>and</strong> deposition.<br />
<strong>Horns</strong> <strong>Rev</strong> is constantly adjusting to vari<strong>at</strong>ions in hydrography <strong>and</strong> sea level changes. It is<br />
an area of rel<strong>at</strong>ively shallow w<strong>at</strong>er, tidally influenced <strong>and</strong> domin<strong>at</strong>ed by waves. The hydrographic<br />
conditions are mainly a result of intrusions of Atlantic w<strong>at</strong>er into the southern<br />
part of the North Sea. The tidal current is mainly in a north south direction with a prevailing<br />
current toward NNE <strong>and</strong> a mean current speed of 0.5-0.7 m/s. The w<strong>at</strong>er depth <strong>and</strong> the<br />
prevailing mixing of the w<strong>at</strong>er do not favour str<strong>at</strong>ified conditions or oxygen depletion.<br />
The <strong>Horns</strong> <strong>Rev</strong> Offshore Wind Farm was established approxim<strong>at</strong>ely 14 km WSW off<br />
Blåv<strong>and</strong>s Huk. A total of 80 turbines were installed with the last turbine set in place in<br />
August 2002. The wind turbine found<strong>at</strong>ions are monopiles th<strong>at</strong> are 4 m in diameter. In order<br />
to minimise erosion, scour protections th<strong>at</strong> are approxim<strong>at</strong>ely 25 m in diameter were<br />
established using large stones around the found<strong>at</strong>ions.<br />
Within the wind farm area, the w<strong>at</strong>er depth varies from 6.5 m to 13.5 m. From the baseline<br />
study, the sediment consisted of medium to coarse s<strong>and</strong> with a gre<strong>at</strong> variability in grain<br />
size distribution. The seabed was generally characterised by migr<strong>at</strong>ing bed forms.<br />
Objectives<br />
The possible <strong>and</strong> expected effects on benthic communities from the wind farm establishment<br />
were outlined in the Environmental Impact Assessment. Loss of pre-existing habit<strong>at</strong>s,<br />
the physical presence of the wind turbines <strong>and</strong> the introduction of hard substr<strong>at</strong>e habit<strong>at</strong>s<br />
were considered as the main <strong>and</strong> most important impacts to the benthic communities.<br />
In compliance with the objectives of the demonstr<strong>at</strong>ion programme monitoring of effects<br />
on the benthic <strong>and</strong> epifouling communities was required. The monitoring targeted the potential<br />
impacts from the introduction of hard substr<strong>at</strong>e to benthic communities <strong>and</strong> the<br />
succession in the epifouling communities. The monitoring was performed from 1999 to<br />
2005, before <strong>and</strong> after the erection of the wind farm.<br />
Doc. No. 2572-03-005 rev. 4
<strong>Horns</strong> <strong>Rev</strong>. <strong>Benthic</strong> communities Page 6<br />
Methodology<br />
The sampling methodology for the monitoring programme was designed based on an<br />
evalu<strong>at</strong>ion of the d<strong>at</strong>a from 1999 solely to enable detection of major changes in the community<br />
structure of the infauna <strong>and</strong> to monitor the introduced hard bottom communities<br />
which was in compliance with the requirements set by the n<strong>at</strong>ional authorities.<br />
The monitoring on infauna <strong>and</strong> sediment included collection of samples by SCUBA divers<br />
in the wind farm area <strong>and</strong> in design<strong>at</strong>ed reference areas outside the wind farm. The st<strong>at</strong>ions<br />
in the wind farm were situ<strong>at</strong>ed 5, 25 <strong>and</strong> 100 metres in a leeward direction from the<br />
scour protections around six turbine sites.<br />
The hard bottom substr<strong>at</strong>e monitoring of epifouling communities was performed <strong>at</strong> six<br />
turbine sites to investig<strong>at</strong>e the horizontal <strong>and</strong> vertical distribution on scour protections <strong>and</strong><br />
monopiles. Quantit<strong>at</strong>ive samples were collected from stone blocks <strong>at</strong> all six turbine scour<br />
protection sites; whereas the monopiles were only sampled <strong>at</strong> three turbine sites. Semiquantit<strong>at</strong>ive<br />
(not precisely counted records) observ<strong>at</strong>ions on the horizontal <strong>and</strong> vertical<br />
distribution of the flora <strong>and</strong> fauna fouling communities were made <strong>at</strong> all six turbine sites.<br />
The observ<strong>at</strong>ions were classified according to a modified Braun-Blanquet scale along<br />
transects on both the scour protections <strong>and</strong> the monopiles. Epifouling communities exposed<br />
to different current regimes were studied both on the monopiles as well as on the<br />
scour protection. Some additional sampling was performed on specific communities in the<br />
splash zone. Fish species were observed, in addition to st<strong>and</strong>ard gill nets being used for<br />
specific test fishing. For document<strong>at</strong>ion, underw<strong>at</strong>er video recordings were made.<br />
Multivari<strong>at</strong>e analysis of the combined input from each species with respect to biomass <strong>and</strong><br />
abundance was used to enhance the sensitivity of the st<strong>at</strong>istical analysis.<br />
Sediment<br />
The wind farm area <strong>and</strong> the reference area are characterised by rel<strong>at</strong>ively uniform bottom<br />
conditions consisting of pure medium-fine to coarse s<strong>and</strong> with no organic m<strong>at</strong>ter. The particle<br />
size, measured as median grain size, of the sediment in the wind farm area has increased<br />
significantly from 350 µm in 2001 to 509 µm in 2005. A proportional increase<br />
was found in the reference areas with no differences being found in sediment parameters<br />
between reference <strong>and</strong> wind farm areas <strong>at</strong> each survey. In an exp<strong>and</strong>ed reference area,<br />
gre<strong>at</strong> variability in the grain size distribution was found. This variability is likely due to<br />
temporal changes <strong>and</strong> sp<strong>at</strong>ial differences in the sediment parameters in the <strong>Horns</strong> <strong>Rev</strong><br />
area, which are <strong>at</strong>tributable to n<strong>at</strong>ural vari<strong>at</strong>ions in the seabed sediments.<br />
Infauna<br />
The n<strong>at</strong>ural benthic fauna in the <strong>Horns</strong> <strong>Rev</strong> area can be characterised as a Goniadella-<br />
Spisula community named after characteristic species in the community. Character species<br />
in the <strong>Horns</strong> <strong>Rev</strong> area consist of bristle worms (Goniadella bobretzkii, Ophelia borealis,<br />
Pisione remota, <strong>and</strong> Orbinia sertul<strong>at</strong>a) <strong>and</strong> mussels (Goodallia triangularis <strong>and</strong> Spisula<br />
solida). The most abundant species were Goniadella bobretzkii <strong>and</strong> Goodallia triangularis.<br />
Like the fauna <strong>at</strong> other sublittoral s<strong>and</strong>banks in the North Sea, the fauna <strong>at</strong> <strong>Horns</strong><br />
<strong>Rev</strong> was very variable, heterogeneous <strong>and</strong> difficult to compare with other s<strong>and</strong>banks <strong>and</strong><br />
adjoining deeper w<strong>at</strong>ers. Mobile epifauna like the edible crab (Cancer pagurus) <strong>and</strong> the<br />
hermit crab (Pagurus bernhardus) could often be found on the seabed.<br />
Doc. No. 2572-03-005 rev. 4
<strong>Horns</strong> <strong>Rev</strong>. <strong>Benthic</strong> communities Page 7<br />
<strong>Con</strong>siderable <strong>and</strong> st<strong>at</strong>istically significant changes in the community structure were found<br />
in the infauna community in the wind farm area from 2001 to 2003 <strong>and</strong> 2004, although no<br />
changes were found in the community structure between 1999 <strong>and</strong> 2005. In general, no<br />
st<strong>at</strong>istical significant changes in abundance <strong>and</strong> biomass distribution were found from<br />
1999 to 2005 for most of the design<strong>at</strong>ed indic<strong>at</strong>or organisms. The changes are considered<br />
as n<strong>at</strong>ural vari<strong>at</strong>ions <strong>and</strong> are not <strong>at</strong>tributable to the wind farm construction. No differences<br />
were found in benthic communities between sites <strong>at</strong> different distances from the wind turbine<br />
structures.<br />
Effects from the wind farm<br />
No effect was found on the sediment distribution p<strong>at</strong>tern from the changes in hydrodynamic<br />
regimes due to the establishment of the turbine found<strong>at</strong>ions.<br />
No st<strong>at</strong>istically significant differences were found in community structures on the scour<br />
protections between the leeward <strong>and</strong> the current side of the monopiles. At the base of the<br />
monopiles, a st<strong>at</strong>istical difference was found in community structures indic<strong>at</strong>ing an impact<br />
from different hydrodynamic regimes on each side of the monopiles. Differences in community<br />
structure on the scour protections between overlapping zones <strong>at</strong> the leeward side of<br />
the monopiles might also reflect the effect of turbulence in the hydrodynamic regimes.<br />
Differences in the distribution p<strong>at</strong>tern of mussels inside <strong>and</strong> outside the wind farm area<br />
might be an effect from differences in the feeding behaviour of sea birds.<br />
The most significant effect <strong>at</strong>tributable to the construction of the offshore wind farm was<br />
the loss of pre-existing habit<strong>at</strong>s <strong>and</strong> the introduction of hard substr<strong>at</strong>e habit<strong>at</strong>s into a community<br />
th<strong>at</strong> originally was domin<strong>at</strong>ed by infauna in s<strong>and</strong>y sediments.<br />
Hard bottom structures. Veget<strong>at</strong>ion<br />
The seaweeds introduced on the hard bottom structures displayed a distinct vari<strong>at</strong>ion in<br />
temporal <strong>and</strong> sp<strong>at</strong>ial distribution. The veget<strong>at</strong>ion was more frequently found on the monopiles<br />
compared to the scour protections. Only a few species were found on stones on the<br />
scour protections <strong>and</strong> if found these were predominantly <strong>at</strong> turbine sites in the shallowest<br />
sites, but an increase in total coverage was found since 2003.<br />
A typical vertical zon<strong>at</strong>ion was found on the monopiles with species of Ulva (Enteromorpha)<br />
being the most frequent. <strong>Con</strong>siderable changes in the veget<strong>at</strong>ion community were<br />
observed since 2003, especially in the splash zone <strong>and</strong> <strong>at</strong> the upper part of the monopiles.<br />
Apparently the initial veget<strong>at</strong>ion cover of filamentous algae was replaced by more or less<br />
permanent veget<strong>at</strong>ion consisting of different species of green algae (Ulva). The red algae<br />
(Polysiphonia fibrillose), the purple laver (Porphyra umbilicalis) <strong>and</strong> the green algae<br />
(Chaetomorpha linum) were introduced <strong>at</strong> the l<strong>at</strong>est in 2005. Succession in the veget<strong>at</strong>ion<br />
cover of green algae <strong>at</strong> the monopiles was found with an increased depth distribution since<br />
2003.<br />
Hard bottom structures. Epifauna<br />
Gre<strong>at</strong> vari<strong>at</strong>ions were found in temporal <strong>and</strong> sp<strong>at</strong>ial distribution between species <strong>and</strong><br />
communities. In general, community structure between turbine sites was st<strong>at</strong>istically different.<br />
Differences in abundances of the dominant species of amphipods (Jassa marmor<strong>at</strong>a<br />
<strong>and</strong> Caprella linearis) were the main factors to the vertical <strong>and</strong> sp<strong>at</strong>ial differences.<br />
Doc. No. 2572-03-005 rev. 4
<strong>Horns</strong> <strong>Rev</strong>. <strong>Benthic</strong> communities Page 8<br />
The cosmopolitan (Jassa marmor<strong>at</strong>a) was most frequently found on the monopiles in densities<br />
of more than 1 million ind./m 2 .<br />
Distinct vertical zon<strong>at</strong>ions <strong>and</strong> changes in distribution p<strong>at</strong>tern <strong>and</strong> abundances were observed<br />
in the faunal assemblages on the monopiles since the initial coloniz<strong>at</strong>ion in 2003.<br />
In the splash zone, the almost monoculture popul<strong>at</strong>ion of the “giant” midge (Telm<strong>at</strong>ogeton<br />
japonicus) increased markedly since 2003. Dense aggreg<strong>at</strong>ions of either sp<strong>at</strong> or larger individuals<br />
of Mytilus edulis were found in the sublittoral zone just bene<strong>at</strong>h the sea surface<br />
<strong>at</strong> the monopiles. Changes in popul<strong>at</strong>ion structure since 2003 clearly demonstr<strong>at</strong>e growth<br />
of the common mussels. In 2005, successful establishment of Mytilus edulis was found <strong>at</strong><br />
more turbine sites than previously. Clear discrepancies in the distribution <strong>and</strong> abundance<br />
between the common mussel (Mytilus edulis), the barnacle (Balanus cren<strong>at</strong>us) <strong>and</strong> the<br />
pred<strong>at</strong>or (Asterias rubens) indic<strong>at</strong>ed th<strong>at</strong> the starfish was the main keystone pred<strong>at</strong>or controlling<br />
the vertical <strong>and</strong> horizontal distribution of its prey species.<br />
At the base of the monopiles, the keelworm (Pom<strong>at</strong>oceros triqueter), an initial colonizer,<br />
was more abundant than in the upper zones. This species has decreased in abundance since<br />
September 2003. The apparent stagn<strong>at</strong>ion in popul<strong>at</strong>ion size of Pom<strong>at</strong>oceros triqueter<br />
might be the result of competition for space from other species. Similarly, another primary<br />
coloniser, the hydrozoan (Tubularia indivisa), displayed a r<strong>at</strong>her fluctu<strong>at</strong>ing distribution<br />
p<strong>at</strong>tern <strong>and</strong> was less abundant in 2004 compared to 2003. This could be a result of lack of<br />
space or pred<strong>at</strong>ion from sea slugs (Facelina bostoniensis), which among others were new<br />
to the <strong>Horns</strong> <strong>Rev</strong> fauna in 2004.<br />
Impact from pred<strong>at</strong>ion, recruitment <strong>and</strong> competition for space will contribute to a continuously<br />
repe<strong>at</strong>ing succession process until a rel<strong>at</strong>ively stabile community is reached.<br />
Hard substr<strong>at</strong>es were found being used as h<strong>at</strong>chery or nursery grounds for several species<br />
after construction of the wind farm. The new introduced habit<strong>at</strong> was an especially successful<br />
nursery for the edible crab (Cancer pagurus). The number <strong>and</strong> biomass of Cancer<br />
pagurus juveniles <strong>at</strong> the turbine sites has increased markedly from 2003 to 2005.<br />
Succession in the epifaunal community was demonstr<strong>at</strong>ed but the community will continuously<br />
undergo changes due to ecological succession enabling a climax community to<br />
be formed. A climax community is not expected within 5-6 years after hard substr<strong>at</strong>e deployment.<br />
Occasional disruption of community succession due to effects from storm<br />
events <strong>and</strong> hard winters may even prolong this process until a stable community is <strong>at</strong>tained.<br />
Introduced <strong>and</strong> design<strong>at</strong>ed species<br />
The introduction of more fouling species in the <strong>Horns</strong> <strong>Rev</strong> area is directly <strong>at</strong>tributable to<br />
the deployment of hard bottom structures. Two species, the initial colonizers Jassa marmor<strong>at</strong>a<br />
<strong>and</strong> Telm<strong>at</strong>ogeton japonicus, have not previously been recorded in Danish w<strong>at</strong>ers.<br />
In the m<strong>at</strong>erial of Caprella linearis, some of the specimens were identified as Caprella<br />
mutica in 2005, which is an alien species introduced from the Japanese Sea. Occasionally<br />
some of these species were introduced to the faunal communities on the s<strong>and</strong>ed seabed.<br />
Special <strong>at</strong>tention should be given to the ross worm (Sabellaria spinulosa) <strong>and</strong> the white<br />
weed (Sertularia cupressina), which in the Wadden Sea area are regarded as thre<strong>at</strong>ened or<br />
Doc. No. 2572-03-005 rev. 4
<strong>Horns</strong> <strong>Rev</strong>. <strong>Benthic</strong> communities Page 9<br />
red listed species. Although more common on hard bottom substr<strong>at</strong>es the ross worm can<br />
gener<strong>at</strong>e biogenic reef structures on mixed sediments or shells.<br />
Fish community<br />
A marked increase in the number of fish <strong>and</strong> fish species was observed from the March<br />
surveys to the September surveys each year. This might be a result of seasonal migr<strong>at</strong>ions<br />
of fish species to the turbine site for foraging. Bip (pouting) was observed presumably<br />
feeding on crustaceans on the scour protection together with schools of cod. The<br />
goldsinny-wrasse was often found in numbers <strong>at</strong> the turbine sites. Individuals of the rock<br />
gunnel <strong>and</strong> the dragonet were commonly found inhabiting caves <strong>and</strong> crevices between the<br />
stones.<br />
It seems th<strong>at</strong> noise <strong>and</strong> vibr<strong>at</strong>ions from the turbine gener<strong>at</strong>ors have not impacted the fish<br />
<strong>and</strong> other mobile organisms <strong>at</strong>tracted to the hard bottom substr<strong>at</strong>es for foraging, shelter<br />
<strong>and</strong> protection.<br />
By comparing the average biomass of the infauna on the s<strong>and</strong> bottom between the turbines,<br />
it was estim<strong>at</strong>ed th<strong>at</strong> the availability of food for fish <strong>at</strong> the wind turbine sites has<br />
increased by a factor of approxim<strong>at</strong>ely 50 after the introduction of the hard substr<strong>at</strong>um <strong>at</strong><br />
<strong>Horns</strong> <strong>Rev</strong>. Taking the whole wind farm area into account, the estim<strong>at</strong>ed increase in biomass<br />
is only 38 tonnes or about 7% of the total biomass in the area. An increase in fish<br />
production rel<strong>at</strong>ed to the presence of the hard substr<strong>at</strong>um is considered possible.<br />
Results in perspective to the monitoring objectives<br />
The establishment of the wind farm resulted only in insignificant loss of n<strong>at</strong>ural seabed,<br />
which was replaced by hard bottom structures.<br />
Results from the investig<strong>at</strong>ions on the benthic communities showed th<strong>at</strong> only negligible<br />
impacts on the n<strong>at</strong>ive communities are <strong>at</strong>tributable to the wind turbine structures. The effects<br />
of the introduced hard substr<strong>at</strong>es increased local biodiversity <strong>and</strong> increased local<br />
food availability. Cumul<strong>at</strong>ive effects of reduced trawling activities might be beneficial to<br />
local biodiversity by enabling benthic communities to m<strong>at</strong>ure <strong>and</strong> generally improve environmental<br />
conditions in areas of more wind farms.<br />
Doc. No. 2572-03-005 rev. 4
<strong>Horns</strong> <strong>Rev</strong>. <strong>Benthic</strong> communities Page 10<br />
Doc. No. 2572-03-005 rev. 4
<strong>Horns</strong> <strong>Rev</strong>. <strong>Benthic</strong> communities Page 11<br />
Sammenf<strong>at</strong>ning (in Danish)<br />
Som en følge af den danske h<strong>and</strong>lingsplan for havvindmøller blev området ved <strong>Horns</strong> <strong>Rev</strong><br />
i 1997 som et ud af fem områder udpeget som et egnet sted for placeringen af fremtidige<br />
havvindmølleparker. I 2002 blev <strong>Horns</strong> <strong>Rev</strong> Havvindmøllepark etableret med en produktionskapacitet<br />
på 160 MW.<br />
Som en del af demonstr<strong>at</strong>ionsprojektet blev der igangs<strong>at</strong> et overvågningsprogram til undersøgelse<br />
af miljøeffekterne før, under og efter etableringen af havmølleparken. Formålet<br />
med programmet var <strong>at</strong> sikre, <strong>at</strong> havbaseret vindkraft ikke har en skadelig indflydelse på<br />
n<strong>at</strong>urlige økosystemer samt <strong>at</strong> tilvejebringe et solidt grundlag for beslutningerne om forts<strong>at</strong><br />
udvikling af havbaseret vindkraft. Nærværende undersøgelse beskriver effekterne på<br />
bentiske fauna- og florasamfund i det udpegede og senere etablerede område for <strong>Horns</strong><br />
<strong>Rev</strong> Havvindmøllepark.<br />
<strong>Horns</strong> <strong>Rev</strong> - områdebeskrivelse<br />
<strong>Horns</strong> <strong>Rev</strong> strækker sig mere end 40 km mod vest ud i Nordsøen fra Blåv<strong>and</strong>s Huk. Bredden<br />
af revet varierer mellem 1 og 5 km og revet danner den nordlige afgrænsning af Vadehavet.<br />
Horn <strong>Rev</strong> er dannet af sedimentaflejringer i tidligere geologiske perioder. I dag er<br />
disse aflejringer igen overlejret af tykke akkumul<strong>at</strong>ioner af marint s<strong>and</strong>. Der foregår stadigvæk<br />
pålejringer af sediment.<br />
<strong>Horns</strong> <strong>Rev</strong> området er meget dynamisk og underlagt hydrografiske vari<strong>at</strong>ioner og v<strong>and</strong>st<strong>and</strong>sændringer.<br />
Det er et forholdsvist lavv<strong>and</strong>et område som er domineret af bølger og<br />
påvirket af tidev<strong>and</strong>. De hydrografiske forhold i området er primært bestemt af indtrængende<br />
Atlantisk v<strong>and</strong> til den sydlige del af Nordsøen. Tidev<strong>and</strong>strømmen er hovedsagelig<br />
nord-sydgående med en resulterende strøm gående mod NNØ med en middelstrømhastighed<br />
på 0,5-0,7 m/s. V<strong>and</strong>dybden og overvejende fuld opbl<strong>and</strong>ing af v<strong>and</strong>masserne forhindrer<br />
lagdeling af v<strong>and</strong>masserne og begrænser dermed mulighederne for iltsvind.<br />
<strong>Horns</strong> <strong>Rev</strong> havvindmøllepark blev etableret omtrent 14 km VSV ud for Blåv<strong>and</strong>s Huk og<br />
består af 80 møller hvoraf den sidste mølle var installeret i august 2002. Møllefundamenterne<br />
er såkaldte ”monopiles” med en diameter på 4 m. For <strong>at</strong> minimere erosionen blev der<br />
etableret en erosionsbeskyttelse med en diameter på ca. 25 m omkring fundamenterne.<br />
Erosionsbeskyttelsen består af store sten<br />
I mølleområdet varierer dybden fra 6,5 m til 13,5 m. I basisbeskrivelsen blev sedimentet<br />
beskrevet som mellemfint til grovkornet s<strong>and</strong> med en stor vari<strong>at</strong>ion i kornstørrelsesfordelingen.<br />
Havbunden blev generelt karakteriseret ved migrerende bundformer.<br />
Formål<br />
De mulige og forventede påvirkninger af bunddyrsamfundene fra etableringen af havvindmølleparken<br />
er beskrevet i VVM-redegørelsen. Påvirkningerne af de bentiske samfund<br />
blev vurderet til især <strong>at</strong> være tab af oprindelige levesteder, den fysiske tilstedeværelse<br />
af havvindmøllerne og introduktionen af hårdbundssubstr<strong>at</strong> på den ellers s<strong>and</strong>ede bund.<br />
I overensstemmelse med formålet af demonstr<strong>at</strong>ionsprojektet var det nødvendigt <strong>at</strong> overvåge<br />
effekterne på de bentiske samfund samt effekterne på begroningssamfundet. Overvågningen<br />
var målrettet mod <strong>at</strong> klarlægge effekterne på de bentiske samfund af introdukti-<br />
Doc. No. 2572-03-005 rev. 4
<strong>Horns</strong> <strong>Rev</strong>. <strong>Benthic</strong> communities Page 12<br />
onen af hårdbundssubstr<strong>at</strong> og mod <strong>at</strong> følge udviklingen i begroningssamfundet. Undersøgelserne<br />
blev foretaget i perioden fra 1999 til 2005.<br />
Metode<br />
På baggrund af en vurdering af d<strong>at</strong>a fra 1999 samt i overensstemmelse med myndighedernes<br />
krav blev overvågningsprogrammets prøve indsamling tilrettelagt således, <strong>at</strong> kun større<br />
ændringer i bunddyrenes samfundsstruktur kunne detekteres samt <strong>at</strong> det introducerede<br />
hårdbundssamfund kunne overvåges.<br />
Overvågningen af infauna og sediment inkluderede indsamling af prøver med dykkere i<br />
mølleparken og i et udpeget referenceområde uden for mølleparken. St<strong>at</strong>ionerne i mølleområdet<br />
blev placeret 5, 25 og 100 meter nedstrøms (i forhold til den fremherskende<br />
strømretning) erosionsbeskyttelsen ved 6 møllelokaliteter.<br />
Undersøgelser af henholdsvis den horisontale og den vertikale fordeling af begroningssamfundet<br />
blev udført ved 6 møllelokaliteter på henholdsvis erosionsbeskyttelsen og monopælene.<br />
Indsamlingen af prøver blev foretaget af dykkere. Der blev indsamlet kvantit<strong>at</strong>ive prøver<br />
fra sten på erosionsbeskyttelsen ved alle 6 møllelokaliteter, hvorimod der kun blev indsamlet<br />
prøver fra monopæle ved 3 møllelokaliteter. Langs transekter omf<strong>at</strong>tende både monopæle<br />
og erosionsbeskyttelsen blev der foretaget semi-kvantit<strong>at</strong>ive (ikke numerisk præcise)<br />
beskrivelser af begronings-samfundet efter en modificeret Braun-Blanquet skala. Begroningssamfundet<br />
blev undersøgt i rel<strong>at</strong>ion til eventuelle forskelle i strømforhold på både<br />
erosionsbeskyttelsen og på monopælene. Der blev foretaget supplerende prøvetagninger i<br />
specifikke samfund i sprøjte/bølgeslagszonen. Forekomsten af fiskearter blev registreret<br />
og tillige blev der udført et testfiskeri med st<strong>and</strong>ard undersøgelsesgarn. Til dokument<strong>at</strong>ion<br />
af forholdene blev der optaget underv<strong>and</strong>svideo.<br />
Multivari<strong>at</strong>e analyser blev anvendt på det kombinerede d<strong>at</strong>asæt til for hver art <strong>at</strong> forøge<br />
følsomheden af de st<strong>at</strong>istiske analyser med hensyn til såvel biomasse som individtæthed<br />
Sediment<br />
Både i mølleområdet og i referenceområdet kan bundforholdene karakteriseres som ensartede<br />
med et sediment bestående af rent, mellemfint til groft s<strong>and</strong> uden nævneværdigt indhold<br />
af organisk stof. I mølleområdet er der sket en signifikant forøgelse af sedimentets<br />
mediankornstørrelse fra 345 µm i 2001 til 509 µm i 2005. En tilsvarende forøgelse i kornstørrelsen<br />
blev også fundet i referenceområdet, ligesom der ved de enkelte undersøgelser<br />
ikke blev fundet forskelle i sedimentparametrene mellem referenceområdet og mølleområdet.<br />
Der blev registreret en forholdsvis stor vari<strong>at</strong>ion med hensyn til kornstørrelsesfordelingen<br />
i det udvidede referenceområde. Denne vari<strong>at</strong>ion skyldes hovedsageligt forskelle i<br />
sedimentparametrene med hensyn til tid og sted og kan tilskrives de n<strong>at</strong>urlige vari<strong>at</strong>ioner i<br />
området.<br />
Bundfauna<br />
Bundfaunaen i <strong>Horns</strong> <strong>Rev</strong> området kan karakteriseres som et Goniadella-Spisula-samfund<br />
efter de karakteristiske arter. Karakterarterne i <strong>Horns</strong> <strong>Rev</strong> området er havbørsteormene<br />
(Goniadella bobretzkii, Ophelia borealis, Pisione remota og Orbinia sertul<strong>at</strong>a) og muslingerne<br />
(Goodallia triangularis og Spisula solida). De hyppigste arter var, Goniadella<br />
bobretzkii og Goodallia triangularis. Som faunaen på <strong>and</strong>re sublittorale s<strong>and</strong>banker i<br />
Doc. No. 2572-03-005 rev. 4
<strong>Horns</strong> <strong>Rev</strong>. <strong>Benthic</strong> communities Page 13<br />
Nordsøen er også faunaen på <strong>Horns</strong> <strong>Rev</strong> meget variabel og heterogen, og den er derfor<br />
vanskelig <strong>at</strong> sammenligne med faunaen på <strong>and</strong>re s<strong>and</strong>banker og med faunaen i tilstødende,<br />
dybereliggende områder. Mobile arter som taskekrabben (Cancer pagurus) og eremitkrebsen<br />
(Pagurus bernhardus) blev ofte observeret på havbunden.<br />
Effekter fra mølleparken<br />
Der blev ikke konst<strong>at</strong>eret nogen effekt på sedimentets fordelingsmønster som følge etableringen<br />
af møllefundamenterne og de deraf afledte ændringer af de hydrodynamiske forhold.<br />
På erosionsbeskyttelserne blev der ikke konst<strong>at</strong>eret st<strong>at</strong>istisk signifikante forskelle i samfundsstrukturen<br />
mellem læsiden og strømsiden af monopælene. Nederst på selve monopælene<br />
var der dog en st<strong>at</strong>istisk signifikant forskel i samfundsstrukturen som kan skyldes de<br />
markante forskelle i de hydrodynamiske forhold mellem de to sider af monopælene.<br />
Fundne forskelle i samfundsstrukturen mellem zoner, der er overlappende, på erosionsbeskyttelsen<br />
skyldes muligvis også effekten af turbulens i læsiden af monopælene.<br />
Konst<strong>at</strong>erede forskelle i fordelingsmønsteret af muslinger afspejler muligvis effekten af<br />
forskelle i havfuglenes fødesøgningsadfærd i og uden for mølleparken.<br />
Den mest markante effekt af anlæggelsen af havmølleparken var tabet af oprindelige levesteder<br />
og indførelsen af hårdbundshabit<strong>at</strong>er i samfund, der oprindelig var domineret af infauna<br />
tilknyttet s<strong>and</strong>ede sedimenter.<br />
Hårdbundsstrukturer: Veget<strong>at</strong>ion<br />
På hårdbundsstrukturerne blev der fundet en tydelig tidsmæssig og rummelig vari<strong>at</strong>ion i<br />
fordelingsmønsteret af de indv<strong>and</strong>rede alger. Sammenlignet med erosionsbeskyttelsen<br />
blev veget<strong>at</strong>ionen hyppigst observeret på monopælene. Der blev kun fundet få arter på<br />
stenene på erosionsbeskyttelsen, og det var karakteristisk, <strong>at</strong> disse næsten udelukkende var<br />
beliggende på møller på steder med de mindste v<strong>and</strong>dybder; men der blev dog registreret<br />
en generel stigning i den totale dækningsgrad efter 2003.<br />
Der blev registreret en tydelig vertikal zonering af algerne på monopælene, hvor arter af<br />
slægten Ulva (Enteromorpha) var de hyppigst forekommende. Der er konst<strong>at</strong>eret betydelige<br />
ændringer i veget<strong>at</strong>ionssamfundet siden 2003, specielt på monopælene i sprøjte/bølgeslagszonen<br />
samt i zonen lige under havoverfladen. Tilsyneladende blev det første<br />
veget<strong>at</strong>ionsdække bestående af trådformede alger erst<strong>at</strong>tet af en mere permanent veget<strong>at</strong>ion<br />
bestående af forskellige arter af grønalger (Ulva). Senere (2005) blev rødalgerne (Polysiphonia<br />
fibrillose) og purpurhinde (Porphyra umbilicalis) samt grønalgen (Chaetomorpha<br />
linum) konst<strong>at</strong>eret. Fra 2003 og frem er der på monopælene konst<strong>at</strong>eret en stigning<br />
i dybdegrænsen af veget<strong>at</strong>ionsdækket af grønalger.<br />
Hårdbundsstruktuer: Epifauna<br />
Der blev fundet en stor tidsmæssig og rumlig vari<strong>at</strong>ion i fordelingsmønstrene mellem arter<br />
og samfund. Generelt blev der fundet st<strong>at</strong>istisk signifikante forskelle i samfundene mellem<br />
de enkelte møllelokaliteter. Den væsentligste årsag hertil er forskelle i individtæthederne<br />
af de dominerende arter - tanglopperne Jassa marmor<strong>at</strong>a og Caprella linearis. Jassa<br />
marmor<strong>at</strong>a, der er en kosmopolitisk art, blev hyppigst fundet på selve monopælene med<br />
tætheder på op til mere end 1 million individer/m 2 .<br />
Doc. No. 2572-03-005 rev. 4
<strong>Horns</strong> <strong>Rev</strong>. <strong>Benthic</strong> communities Page 14<br />
Der blev registreret tydelige zoneringer samt ændringer i fordelingsmønstrene og individtæthederne<br />
i faunasamfundene på monopælene siden den første kolonis<strong>at</strong>ion i 2003. I<br />
sprøjte/bølgeslagszonen har den næsten monospecifikke forekomst af den store dansemyg<br />
Telm<strong>at</strong>ogeton japonicus øget individtætheden betydeligt siden 2003. Tætte forekomster af<br />
enten yngel eller større individer af blåmuslingen Mytilus edulis blev registreret på monopælene<br />
lige under havoverfladen. Ændringer i popul<strong>at</strong>ionsstukturen viser, <strong>at</strong> der siden<br />
2003 er sket en tydelig vækst af blåmuslingerne. I 2005 blev det konst<strong>at</strong>eret, <strong>at</strong> Mytilus<br />
eduls havde haft succes med <strong>at</strong> etablere sig på flere møllelokaliteter end tidligere. Tydelig<br />
adskillelse med hensyn til fordeling og tæthed af blåmuslingen Mytilus edulis, (delvis) ruren<br />
Balanus cren<strong>at</strong>us og rovdyret Asterias rubens indikerer, <strong>at</strong> søstjernen var ”nøgle”rovdyret,<br />
der kontrollerede både den vertikale og horisontale fordeling af byttedyrene.<br />
Den tidlige indv<strong>and</strong>rer - trekantsormen Pom<strong>at</strong>oceros triqueter - var generelt mere talrig i<br />
den nedre zone af monopælene end i den øvre zone. Denne art er aftaget i tæthed siden<br />
september 2003. Nedgangen i best<strong>and</strong>en af Pom<strong>at</strong>oceros triqueter kan være et result<strong>at</strong> af<br />
konkurrencen om plads fra <strong>and</strong>re arter. Ligeledes var tætheden af en <strong>and</strong>en tidlig indv<strong>and</strong>rer<br />
polypdyret Tubularia indivisa, der udviste et ret varierende udbredelsesmønster, hvilket<br />
kan være et result<strong>at</strong> af manglende plads eller pred<strong>at</strong>ion fra nøgensnegle (Facelina<br />
bostoniensis). Sidstnævnte blev i 2004 registreret som ny art for <strong>Horns</strong> <strong>Rev</strong>.<br />
Påvirkninger fra rovdyr samt rekruttering og konkurrencen om pladsen vil bidrage til en<br />
fortløbende successionsproces indtil en højere grad af stabilitet i samfundsstrukturen er<br />
opnået.<br />
Det blev ved undersøgelserne konst<strong>at</strong>eret, <strong>at</strong> hårdbundssubstr<strong>at</strong>et blev benyttet som yngle-<br />
og opvækstområde for flere arter, og <strong>at</strong> de menneskeskabte levesteder var specielt gunstige<br />
for opvæksten af taskekrabben (Cancer pagurus). På møllelokaliteterne steg antallet og<br />
biomassen af juvenile Cancer pagurus markant fra 2003 til 2005.<br />
Der er blevet påvist en udvikling i epifauna-samfundet; men samfundet vil også fremover<br />
være underlagt for<strong>and</strong>ringer, som skyldes den n<strong>at</strong>urlige succession og udviklingen mod et<br />
klimaks samfund. Et klimaks samfund er ikke forventeligt inden for de første 5-6 år efter<br />
etableringen af hårdbundsubstr<strong>at</strong>et. Dertil kommer, <strong>at</strong> der vil være periodisk afbrydelse af<br />
successionsforløbet i forbindelse med storme og hårde vintre, hvilket muligvis vil kunne<br />
forlænge udviklingen af et stabilt samfund i området.<br />
Indførte og udvalgte arter<br />
Introduktionen af flere ”begroningsarter” i <strong>Horns</strong> <strong>Rev</strong> området er et direkte result<strong>at</strong> af opstillingen<br />
af vindmøllefundamenterne. De to tidlige kolonis<strong>at</strong>orer - Jassa marmor<strong>at</strong>a og<br />
Telm<strong>at</strong>ogeton japonicus - er ikke tidligere registreret i Danmark. I m<strong>at</strong>erialet af Caprella<br />
linearis blev nogle af individerne i 2005 identificeret som Caprella mutica, som er en indført<br />
art fra det Japanske Hav. Lejlighedsvis blev nogle af disse arter registreret i bundfaunaen<br />
på s<strong>and</strong>bunden.<br />
Børsteormen Sabellaria spinulosa og hav-cypressen Sertularia cupressina fortjener særlig<br />
omtale, idet de begge i vadehavsområdet bliver betragtet som truede og derfor er optaget<br />
på rødlisten. Skønt Sabellaria spinulosa er mere almindelig på hårbundsubstr<strong>at</strong>er kan den<br />
på bl<strong>and</strong>et bund eller skaller danne biogene rev strukturer.<br />
Fiskesamfund<br />
Doc. No. 2572-03-005 rev. 4
<strong>Horns</strong> <strong>Rev</strong>. <strong>Benthic</strong> communities Page 15<br />
Der blev i forbindelse med undersøgelserne konst<strong>at</strong>eret en markant stigning i antallet af<br />
fisk og fiskearter i perioden fra marts til september. Det skyldes muligvis en sæsonbetonet<br />
migr<strong>at</strong>ion af visse fiskearter til og fra møllefundamenterne. Skægtorsk, som tilsyneladende<br />
søgte føde bl<strong>and</strong>t krebsdyrene på erosionsbeskyttelsen, blev ofte observeret sammen med<br />
stimer af almindelig torsk. Havkaruds blev ofte observeret i stort antal ved møllelokaliteterne.<br />
Tangspræl og fløjfisk blev ofte observeret i hulrum og sprækker mellem stenene.<br />
Støj og vibr<strong>at</strong>ioner fra turbinegener<strong>at</strong>orerne havde tilsyneladende ingen effekt på fisk og<br />
<strong>and</strong>re mobile organismer, der var blevet tiltrukket til hårdbundssubstr<strong>at</strong>et i jagten på føde,<br />
ly eller beskyttelse.<br />
En beregning af den tilgængelige fødemængde for fisk i området viste en indtil 50 ganges<br />
forøgelse af biomassen på møllelokaliteterne efter introduktionen af hårdbundssubstr<strong>at</strong>et<br />
på <strong>Horns</strong> <strong>Rev</strong> i forhold til den normale infauna i området mellem møllerne. Tager man<br />
hele mølleområdet i betragtning, er der kun tale om en stigning i biomassen på 38 ton eller<br />
omkring 7% i forhold til den totale infauna-biomasse i området.<br />
Result<strong>at</strong>er perspektiveret i forhold til formål<br />
Etableringen af havmølleparken resulterede i et ubetydeligt tab af n<strong>at</strong>urlig havbund som<br />
blev erst<strong>at</strong>tet af hårdbundsstrukturer.<br />
Result<strong>at</strong>erne fra undersøgelserne af de bentiske samfund viste <strong>at</strong> kun ubetydelige påvirkninger<br />
af det oprindelige samfund kunne henføres til møllefundamenter. Effekten af introduktionen<br />
af hårdbundssubstr<strong>at</strong> var en lokal stigning i biodiversitet og fødetilgængelighed.<br />
Kumul<strong>at</strong>ive effekter af en reduceret trawl aktivitet kan lokalt være til fordel for biodiversiteten<br />
i et område med flere havmølleparker ved <strong>at</strong> de bentiske samfund kan opnå fuldstændig<br />
udvikling og gennem en generel forbedring af mijøtilst<strong>and</strong>en.<br />
Doc. No. 2572-03-005 rev. 4
<strong>Horns</strong> <strong>Rev</strong>. <strong>Benthic</strong> communities Page 16<br />
1. Introduction<br />
1.1. Background<br />
In 1995, the Danish Government formed a committee to define the main areas in Danish<br />
w<strong>at</strong>ers suitable for establishing offshore wind farms. An area of approxim<strong>at</strong>ely 1,000<br />
square kilometres has been identified, corresponding to the production of 7,000-8,000<br />
megaw<strong>at</strong>t (MW) of energy. Most of the areas are loc<strong>at</strong>ed 15-30 kilometres from the coast<br />
<strong>at</strong> a w<strong>at</strong>er depth of 4-10 metres.<br />
The possibilities for utilizing shallow w<strong>at</strong>ers for offshore turbines in Denmark were evalu<strong>at</strong>ed<br />
some years ago in collabor<strong>at</strong>ion between the Danish Utilities <strong>and</strong> the Danish Energy<br />
Authority. An action plan was proposed in which two of the main recommend<strong>at</strong>ions were<br />
to concentr<strong>at</strong>e offshore development within a few areas <strong>and</strong> to carry out a large-scale<br />
demonstr<strong>at</strong>ion programme. In 1998, an agreement was reached between the Government<br />
<strong>and</strong> the production companies to establish a large-scale demonstr<strong>at</strong>ion programme. The<br />
objective of the programme was to investig<strong>at</strong>e economic, technical <strong>and</strong> environmental issues,<br />
to hasten offshore development <strong>and</strong> to open up the selected areas for future wind<br />
farms.<br />
Figure 1.1. Map of the main marine areas appointed for the construction of offshore wind farms in Denmark.<br />
In the 1997 Danish action plan for offshore wind farms, five areas (Figure 1.1) were identified<br />
as suitable for future offshore wind farms. The selection was based on experiences<br />
from the first two small demonstr<strong>at</strong>ion farms (Vindeby <strong>and</strong> Tunø) <strong>and</strong> the recommend<strong>at</strong>ions<br />
from the 1995 Governmental Committee. The 1995 Governmental Committee work<br />
included mapping the w<strong>at</strong>er depth, mapping all scenic aspects <strong>and</strong> interests in the Danish<br />
w<strong>at</strong>ers including bird sanctuaries, raw m<strong>at</strong>erial extraction, marine archaeology, fisheries,<br />
shipping routes <strong>and</strong> military areas <strong>and</strong> visual impact assessments of the coastal l<strong>and</strong>scapes.<br />
Doc. No. 2572-03-005 rev. 4
<strong>Horns</strong> <strong>Rev</strong>. <strong>Benthic</strong> communities Page 17<br />
Based on the above-mentioned evalu<strong>at</strong>ion, five areas were selected as providing the most<br />
suitable sites for offshore wind farm extensions (Figure 1.1).<br />
The Danish Government’s energy action plan “Energy 21” sets a goal th<strong>at</strong> renewable energy<br />
is to cover 12-14% of the total Danish energy consumption. The goal for the period<br />
2005 to 2030 is to achieve an annual increase of 1 percentage-point in the share of renewable<br />
energy in the Danish energy system. This means th<strong>at</strong> the total share of renewable energy<br />
will be approxim<strong>at</strong>ely 35% in 2030. In order to achieve this long-term expansion, a<br />
significant increase of up to 4,000 MW is expected from offshore wind farms by 2030.<br />
The purpose of increasing the share of renewable energy is to ensure environmental improvements<br />
<strong>and</strong> to improve supply security. The environmental improvements will result<br />
in a reduction of the pollution from traditional power st<strong>at</strong>ions. The supply security will be<br />
improved as dependency on imported fuels is reduced. Development of <strong>Horns</strong> <strong>Rev</strong> <strong>and</strong><br />
Nysted Offshore Wind Farms (Røds<strong>and</strong>) are a result of the action plan.<br />
Due to the special st<strong>at</strong>us of the demonstr<strong>at</strong>ion programme, a comprehensive environmental<br />
measurement <strong>and</strong> monitoring programme was initi<strong>at</strong>ed to investig<strong>at</strong>e the effects on the environment<br />
before, during <strong>and</strong> after the completion of the wind farms. The purpose is to<br />
ensure th<strong>at</strong> offshore wind power does not have damaging effects on the n<strong>at</strong>ural ecosystems<br />
<strong>and</strong> to provide a solid basis for decisions about further development of offshore wind<br />
power. In addition, the economic <strong>and</strong> technical aspects are to be evalu<strong>at</strong>ed as part of the<br />
demonstr<strong>at</strong>ion programme. A series of studies were initially undertaken in the two wind<br />
farm areas. They focussed on the environmental conditions <strong>and</strong> the possible impact of an<br />
offshore wind farm. The studies are important for both the extension of the offshore wind<br />
farm <strong>at</strong> the specific sites <strong>and</strong> for the establishment of additional large-scale offshore wind<br />
farms in Denmark.<br />
The present report presents the results of the environmental studies carried out on benthic<br />
communities in connection with the Environmental Impact Assessment (EIA) <strong>and</strong> the<br />
baseline <strong>and</strong> monitoring programmes <strong>at</strong> <strong>Horns</strong> <strong>Rev</strong>.<br />
This report describes the n<strong>at</strong>ural vari<strong>at</strong>ions in the n<strong>at</strong>ive benthic communities in the <strong>Horns</strong><br />
<strong>Rev</strong> area before the establishment of <strong>Horns</strong> <strong>Rev</strong> Offshore Wind Farm, the potential environmental<br />
impacts of the introduction of hard bottom substr<strong>at</strong>e in the offshore wind farm<br />
area <strong>and</strong> finally the impact <strong>and</strong> succession of the introduced epifouling communities <strong>at</strong><br />
turbine found<strong>at</strong>ions.<br />
1.2. <strong>Horns</strong> <strong>Rev</strong><br />
<strong>Horns</strong> <strong>Rev</strong> is an extension of Blåv<strong>and</strong>s Huk extending more than 40 km to the west into<br />
the North Sea. <strong>Horns</strong> <strong>Rev</strong> is considered to be a stable l<strong>and</strong>form th<strong>at</strong> has not changed position<br />
since it was formed (Danish Hydraulic Institute, 1999). The width of the reef varies<br />
between 1 km <strong>and</strong> 5 km.<br />
Blåv<strong>and</strong>s Huk, which is Denmark’s most western point, forms the northern extremity of<br />
the European Wadden Sea area, which covers the area within the Wadden Sea isl<strong>and</strong>s<br />
from Den Helder in Holl<strong>and</strong> to Blåv<strong>and</strong>s Huk.<br />
Doc. No. 2572-03-005 rev. 4
<strong>Horns</strong> <strong>Rev</strong>. <strong>Benthic</strong> communities Page 18<br />
1.2.1. Geology <strong>and</strong> geomorphology<br />
<strong>Horns</strong> <strong>Rev</strong> was formed as deposits of s<strong>and</strong> <strong>and</strong> gravel on top of deposits cre<strong>at</strong>ed during the<br />
Eem geological period <strong>and</strong> glacio-fluvial sediment deposited during the Saale glaci<strong>at</strong>ion.<br />
The constituents of the reef are therefore not the typical mixed sediment of a moraine but<br />
r<strong>at</strong>her well sorted sediments in the form of gravel, grit <strong>and</strong> s<strong>and</strong>. Huge accumul<strong>at</strong>ions of<br />
Holocene marine s<strong>and</strong> deposits, up to 20 m in depth, formed the <strong>Horns</strong> <strong>Rev</strong> area th<strong>at</strong> is<br />
known today with continuous accumul<strong>at</strong>ions (Larsen, 2003). <strong>Horns</strong> <strong>Rev</strong> can be characterised<br />
as a huge n<strong>at</strong>ural blocking s<strong>and</strong> ridge, which blocks the s<strong>and</strong> volume transported<br />
along the Jutl<strong>and</strong> coast. The yearly transport of s<strong>and</strong> is in a magnitude of 500,000 m 3<br />
(Danish Hydraulic Institute, 1999).<br />
<strong>Horns</strong> <strong>Rev</strong> is constantly subject to vari<strong>at</strong>ions in hydrography <strong>and</strong> sea level changes but it<br />
is considered a quasi-stable form<strong>at</strong>ion th<strong>at</strong> will continue to adjust to minor changes in the<br />
local conditions.<br />
In the wind farm area, medium to coarse sediment with mean median particle sizes of approxim<strong>at</strong>ely<br />
345 µm being found in the baseline surveys (Leonhard & Pedersen, 2002).<br />
The sediment consists of almost pure s<strong>and</strong> with no or very low organic content (
<strong>Horns</strong> <strong>Rev</strong>. <strong>Benthic</strong> communities Page 19<br />
1.2.2. Hydrography<br />
<strong>Horns</strong> <strong>Rev</strong> is an area of rel<strong>at</strong>ively shallow w<strong>at</strong>er, tidally influenced <strong>and</strong> domin<strong>at</strong>ed by<br />
waves. The North Sea is a complex resonant tidal system caused by the rectangular form<br />
of the basin. The mean tidal range in the wind farm area is about 1.2 m (Danish Hydraulic<br />
Institute, 1999). Within the wind farm area, the w<strong>at</strong>er depth varies from 6.5 m to 13.5 m.<br />
The depth conditions in the area result in the waves breaking in the wind farm area. The<br />
average wave-height is about 1-1.5 m.<br />
The hydrographic conditions in the <strong>Horns</strong> <strong>Rev</strong> area are mainly a result of the intrusion of<br />
Atlantic w<strong>at</strong>er into the southern part of the North Sea. The w<strong>at</strong>er moves err<strong>at</strong>ically towards<br />
the Skagerak. The flow continues north as the Jutl<strong>and</strong> coastal current <strong>and</strong> follows<br />
the Danish west coast towards the Skagerak under the effect of prevailing winds. The tidal<br />
current is mainly in a north south direction with a prevailing current <strong>at</strong> 220º NNE <strong>and</strong> a<br />
mean current speed <strong>at</strong> 0.5-0.7 m/s (Appendix 1). Current speeds above 0.7 m/s up to 1.5<br />
m/s are not unusual <strong>at</strong> <strong>Horns</strong> <strong>Rev</strong> (Bech et al., 2004; Bech et al., 2005; Leonhard & Pedersen,<br />
2004; Leonhard & Pedersen, 2005; Leonhard & Frederiksen, 2005). Str<strong>at</strong>ified flows<br />
do not develop along the North Sea coast, which cause the changing tidal currents <strong>and</strong> the<br />
rough wave environments th<strong>at</strong> favours homogeneous conditions in shallower parts along<br />
the coastline. A strong thermocline is present in the centre of the North Sea. Although<br />
<strong>Horns</strong> <strong>Rev</strong> is situ<strong>at</strong>ed in the transitional zone between the str<strong>at</strong>ified zone <strong>and</strong> the wellmixed<br />
zone, this does not influence the hydrography <strong>at</strong> <strong>Horns</strong> <strong>Rev</strong> as str<strong>at</strong>ified conditions<br />
will not develop <strong>at</strong> w<strong>at</strong>er depth less than 30 m (Danish Hydraulic Institute, 1999). Due to<br />
the mixing of the w<strong>at</strong>er in the coastal zone by turbulent dynamics, oxygen depletion is not<br />
likely to occur <strong>at</strong> <strong>Horns</strong> <strong>Rev</strong>. In rare occasions, oxygen deficiency might develop below<br />
the summer thermocline in deeper parts of the North Sea. Impact to the benthic communities<br />
was observed near the Danish west coast in the summers 1981-1983 (Dyer et al. 1983;<br />
Kröncke <strong>and</strong> Bergfeld, 2001) due to low oxygen levels below the thermocline.<br />
The salinity in the area is 30-34 psu <strong>and</strong> is determined by the inflow of freshw<strong>at</strong>er from<br />
the German rivers <strong>and</strong> the rel<strong>at</strong>ively high-saline w<strong>at</strong>er from the North Sea. Small differences<br />
in salinity of 1– 1.5 psu have infrequently been recorded between the surface <strong>and</strong><br />
bottom layers, especially after long periods of strong southeasterly winds. The differences<br />
recorded between surface <strong>and</strong> bottom layers can better be characterised as a gradient than<br />
a discontinuity (Bio/consult, 2000b).<br />
The area around <strong>Horns</strong> <strong>Rev</strong> is characterised by rel<strong>at</strong>ively high concentr<strong>at</strong>ions of inorganic<br />
nutrients (Figure 1.2). A decline over the last 15 years has been seen for summer concentr<strong>at</strong>ions<br />
in Total Phosphorous (TP). Phosphorus is now the controlling factor for phytoplankton<br />
growth in the area (Hvas et al., 2005). In the spring <strong>and</strong> summer, algae blooms of<br />
foam algae Phaeocystis pouchetii are recorded.<br />
Doc. No. 2572-03-005 rev. 4
<strong>Horns</strong> <strong>Rev</strong>. <strong>Benthic</strong> communities Page 20<br />
100<br />
90<br />
80<br />
70<br />
60<br />
50<br />
40<br />
30<br />
20<br />
10<br />
0<br />
µmol/l Total Nitrogen<br />
1999 2000 2001 2002 2003 2004<br />
3.0<br />
2.5<br />
2.0<br />
1.5<br />
1.0<br />
0.5<br />
0.0<br />
µmol/l Total Phosphorous<br />
1999 2000 2001 2002 2003 2004<br />
Figure 1.2. Dissolved nutrient concentr<strong>at</strong>ions near <strong>Horns</strong> <strong>Rev</strong> (Blåv<strong>and</strong> west) 1999-2004 (NERI, 2006).<br />
Low transparency due to high amounts of re-suspended m<strong>at</strong>erial in the w<strong>at</strong>er column is<br />
characteristic for the <strong>Horns</strong> <strong>Rev</strong> area. High temporal variability is found in the w<strong>at</strong>er<br />
transparency, which is influenced by tidal current, wind induced current, current speed <strong>and</strong><br />
seasonal plankton dynamics. In general, the w<strong>at</strong>er transparency is low in spring, 1.8-6.0 in<br />
adjusted Secchi depth [Adjusted Secchi depth = estim<strong>at</strong>ed Secchi depth x (1+0.4 x wave<br />
height] <strong>and</strong> higher during autumn, 2.5-8.8. Pronounced diel variability in transparency is<br />
found within a few hours <strong>and</strong> is associ<strong>at</strong>ed with changes in the prevailing current directions<br />
from SSW to NNE (Bech et al., 2004; Bech et al., 2005; Leonhard & Pedersen,<br />
2004; Leonhard & Pedersen, 2005).<br />
1.3. <strong>Horns</strong> <strong>Rev</strong> Offshore Wind Farm<br />
<strong>Horns</strong> <strong>Rev</strong> Wind Farm is situ<strong>at</strong>ed south of the actual reef approxim<strong>at</strong>ely 14 km westsouth-west<br />
of Blåv<strong>and</strong>s Huk (Figure 1.3).<br />
a)<br />
b)<br />
524-E<br />
Bird area<br />
No.113<br />
qq qqq qqq qq<br />
q<br />
qq q qqq qqq<br />
qq qq qqq q qqq qqq<br />
qq q qqq qqq<br />
qq q q q q<br />
q<br />
q qq q q q qqq qqq qqq q<br />
q qq qqq qqq qqq<br />
524-D 524-C<br />
524-F<br />
524-B<br />
524-I<br />
524-A<br />
Bird area No.57<br />
q Wind turbines<br />
EU bird <strong>and</strong> habit<strong>at</strong> areas<br />
S<strong>and</strong> <strong>and</strong> gravel extraction areas<br />
Figure 1.3. The offshore wind farm <strong>at</strong> <strong>Horns</strong> <strong>Rev</strong> <strong>and</strong> the cable trace to l<strong>and</strong> <strong>at</strong> Hvidbjerg Str<strong>and</strong>. T marks the<br />
transformer pl<strong>at</strong>form (a). Areas for raw m<strong>at</strong>erial extraction <strong>and</strong> intern<strong>at</strong>ional protected bird <strong>and</strong><br />
habit<strong>at</strong> areas (b).<br />
The coordin<strong>at</strong>es of the outermost wind turbines <strong>and</strong> the transformer st<strong>at</strong>ion are shown in<br />
Appendix 1.<br />
1.3.1. <strong>Con</strong>struction <strong>and</strong> layout<br />
The offshore wind farm is comprised of 80 (Vestas V80- 2MV) wind turbines erected in a<br />
grid p<strong>at</strong>tern as shown in Figure 1.3. Thus, the total installed energy gener<strong>at</strong>ing capacity is<br />
160 MW. The distance between the individual wind turbines <strong>and</strong> rows is 560 m with the<br />
Doc. No. 2572-03-005 rev. 4
<strong>Horns</strong> <strong>Rev</strong>. <strong>Benthic</strong> communities Page 21<br />
wind farm covering an area of 27.5 km 2 including a 200 m exclusion zone around the<br />
wind farm.<br />
The wind turbines are interconnected via a 36 kV cable grid th<strong>at</strong> is connected to a transformer<br />
pl<strong>at</strong>form in the northeastern corner of the wind farm. The transformer pl<strong>at</strong>form is<br />
connected to l<strong>and</strong> <strong>at</strong> Hvidbjerg Str<strong>and</strong> by a 150 kV cable. The cable is embedded into the<br />
seabed by w<strong>at</strong>er-jetting. The cable trace passes through an intern<strong>at</strong>ionally protection area<br />
<strong>and</strong> is 19.5 km long.<br />
The wind turbine (WTG) found<strong>at</strong>ions are constructed using the “monopile” concept. The<br />
monopile found<strong>at</strong>ion consists of two main components; the pile <strong>and</strong> the transition piece.<br />
The pile is a steel pipe th<strong>at</strong> is rammed into the seabed. The transition piece is also a steel<br />
pipe but with a slightly larger diameter than the pile. Pile <strong>and</strong> transition piece are joined<br />
together over a stretch of 6 metres. For the <strong>Horns</strong> <strong>Rev</strong> project, the monopile diameter is 4<br />
m. The pile is driven to a depth of up to approx 25 m. The joint between the turbine <strong>and</strong><br />
the found<strong>at</strong>ion is placed 9 m above mean sea level (MSL). At this level, a pl<strong>at</strong>form is<br />
placed <strong>and</strong> the wind turbine tower mounted. The main geometry of the wind turbines is<br />
shown in Figure 1.4.<br />
Figure 1.4. Wind turbine dimensions.<br />
On the seabed <strong>at</strong> <strong>Horns</strong> <strong>Rev</strong>, scour protection was necessary around the found<strong>at</strong>ions to<br />
minimise erosion due to the strong current <strong>at</strong> the site (Figure 1.5). The scour protection<br />
has a total diameter of approxim<strong>at</strong>ely 25 m, but it varies between sites. The scour protection<br />
is approxim<strong>at</strong>ely 1.3 m in height above the original seabed <strong>and</strong> consists of a protective<br />
stone m<strong>at</strong>tress, 0.8 m in thickness, of large stones up to 55 cm in diameter <strong>at</strong> distances<br />
of 0–10 m from the towers with a subjacent layer, 0.5m in thickness, of smaller stones 3-<br />
20 cm in diameter. At the edge of the large protective stones area, there is an area up to 4<br />
Doc. No. 2572-03-005 rev. 4
<strong>Horns</strong> <strong>Rev</strong>. <strong>Benthic</strong> communities Page 22<br />
m in width consisting of smaller stones. A r<strong>at</strong>her gre<strong>at</strong> variability in the b<strong>and</strong> size with<br />
large stones between <strong>and</strong> <strong>at</strong> turb<br />
ine sites exists with large stones being found up to 12-14 metres from the monopiles.<br />
Photo 2. <strong>Horns</strong> <strong>Rev</strong> offshore wind farm under construction.<br />
Figure 1.5. Wind turbine found<strong>at</strong>ion <strong>and</strong> scour protection.<br />
Photo 3. <strong>Horns</strong> <strong>Rev</strong> offshore wind farm.<br />
The turbine found<strong>at</strong>ions, including the scour protection, cover approxim<strong>at</strong>ely 39.500 m 2 of<br />
the seabed, which is less than 0.2% of the total area of the wind farm.<br />
The assembly of the wind turbines started in March, 2002 with the last turbine set in place<br />
on August 21 st , 2002.<br />
1.3.2. Design<strong>at</strong>ed areas<br />
Rel<strong>at</strong>ively close to the wind farm area (5 nautical miles) are larger areas th<strong>at</strong> are design<strong>at</strong>ed<br />
for raw m<strong>at</strong>erial extraction. There has been a decline in the extraction of raw m<strong>at</strong>erials<br />
over the last few years, but the areas as such are not expected to be affected by the construction<br />
of the offshore wind farm (Rambøll, 1999). North of the wind farm area is a<br />
military exercise area. Ramsar <strong>and</strong> EU bird <strong>and</strong> habit<strong>at</strong> protected areas are situ<strong>at</strong>ed in the<br />
Doc. No. 2572-03-005 rev. 4
<strong>Horns</strong> <strong>Rev</strong>. <strong>Benthic</strong> communities Page 23<br />
vicinity of the <strong>Horns</strong> <strong>Rev</strong> Offshore Wind Farm (Figure 1.3). The Wadden Sea <strong>and</strong><br />
neighbouring l<strong>and</strong> areas constitute Ramsar area no. 27. These areas are also design<strong>at</strong>ed as<br />
Special Protection Areas under the EU Birds Directive (nos. 49, 50, 51, 52, 53, 55, 57, 60,<br />
65 <strong>and</strong> 67) <strong>and</strong> as Special Areas for <strong>Con</strong>serv<strong>at</strong>ion under the EU Habit<strong>at</strong>s Directive (nos.<br />
73, 78 <strong>and</strong> 90). Furthermore, the Wadden Sea also has the st<strong>at</strong>us of a Game Reserve (no.<br />
48) with regul<strong>at</strong>ions concerning n<strong>at</strong>ure conserv<strong>at</strong>ion <strong>and</strong> public access. The offshore wind<br />
farm <strong>and</strong> the cable trace to l<strong>and</strong> are included in the following intern<strong>at</strong>ional protections:<br />
EU-Bird Directive nos. 53, 55 <strong>and</strong> 57, EU-Habit<strong>at</strong> Directive area no. 78 <strong>and</strong> Ramsar area<br />
R 27.<br />
1.4. <strong>Benthic</strong> communities <strong>at</strong> <strong>Horns</strong> <strong>Rev</strong><br />
1.4.1. <strong>Benthic</strong> veget<strong>at</strong>ion<br />
Because the main substr<strong>at</strong>e in the area is s<strong>and</strong>, no n<strong>at</strong>ive rooted benthic veget<strong>at</strong>ion or loose<br />
or <strong>at</strong>tached macro algae has been recorded west of Blåv<strong>and</strong>s Huk (Leonhard, 2000).<br />
1.4.2. <strong>Benthic</strong> fauna<br />
An extensive amount of general liter<strong>at</strong>ure exists on benthos surveys covering the North<br />
Sea (Kröncke & Bergfeld, 2001). The d<strong>at</strong>a sets from the DANA cruises 1932–1955 (Ursin,<br />
1960; Kirkegaard, 1969; Petersen 1977) <strong>and</strong> the results of Birkett’s (Birkett, 1953)<br />
survey are valuable historical baselines of the community structure of North Sea benthos<br />
but very little d<strong>at</strong>a is available from more regional shallow s<strong>and</strong>bank areas such as <strong>Horns</strong><br />
<strong>Rev</strong>.<br />
1.4.3. Popul<strong>at</strong>ion ecology <strong>and</strong> distribution <strong>at</strong> <strong>Horns</strong> <strong>Rev</strong><br />
The n<strong>at</strong>ive fauna composition <strong>at</strong> <strong>Horns</strong> <strong>Rev</strong> is like the fauna found on other sublittoral<br />
s<strong>and</strong>banks in the North Sea. Like the fauna <strong>at</strong> other sublittoral s<strong>and</strong>banks in the North Sea,<br />
the fauna <strong>at</strong> <strong>Horns</strong> <strong>Rev</strong> is very variable, heterogeneous <strong>and</strong> difficult to compare with other<br />
s<strong>and</strong>banks <strong>and</strong> adjoining deeper areas (Vanosmael et al. 1982; Salzwedel et al. 1985; Degraer<br />
et al. 1999). The benthos community <strong>at</strong> <strong>Horns</strong> <strong>Rev</strong> has a gre<strong>at</strong> similarity with the<br />
benthos communities described in other shallow coastal w<strong>at</strong>ers of the North Sea where the<br />
sediment consists of pure medium–coarse s<strong>and</strong>. The community in such areas can be described<br />
as the Ophelia borealis community (Dewarumez et al. 1992) or, more commonly<br />
accepted, as the Goniadella-Spisula community (Kingston & Rachor 1982; Salzwedel <strong>at</strong><br />
al. 1985).<br />
In the Goniadella-Spisula community, some characteristic species are found including the<br />
bristle worms (Gooniadella bobretzkii <strong>and</strong> Ophelia borealis) <strong>and</strong> the thick trough shell<br />
(Spisula solida). The two last mentioned species are important for the biomass in the<br />
community mainly due to their rel<strong>at</strong>ively large size.<br />
At <strong>Horns</strong> <strong>Rev</strong>, more than 75 different species of marine bottom fauna species were recorded<br />
during the baseline surveys in 1999 <strong>and</strong> 2001 (Appendix 2) (Leonhard, 2000;<br />
Leonhard, 2001). The above-mentioned species together with some other species like bristle<br />
worms (Pisione remota <strong>and</strong> Orbinia sertul<strong>at</strong>a) <strong>and</strong> the small mussel (Goodallia triangularis)<br />
was found in rel<strong>at</strong>ively uniform in abundance <strong>and</strong> biomass dominance rel<strong>at</strong>ions.<br />
These species were used as indic<strong>at</strong>or organisms for environmental changes in the wind<br />
farm area (Leonhard <strong>and</strong> Pedersen, 2002).<br />
Doc. No. 2572-03-005 rev. 4
<strong>Horns</strong> <strong>Rev</strong>. <strong>Benthic</strong> communities Page 24<br />
Table 1.1. Abundance rel<strong>at</strong>ions of the most dominant species found in the wind farm area from the 1999<br />
<strong>and</strong> 2001 baseline surveys.<br />
1999<br />
2001<br />
Abundance, number/m²<br />
Spring<br />
Spring Autumn<br />
Species Group Mean Rel<strong>at</strong>ive % Mean Rel<strong>at</strong>ive % Mean Rel<strong>at</strong>ive %<br />
Pisione remota Bristle worm 142.3 20.3 176.2 18.8 411.0 22.0<br />
Goodallia triangularis Bivalve 262.2 37.5 153.6 16.4 203.3 10.9<br />
Goniadella bobretzkii Bristle worm 113.8 16.3 128.7 13.8 189.7 10.1<br />
Ophelia borealis Bristle worm 28.5 4.1 47.4 5.1 72.3 3.9<br />
Spisula solida Bivalve 2.0 0.3 31.6 3.4 36.1 1.9<br />
Orbinia sertul<strong>at</strong>a Bristle worm 12.2 1.7 24.8 2.7 0.0 0.0<br />
The dominant species in Tables 1.1 –<strong>and</strong> 1.2 constitute 49-80% of the total abundance <strong>and</strong><br />
26-80% of the total biomass found in the wind farm area.<br />
Table 1.2. Biomass rel<strong>at</strong>ions (WW) rel<strong>at</strong>ions of the most dominant species found in the wind farm area<br />
from the 1999 <strong>and</strong> 2001 baseline surveys.<br />
1999 2001<br />
Biomass, wet weight g/m² Spring<br />
Spring<br />
Autumn<br />
Species Group Mean Rel<strong>at</strong>ive % Mean Rel<strong>at</strong>ive % Mean Rel<strong>at</strong>ive %<br />
Spisula solida Bivalve 15.413 7.3 42.1 64.7 231.883 77.4<br />
Ophelia borealis Bristle worm 27.560 13.0 6.5 10.0 7.405 2.5<br />
Goodallia triangularis Bivalve 0.904 0.4 0.4 0.6 0.542 0.2<br />
Goniadella bobretzkii Bivalve 0.245 0.1 0.1 0.1 0.184 0.1<br />
Pisione remota Bristle worm 0.174 0.1 0.0 0.0 0.035 0.0<br />
Orbinia sertul<strong>at</strong>a Bristle worm 1.415 4.9 2.8 4.3 0.000 0.0<br />
Significant differences were found in temporal <strong>and</strong> sp<strong>at</strong>ial distribution due to n<strong>at</strong>ural<br />
vari<strong>at</strong>ions in popul<strong>at</strong>ions with respect to reproduction <strong>and</strong> increase in body masses (Figures<br />
1.6 <strong>and</strong> 1.7) (Leonhard <strong>and</strong> Pedersen, 2002). Although, no general differences in<br />
community structure was found with respect to seasonal vari<strong>at</strong>ion (Leonhard <strong>and</strong> Pedersen,<br />
2002).<br />
a)<br />
LN(Abundance)<br />
10<br />
9<br />
8<br />
7<br />
6<br />
5<br />
N =<br />
<strong>Horns</strong> <strong>Rev</strong>, Wind Farm area 2001<br />
St<strong>at</strong>ion<br />
31<br />
34<br />
6<br />
Mill51<br />
6 6 6 6<br />
6<br />
6<br />
6 6<br />
Mill55<br />
Mill58<br />
Mill26<br />
Mill73<br />
Mill95<br />
4<br />
53<br />
Campaign<br />
Spring 2001<br />
Autumn 2001<br />
b)<br />
LN(Biomass, WW)<br />
16<br />
14<br />
12<br />
10<br />
8<br />
6<br />
N =<br />
<strong>Horns</strong> <strong>Rev</strong>, Wind Farm area 2001<br />
St<strong>at</strong>ion<br />
6<br />
Mill51<br />
6 6 6 6<br />
6<br />
6<br />
6 6<br />
Mill55<br />
Mill58<br />
Mill26<br />
Mill73<br />
Mill95<br />
Figure 1.6. Levels of abundance <strong>and</strong> biomass between surveys in June <strong>and</strong> September 2001.<br />
As <strong>at</strong> other s<strong>and</strong>banks, <strong>Horns</strong> <strong>Rev</strong> has similar sea bottom turbulent conditions <strong>and</strong> low organic<br />
content in the sediment. The benthic community <strong>at</strong> <strong>Horns</strong> <strong>Rev</strong> is generally characterised<br />
by lower diversity, abundance <strong>and</strong> biomass compared to adjacent areas where the<br />
bottom conditions are less unstable <strong>and</strong> the sediment has a higher content of fine s<strong>and</strong> <strong>and</strong><br />
organic m<strong>at</strong>erial (Leonhard, 2000). In comparison, the number of mussels th<strong>at</strong> are important<br />
food items for diving ducks, such as the common scoter (Melanitta nigra), are far<br />
21<br />
24<br />
14<br />
17<br />
11<br />
Campaign<br />
Spring 2001<br />
Autumn 2001<br />
Doc. No. 2572-03-005 rev. 4
<strong>Horns</strong> <strong>Rev</strong>. <strong>Benthic</strong> communities Page 25<br />
lower in the <strong>Horns</strong> <strong>Rev</strong> area than in nearby areas of the North Sea where higher abundances<br />
of Angulus tenuis, Fabulina fabula <strong>and</strong> Spisula subtrunc<strong>at</strong>a have been found (Degraer<br />
et. al., 1999). In adjacent areas <strong>and</strong> along the cable line, a Fabulina fabula or Venus<br />
community was found. This community is characterised by the Venus clam (Chamelea<br />
gallina), the sea pot<strong>at</strong>o (Echinocardium cord<strong>at</strong>um), the bristle worm (Magelona mirabilis)<br />
<strong>and</strong> the brittle star (Ophiura textur<strong>at</strong>a). In the intern<strong>at</strong>ional protected area close to shore,<br />
the sediment is finer <strong>and</strong> the area can be characterised as a Lanice conchilega community<br />
named after the s<strong>and</strong> mason (a bristle worm) (Govaere et al., 1980).<br />
The bivalves (Spisula solida, Spisula subtrunc<strong>at</strong>a <strong>and</strong> Angulus tenuis) are included in the<br />
Red List of Wadden Sea species. In areas outside Denmark, they are either sensitive or<br />
vulnerable (Petersen et al. 1996). There is no mention of the st<strong>at</strong>us in Denmark for these<br />
species.<br />
q Wind turbines<br />
q Wind turbines<br />
6<br />
4<br />
MUNK<br />
q q q q q q q q q q<br />
q q q q q q q q q q<br />
q q q q q q q q q q<br />
q q q q q q q q q q<br />
q q q q q q q q q q<br />
q q q q q q q q q q<br />
q q q q q q q q q q<br />
q q q q q q q q q q<br />
6<br />
10<br />
6<br />
MUNK<br />
q q q q q q q q q q<br />
q q q q q q q q q q<br />
q q q q q q q q q q<br />
q q q q q q q q q q<br />
q q q q q q q q q q<br />
q q q q q q q q q q<br />
q q q q q q q q q q<br />
q q q q q q q q q q<br />
6<br />
10<br />
6<br />
4<br />
6<br />
2<br />
2<br />
Goodallia triangularis, 1999<br />
Individuals/m²<br />
0<br />
200<br />
400<br />
1000<br />
1400<br />
6<br />
10<br />
6<br />
10<br />
Goniadella bobretzkii, 1999<br />
Individuals/m²<br />
0<br />
50<br />
100<br />
200<br />
370<br />
6<br />
10<br />
6<br />
10<br />
q Wind turbines<br />
6<br />
4<br />
MUNK<br />
q q q q q q q q q q<br />
q q q q q q q q q q<br />
q q q q q q q q q q<br />
q q q q q q q q q q<br />
q q q q q q q q q q<br />
q q q q q q q q q q<br />
q q q q q q q q q q<br />
q q q q q q q q q q<br />
6<br />
10<br />
Ophelia borealis<br />
6<br />
2<br />
Ophelia borealis, 1999<br />
Individuals/m²<br />
Figure 1.7. Distribution p<strong>at</strong>tern of some of the most abundant species in the wind farm area <strong>at</strong> <strong>Horns</strong> <strong>Rev</strong>,<br />
1999.<br />
Mobile epifauna is often found in the area, which contributes to a high biomass. The hermit<br />
crab (Pagurus bernhardus), the common shore crab (Carcinus maenas), swimming<br />
crabs (Liocarcinus pusillus, L. hols<strong>at</strong>us <strong>and</strong> L. depur<strong>at</strong>or), the common whelk (Buccinum<br />
und<strong>at</strong>um), brown shrimp (Crangon crangon), the common starfish (Asterias rubens), the<br />
0<br />
50<br />
100<br />
150<br />
250<br />
Doc. No. 2572-03-005 rev. 4<br />
6<br />
10<br />
6<br />
10
<strong>Horns</strong> <strong>Rev</strong>. <strong>Benthic</strong> communities Page 26<br />
Alder’s necklace shell (Polinices polianus) <strong>and</strong> occasionally the edible crab (Cancer<br />
pagurus) are found on the s<strong>and</strong> seabed.<br />
The brown shrimp, which often is observed in numbers in the wind farm area, is an important<br />
prey species for both sea birds <strong>and</strong> fish (Hoffmann et al., 2000).<br />
Photo 4. Hermit crab Pagurus bernhardus. Photo 5. Brown shrimp Crangon crangon.<br />
1.5. Scope of investig<strong>at</strong>ions<br />
1.5.1. Possible <strong>and</strong> expected effects on benthic communities<br />
The possible impact of an offshore wind farm can be divided into impacts during the construction<br />
<strong>and</strong> impacts during the oper<strong>at</strong>ion. In the following, the different types of potential<br />
impacts are outlined in the Environmental Impact Assessments th<strong>at</strong> were carried out in<br />
connection with the wind farm <strong>at</strong> <strong>Horns</strong> <strong>Rev</strong>.<br />
Potential impacts during construction<br />
1. Loss of existing habit<strong>at</strong>s<br />
2. Sediment spills <strong>and</strong> increased turbidity<br />
3. Noise<br />
4. Disturbances due to construction activities<br />
Potential impacts during oper<strong>at</strong>ion<br />
1. Noise <strong>and</strong> vibr<strong>at</strong>ions from the turbines<br />
2. Electromagnetic fields<br />
3. The physical presence of the turbines<br />
4. Disturbance due to maintenance oper<strong>at</strong>ions<br />
5. Introduction of hard substr<strong>at</strong>e from the scour protection areas around the found<strong>at</strong>ions<br />
Of the different types of impacts listed above, the possible <strong>and</strong> expected impacts on benthic<br />
communities are described below. Impacts from noise, disturbances due to construction<br />
activities, noise <strong>and</strong> vibr<strong>at</strong>ions from the turbines, electromagnetic fields <strong>and</strong> disturbances<br />
due to maintenance oper<strong>at</strong>ions on the benthic communities are considered as negligible<br />
or non-detectable.<br />
Doc. No. 2572-03-005 rev. 4
<strong>Horns</strong> <strong>Rev</strong>. <strong>Benthic</strong> communities Page 27<br />
1.5.1.1. Loss of existing habit<strong>at</strong>s<br />
The total seabed affected for establishing the wind turbines <strong>and</strong> transformer pl<strong>at</strong>form<br />
found<strong>at</strong>ions including the scour protections is less than 0.2% of the total area of the wind<br />
farm. The benthic habit<strong>at</strong> <strong>and</strong> the n<strong>at</strong>ive infauna community in this area will be permanently<br />
lost <strong>and</strong> replaced by fouling communities associ<strong>at</strong>ed with hard bottom structures.<br />
Temporal impacts <strong>and</strong> partial destruction of benthic fauna along the cable line will occur.<br />
Only a very small part of the seabed will be temporally affected <strong>and</strong> the impact is therefore<br />
considered negligible.<br />
1.5.1.2. Sediment spills <strong>and</strong> increased turbidity<br />
The construction method using the monopile concept will not result in sediment spills during<br />
construction.<br />
Cable jetting activities in the construction phase will result only in limited release of<br />
sediment <strong>and</strong> spill with temporarily increased turbidity of the w<strong>at</strong>er. Closer to l<strong>and</strong> the<br />
sediment has a higher content of finer particles than within the wind farm area. The increase<br />
in turbidity due to spill will be higher closer to l<strong>and</strong> compared to within the wind<br />
farm area where the sediment is coarser (Elsam, 2000). Due to rel<strong>at</strong>ively high baseline<br />
concentr<strong>at</strong>ions of suspended m<strong>at</strong>erials, 50 mg/l in the most sensitive areas close to l<strong>and</strong>, a<br />
slight increase in turbidity during the jetting activities will only result in negligible impacts<br />
on benthic communities (Elsam, 2000). Modelling of different plume dispersion<br />
scenarios for cable jetting has not been considered. But, a worst-case spill scenario for<br />
gravit<strong>at</strong>ion found<strong>at</strong>ions showed very local <strong>and</strong> short-term impact of increased turbidity,<br />
more than 2 mg/l, <strong>and</strong> a total accumul<strong>at</strong>ion of spilled sediment not exceeding 2 kg/m 2 .<br />
This is much lower than the n<strong>at</strong>ural vari<strong>at</strong>ion in the reorganis<strong>at</strong>ion <strong>and</strong> accumul<strong>at</strong>ion of resuspended<br />
sediment in the area (Elsam, 2000).<br />
In conclusion, only negligible impact to the benthic communities from sediment spill is<br />
likely to occur.<br />
1.5.1.3. Physical presence of the wind turbines<br />
The wind turbines are large structures th<strong>at</strong> will change the physical characteristics of the<br />
area markedly. Impacts to the benthic communities from the physical presence of the wind<br />
turbines, apart from effects of the introduction of hard substr<strong>at</strong>e habit<strong>at</strong>s, will only effect<br />
changes in the general current regimes within the wind farm area <strong>and</strong> changes in the local<br />
current regimes close to the wind turbine found<strong>at</strong>ions.<br />
The presence of the wind turbines will cause a reduction in the current velocities inside the<br />
wind farm area by a maximum of 2%. There are no expected evolutions in the general<br />
seabed characteristics <strong>and</strong> associ<strong>at</strong>ed benthic communities (Elsam, 2000).<br />
Close to the wind turbine found<strong>at</strong>ions, changes in seabed <strong>and</strong> associ<strong>at</strong>ed benthic communities<br />
might be caused by current turbulence. Modelling shows th<strong>at</strong> changes in current velocities<br />
will be less than 15% within 5 metres from the monopile found<strong>at</strong>ion (Figure 1.7)<br />
(Elsam, 2000).<br />
Doc. No. 2572-03-005 rev. 4
<strong>Horns</strong> <strong>Rev</strong>. <strong>Benthic</strong> communities Page 28<br />
Figure 1.7. Ocean current turbulence around a monopile<br />
found<strong>at</strong>ion.<br />
Photo 6. <strong>Horns</strong> <strong>Rev</strong> offshore wind farm under construction.<br />
1.5.1.4. Introduction of hard substr<strong>at</strong>e habit<strong>at</strong>s<br />
As a secondary aspect of establishing offshore wind farms, sub-surface sections of turbine<br />
towers <strong>and</strong> the scour protections will introduce new types of sub-littoral structures <strong>and</strong> increase<br />
the heterogeneity in the area. The introduced habit<strong>at</strong>s will be suitable for colonis<strong>at</strong>ion<br />
by a variety of marine invertebr<strong>at</strong>es <strong>and</strong> <strong>at</strong>tached algae. The hard bottom structures<br />
may act both individually <strong>and</strong> collectively as an artificial reef.<br />
Structural complexity appears to be a condition for many productive <strong>and</strong> complex environments<br />
such as coral reefs, mangroves <strong>and</strong> sea grass meadows. These environments are<br />
productive, not only because they have a gre<strong>at</strong> turnover, but also because they offer a high<br />
degree of substr<strong>at</strong>e complexity <strong>and</strong> an extensive spectrum of niche sizes, which are advantageous<br />
for young <strong>and</strong> juvenile organisms. The size, diversity <strong>and</strong> density of organisms on<br />
<strong>and</strong> in an artificial reef are conditional on the number <strong>and</strong> size of niches, but not necessarily<br />
on the presence of food. Algal growth on the reef contributes further to increased heterogeneity.<br />
The hard substr<strong>at</strong>e may increase the opportunities for epifauna to settle <strong>and</strong> may provide a<br />
substr<strong>at</strong>e th<strong>at</strong> is more <strong>at</strong>tractive to mobile fauna than the previous ‘pre-wind farm seabed.’<br />
The establishment of epifauna <strong>and</strong> flora on the hard substr<strong>at</strong>es will increase the food available<br />
to fish, which again will lead to an increase in the food available to marine mammals<br />
<strong>and</strong> birds.<br />
The presence of the deployed artificial hard substr<strong>at</strong>e structures will lead to colonis<strong>at</strong>ion<br />
by many epibenthic organisms, which have not been in the area previously because of a<br />
lack of suitable habit<strong>at</strong>. Predictions of various qualit<strong>at</strong>ive or quantit<strong>at</strong>ive scenarios for<br />
fouling successions are highly dependable on the surrounding environment, the interaction<br />
between the different species of the fouling community <strong>and</strong> the pred<strong>at</strong>ion or grazing on the<br />
fouling community by pred<strong>at</strong>ory or herbivorous species like the common star fish, sea urchins,<br />
snails, birds <strong>and</strong> others. <strong>Con</strong>sequently no unambiguous forecast can be made about<br />
species composition <strong>and</strong> community structures in the introduced hard bottom benthic<br />
communities <strong>at</strong> <strong>Horns</strong> <strong>Rev</strong>.<br />
Colonis<strong>at</strong>ion of the deployed substr<strong>at</strong>es will be a combin<strong>at</strong>ion of migr<strong>at</strong>ion from the surrounding<br />
substr<strong>at</strong>e <strong>and</strong> settling of larvae or sp<strong>at</strong>. The recruitment will be governed by the<br />
sea currents carrying the larvae <strong>and</strong> sp<strong>at</strong> to the found<strong>at</strong>ion <strong>and</strong> by the loc<strong>at</strong>ion of the foun-<br />
Doc. No. 2572-03-005 rev. 4
<strong>Horns</strong> <strong>Rev</strong>. <strong>Benthic</strong> communities Page 29<br />
d<strong>at</strong>ion with respect to depth, distance from recruitment source, etc. The recruitment will<br />
also be dependent on the type <strong>and</strong> heterogeneity of the found<strong>at</strong>ion, which will always be<br />
seasonal in Danish w<strong>at</strong>ers.<br />
The first species to colonize the found<strong>at</strong>ions will be algae <strong>and</strong> invertebr<strong>at</strong>es. The colonis<strong>at</strong>ion<br />
will often have a characteristic succession, starting with di<strong>at</strong>oms <strong>and</strong> filamentous algae,<br />
followed by barnacles <strong>and</strong> thereafter by a more diverse community (Falace & Bressan,<br />
2000). The qualit<strong>at</strong>ive <strong>and</strong> quantit<strong>at</strong>ive composition of the fouling community will<br />
further vary with the w<strong>at</strong>er depth. There will be differences in the composition of the fouling<br />
community <strong>at</strong> particular depths on the monopiles <strong>and</strong> the scour protections.<br />
The wind farm area <strong>at</strong> <strong>Horns</strong> <strong>Rev</strong> <strong>and</strong> its introduced hard bottom structures might also<br />
function as a sanctuary area for more species included in the Red List for thre<strong>at</strong>ened or<br />
vulnerable Wadden Sea species like the ross worm (Sabellaria spinulosa) (Nielsen et al.<br />
1996; Petersen et al. 1996). Although more common on hard bottom structures Sabellaria<br />
spinulosa can form compact reef-like popul<strong>at</strong>ions on mixed sediments including shells<br />
(Jones et al., 2000). <strong>After</strong> a heavy decline th<strong>at</strong> started in the 1920s, it has again been seen<br />
in increasing numbers in parts of the Wadden Sea area (Nehring, 1999). Sabellaria reefs<br />
have not been recorded in the Danish part of the Wadden Sea (Nehring, 1999).<br />
The biomass produced on the introduced hard bottom structures might be many times<br />
gre<strong>at</strong>er than biomass production by the n<strong>at</strong>ive benthic community <strong>at</strong> <strong>Horns</strong> <strong>Rev</strong>, mainly<br />
due to habit<strong>at</strong>s suitable for colonis<strong>at</strong>ion of the common mussel (Mytilus edulis).<br />
A preliminary study of the development of fouling communities on a meteorological<br />
measuring mast <strong>at</strong> <strong>Horns</strong> <strong>Rev</strong> in 1999 showed an established community of algae <strong>and</strong> invertebr<strong>at</strong>es<br />
5 months after deployment (Bio/consult, 2001). The fouling community consisted<br />
of a thick moss-like layer of di<strong>at</strong>oms, small filamentous algae, barnacles (Balanus<br />
sp.), colonies of bryozoans (Bryozoa indet.), sea anemones (Urticina felina, Actinariidae<br />
indet.), sea-squirts (Ascidiacea indet.), common star fish (Asterias rubens), the keelworm<br />
(Pom<strong>at</strong>oceros triqueter) <strong>and</strong> few common mussels (Mytilus edulis) with lengths up to 4<br />
cm. The preliminary study also showed th<strong>at</strong> the current <strong>and</strong> the near-bottom transport of<br />
s<strong>and</strong> apparently limited the fouling community. S<strong>and</strong> scouring is so extreme in the area<br />
th<strong>at</strong> the lowest areas of the found<strong>at</strong>ion were devoid of a fouling community.<br />
The impact from current, wave action <strong>and</strong> s<strong>and</strong> scouring might extend to the whole length<br />
of the found<strong>at</strong>ion in connection with storms. This was confirmed by the findings of a l<strong>at</strong>er<br />
study to measure mast following the storm from December 3 rd , 1999. The only signs left<br />
of a fouling community were the calcium traces from the previously <strong>at</strong>tached barnacles.<br />
Pred<strong>at</strong>ion from the common starfish Asterias rubens might also result in a total disruption<br />
of <strong>at</strong>tached potential prey from the mast surface. It was noted th<strong>at</strong> the fouling communities<br />
on the found<strong>at</strong>ions might be very vulnerable on vertical structures without any scour protections.<br />
1.5.2. Criterion<br />
The main objective of the monitoring programme was to detect if any major changes in<br />
the overall community structure <strong>and</strong> species composition in the infauna community were<br />
introduced by the introduction of hard bottom substr<strong>at</strong>es <strong>at</strong> <strong>Horns</strong> <strong>Rev</strong>. This objective was<br />
in compliance with the preliminary requirements set by the n<strong>at</strong>ional authorities but no spe-<br />
Doc. No. 2572-03-005 rev. 4
<strong>Horns</strong> <strong>Rev</strong>. <strong>Benthic</strong> communities Page 30<br />
cific legisl<strong>at</strong>ive environmental criteria have been established for the impact on infauna<br />
communities in rel<strong>at</strong>ion to the construction of wind farms.<br />
1.5.3. Hypotheses regarding effects<br />
The principal hypotheses regarding effects from the introduction of the hard bottom substr<strong>at</strong>e<br />
habit<strong>at</strong>s to be tested are:<br />
- there is no sp<strong>at</strong>ial vari<strong>at</strong>ion in the fouling community between the individual<br />
found<strong>at</strong>ions <strong>at</strong> any given depth,<br />
- there is no vari<strong>at</strong>ion in the fouling community between found<strong>at</strong>ions <strong>at</strong> different<br />
depths,<br />
- there is no hydrodynamic effect on the fouling community or the benthic infauna<br />
community from the monopile or the turbine found<strong>at</strong>ions,<br />
- there is no major change in the infaunal community structure or infauna species<br />
composition,<br />
- there is no edge effect rel<strong>at</strong>ed to the wind turbine sites within the wind farm,<br />
<strong>and</strong><br />
- there is no depth dependence zoning in the fouling community on the monopiles.<br />
Photo 7. C<strong>at</strong>ch of mobile epifauna species. Photo 8. Shells of Ensis americanus <strong>and</strong> tentacle<br />
fans of the s<strong>and</strong> mason Lanice conchilega.<br />
Doc. No. 2572-03-005 rev. 4
<strong>Horns</strong> <strong>Rev</strong>. <strong>Benthic</strong> communities Page 31<br />
2. Methods<br />
Based on the results from the EIA screening survey in 1999 (Leonhard, 2000), an environmental<br />
monitoring programme for the assessment of impact from construction <strong>and</strong> oper<strong>at</strong>ion<br />
activities on marine benthos was established (Leonhard, 2003). The methodology<br />
<strong>and</strong> the extend of the sampling programme was adjusted to comply with the hypotheses<br />
<strong>and</strong> the objectives of detecting only major changes in the overall benthic community structure<br />
<strong>and</strong> of monitoring the introduced hard bottom communities.<br />
For infauna <strong>and</strong> hard bottom surveys, we<strong>at</strong>her, wind conditions <strong>and</strong> hydrographical d<strong>at</strong>a<br />
such as current direction, approxim<strong>at</strong>e current speed, wave height <strong>and</strong> transparency were<br />
recorded <strong>at</strong> each sampling site. The Secchi depth was measured by lowering a white Secchi<br />
disc (diameter = 30 cm) several times until the disc became invisible. The estim<strong>at</strong>ed<br />
Secchi depth was adjusted for wave height according to Danish St<strong>and</strong>ard DS 293.<br />
Adjusted Secchi depth = estim<strong>at</strong>ed Secchi depth X (1+ 0.4 x wave height).<br />
2.1. Infauna<br />
Baseline surveys were conducted in June <strong>and</strong> September 2001. In June 2001, samples<br />
were collected from a total of 18 st<strong>at</strong>ions <strong>at</strong> 6 wind turbine loc<strong>at</strong>ions in the wind farm area<br />
(Figure 2.1). The 6 wind turbine loc<strong>at</strong>ions are in areas where the depth is less than 10 metres<br />
<strong>and</strong> thus a represent<strong>at</strong>ive sample of the entire wind turbine area. In September 2001,<br />
samples were collected from 9 st<strong>at</strong>ions <strong>at</strong> 3 wind turbine loc<strong>at</strong>ions (55, 58 <strong>and</strong> 95) <strong>and</strong> <strong>at</strong> 5<br />
st<strong>at</strong>ions in a design<strong>at</strong>ed reference area supposed to be used in a s<strong>and</strong>eel monitoring programme.<br />
a)<br />
q Wind mills Elsam<br />
q Study areas<br />
Sampling of st<strong>at</strong>ions in the wind farm area<br />
q51<br />
q1<br />
q11<br />
q21<br />
q31<br />
q41<br />
q<br />
51 q61<br />
q71<br />
q81<br />
q91<br />
q2<br />
q12<br />
q22<br />
q32<br />
q42<br />
q52<br />
q62<br />
q72<br />
q82<br />
q92<br />
q3<br />
q13<br />
q23<br />
q33<br />
q43<br />
q53<br />
q63<br />
q<br />
73 q83<br />
q93<br />
q73<br />
q4<br />
q14<br />
q24<br />
q34<br />
q44<br />
q54<br />
q64<br />
q74<br />
q84<br />
q94<br />
q5<br />
q15<br />
q25<br />
q35<br />
q45<br />
q<br />
55 q65<br />
q75<br />
q85<br />
q<br />
95<br />
q95<br />
q6<br />
q16<br />
q<br />
26 q36<br />
q46<br />
q56<br />
q66<br />
q76<br />
q86<br />
q96<br />
q26<br />
q7<br />
q17<br />
q27<br />
q37<br />
q47<br />
q57<br />
q67<br />
q77<br />
q87<br />
q97<br />
q8<br />
q18<br />
q28<br />
q38<br />
q48<br />
q<br />
58 q68<br />
q78<br />
q88<br />
q98<br />
q55<br />
q58<br />
b)<br />
q Wind mills Elsam<br />
q Study areas<br />
Reference area<br />
Sampling of st<strong>at</strong>ions in the reference area<br />
Sampling of st<strong>at</strong>ions in the wind farm area<br />
1<br />
2<br />
4<br />
3<br />
5<br />
q1<br />
q11<br />
q21<br />
q31<br />
q41<br />
q q51<br />
q61<br />
q71<br />
q81<br />
q91<br />
q2<br />
q12<br />
q22<br />
q32<br />
q42<br />
q52<br />
q62<br />
q72<br />
q82<br />
q92<br />
q3<br />
q13<br />
q23<br />
q33<br />
q43<br />
q53<br />
q63<br />
q q73<br />
q83<br />
q93<br />
q4<br />
q14<br />
q24<br />
q34<br />
q44<br />
q54<br />
q64<br />
q74<br />
q84<br />
q94<br />
q5<br />
q15<br />
q25<br />
q35<br />
q45<br />
q q55<br />
q65<br />
q75<br />
q85<br />
q q95<br />
q6<br />
q16<br />
q q26<br />
q36<br />
q46<br />
q56<br />
q66<br />
q76<br />
q86<br />
q96<br />
q7<br />
q17<br />
q27<br />
q37<br />
q47<br />
q57<br />
q67<br />
q77<br />
q87<br />
q97<br />
Doc. No. 2572-03-005 rev. 4<br />
q58<br />
q95<br />
q8<br />
q18<br />
q28<br />
q38<br />
q48<br />
q q58<br />
q68<br />
q78<br />
q88<br />
q98<br />
q55<br />
Figure 2.1. Map of loc<strong>at</strong>ions sampled during the baseline surveys in 2001. a) June 2001, b) September 2001.<br />
<strong>During</strong> the monitoring period, surveys were conducted in September 2003 <strong>and</strong> 2004.<br />
In September 2003 <strong>and</strong> 2004, samples were collected <strong>at</strong> 3 st<strong>at</strong>ions along transects <strong>at</strong> each<br />
of 6 individual turbine loc<strong>at</strong>ions (Figure 2.2) th<strong>at</strong> were sampled in 2001 <strong>and</strong> <strong>at</strong> 6 reference<br />
st<strong>at</strong>ions th<strong>at</strong> were sampled during the EIA screening survey in 1999 (Leonhard, 2000). At<br />
the turbine loc<strong>at</strong>ions, the transects were placed on the leeward side of the turbine found<strong>at</strong>ions<br />
with respect to the prevailing current. In these areas, the maximum possible impact<br />
was expected from the changes in currents by the wind turbine found<strong>at</strong>ions. The three sta-
<strong>Horns</strong> <strong>Rev</strong>. <strong>Benthic</strong> communities Page 32<br />
tions were loc<strong>at</strong>ed <strong>at</strong> distances of 5 m, 25 m <strong>and</strong> 100 m from the edge of the scour protection.<br />
a)<br />
q Wind mills Elsam<br />
q Study areas<br />
20<br />
TUXEN<br />
4<br />
10<br />
Reference st<strong>at</strong>ions<br />
Sampling of st<strong>at</strong>ions in the wind farm area<br />
6<br />
10<br />
R1<br />
20<br />
6<br />
10<br />
4 2<br />
MUNK<br />
6<br />
q1<br />
q11<br />
q21<br />
q31<br />
q41<br />
q q51<br />
q61<br />
q71 q81<br />
q91<br />
R36<br />
q2<br />
q12<br />
q22<br />
q32<br />
q42<br />
q52<br />
q62<br />
q72<br />
q82<br />
q92<br />
q3<br />
q13<br />
q23<br />
q33<br />
q43<br />
q53<br />
q63<br />
q q73<br />
q83<br />
q93<br />
R37<br />
R7<br />
q4<br />
q14<br />
q24<br />
q34<br />
q44<br />
q54 q64<br />
q74<br />
q84<br />
q94<br />
q5<br />
q15<br />
q25<br />
q35<br />
q45<br />
q q55<br />
q65<br />
q75 q85<br />
q q95<br />
q6<br />
q16<br />
q q26<br />
q36<br />
q46<br />
q56<br />
q66<br />
q76<br />
q86<br />
q96<br />
q7<br />
q17<br />
q27<br />
q37<br />
q47<br />
q57<br />
q67<br />
q77<br />
q87<br />
q97<br />
q8<br />
q18<br />
q28<br />
q38<br />
q48<br />
q q58<br />
q68<br />
q78<br />
q88<br />
q98<br />
6<br />
10<br />
R35<br />
10<br />
10<br />
R40<br />
6<br />
6<br />
10<br />
6<br />
SØREN BOVBJERGS DYB<br />
4<br />
20<br />
2<br />
Distances from<br />
center of wind mill<br />
113,5 m<br />
10<br />
38,5 m<br />
18,5 m<br />
q<br />
b)<br />
20<br />
q Wind turbines Elsam<br />
q Study areas<br />
1<br />
3<br />
4<br />
TUXEN<br />
Survey area: Common scoter<br />
Common scoter st<strong>at</strong>ions<br />
2<br />
5<br />
6<br />
4<br />
7<br />
8<br />
10<br />
9<br />
10 11<br />
Common scoter st<strong>at</strong>ions<br />
Previous reference st<strong>at</strong>ions (infauna)<br />
Reference st<strong>at</strong>ions (infauna)<br />
DIFR st<strong>at</strong>ions<br />
Sampling of st<strong>at</strong>ions in the wind farm area (infauna)<br />
12<br />
RF4<br />
14<br />
6<br />
13<br />
16<br />
10<br />
RF3<br />
RF5<br />
20<br />
DIFR 64<br />
DIFR 70<br />
DIFR 67<br />
15<br />
68 DIFR 71<br />
17 19<br />
18<br />
69 21<br />
DIFR 66<br />
Figure 2.2. Map of loc<strong>at</strong>ions sampled in September 2003-2004 (a) <strong>and</strong> in spring 2005 (b).<br />
22<br />
23<br />
24<br />
25<br />
R1<br />
20<br />
6<br />
4 2<br />
MUNK<br />
M51_100<br />
q1<br />
q11<br />
q21<br />
q31<br />
q41<br />
q<br />
51 q61<br />
q71 q81<br />
q91<br />
R36<br />
15<br />
29<br />
57<br />
q2<br />
q12<br />
q22<br />
q32<br />
q42<br />
q52<br />
q62<br />
q72<br />
q82<br />
q92<br />
M73_100<br />
q3<br />
q13<br />
q23<br />
q33<br />
q43<br />
q53<br />
q63<br />
q<br />
73 q83<br />
q93<br />
R37<br />
R7<br />
38 45<br />
q4<br />
q14<br />
q24<br />
q34<br />
q44<br />
q54 q64<br />
q74<br />
q84<br />
q94<br />
4<br />
M55_100<br />
M95_100<br />
q5<br />
q15<br />
q25<br />
q35<br />
q45<br />
q<br />
55 q65<br />
q75 q85<br />
q<br />
95<br />
19<br />
33<br />
q6<br />
q16<br />
q<br />
26 q36<br />
q46<br />
q56<br />
q66<br />
q76<br />
q86<br />
q96<br />
M26_100<br />
10<br />
q7<br />
q17<br />
q27<br />
q37<br />
q47<br />
q57<br />
q67<br />
q77<br />
q87<br />
q97<br />
14<br />
M58_100 56<br />
q8<br />
q18<br />
q28<br />
q38<br />
q48<br />
q<br />
58 q68<br />
q78<br />
q88<br />
q98<br />
In spring 2005 (March-April), samples were collected from 5 st<strong>at</strong>ions in the wind farm<br />
area <strong>and</strong> <strong>at</strong> 40 st<strong>at</strong>ions outside the wind farm area (Figure 2.2b). Samples were mainly collected<br />
from an area northwest of the wind farm area where investig<strong>at</strong>ions on bird popul<strong>at</strong>ions<br />
around <strong>Horns</strong> <strong>Rev</strong> have shown increased numbers <strong>and</strong> aggreg<strong>at</strong>ions of the common<br />
scoter (Melanitta nigra). All samples were collected in areas with depths between 6 <strong>and</strong><br />
12 metres. St<strong>at</strong>ions R1, R7, R35, R36, R37 <strong>and</strong> R40 as well as st<strong>at</strong>ions with the prefix M<br />
were monitored during the monitoring programme for infauna in 2003 <strong>and</strong> 2004. St<strong>at</strong>ions<br />
with the prefix DIFR were analysed for sediment characteristics in the survey for s<strong>and</strong>eel<br />
in 2002 (Jensen et al., 2004) <strong>and</strong> three st<strong>at</strong>ions (RF3, RF4, RF5) were monitored during<br />
the baseline description for infauna in September 2001.<br />
2.1.1. Field surveys<br />
At each st<strong>at</strong>ion, three quantit<strong>at</strong>ive HAPS-samples with a surface area of 0.0123 m² were<br />
taken by SCUBA divers using polycarbon<strong>at</strong>e tube samplers. The sediment core sample<br />
depths were approxim<strong>at</strong>ely 15 cm. Two replic<strong>at</strong>e samples were collected for analysing infauna<br />
<strong>and</strong> one sample was collected <strong>at</strong> each st<strong>at</strong>ion for analysis of sediment characteristics.<br />
The choice of sampling technique <strong>and</strong> the number of samples was based on a st<strong>at</strong>istical<br />
power analysis of the abundance <strong>and</strong> biomass d<strong>at</strong>a from the baseline studies.<br />
Samples for identific<strong>at</strong>ion of species composition, abundance <strong>and</strong> biomass were carefully<br />
sieved through a 1.0 mm labor<strong>at</strong>ory test sieve <strong>and</strong> the residual was preserved in 96% ethanol,<br />
which is equivalent to approxim<strong>at</strong>ely 80% ethanol when taking the w<strong>at</strong>er content of<br />
the sample into consider<strong>at</strong>ion.<br />
The coordin<strong>at</strong>es of the infauna localities with actual GPS positions (WGS 84) <strong>and</strong> actual<br />
depths <strong>at</strong> sampling d<strong>at</strong>es are presented in Appendix 1.<br />
2.2. Hard bottom substr<strong>at</strong>e<br />
Monitoring surveys were performed in March <strong>and</strong> September each year from 2003 to<br />
2005.<br />
6<br />
10<br />
Doc. No. 2572-03-005 rev. 4<br />
6<br />
10<br />
R35<br />
10<br />
R40<br />
6
<strong>Horns</strong> <strong>Rev</strong>. <strong>Benthic</strong> communities Page 33<br />
Surveys were performed <strong>at</strong> six turbine sites <strong>at</strong> the <strong>Horns</strong> <strong>Rev</strong> Wind Farm (Figure 2.3). The<br />
sites were selected according to differences in depth regimes <strong>and</strong> turbine site loc<strong>at</strong>ions.<br />
Faunal colonis<strong>at</strong>ion p<strong>at</strong>terns might be different between turbine found<strong>at</strong>ions in the centre,<br />
along the border of the wind farm area <strong>and</strong> <strong>at</strong> the turbine found<strong>at</strong>ions <strong>at</strong> different depth<br />
regimes.<br />
N<br />
20<br />
TUXEN<br />
q Wind mills Elsam<br />
Hard substr<strong>at</strong>e surveys<br />
4<br />
10<br />
6<br />
10<br />
20<br />
4 2<br />
MUNK<br />
6<br />
q1<br />
q11<br />
q21<br />
q31<br />
q41<br />
q51<br />
q61<br />
q71 q81<br />
q91<br />
q2<br />
q12<br />
q22<br />
q32<br />
q42<br />
q52<br />
q62<br />
q72<br />
q82<br />
q92<br />
q3<br />
q13<br />
q23<br />
q33q43<br />
q53<br />
q63<br />
q73<br />
q83<br />
q93<br />
q4<br />
q14<br />
q24<br />
q34<br />
q44<br />
q54 q64<br />
q74<br />
q84<br />
q94<br />
q q q q q q55q<br />
q q q95<br />
5 15 25 35 45<br />
65 75 85<br />
q6<br />
q16<br />
q26<br />
q36<br />
q46<br />
q56<br />
q66<br />
q76<br />
q86<br />
q96<br />
q7<br />
q17<br />
q27<br />
q37<br />
q47<br />
q57<br />
q67<br />
q77<br />
q87<br />
q97<br />
q8<br />
q18<br />
q28<br />
q38<br />
q48<br />
q58q68 q78<br />
q88<br />
q98<br />
6<br />
10<br />
6<br />
10<br />
10<br />
6<br />
10<br />
6<br />
10<br />
SØREN BOVBJERGS DYB<br />
Figure 2.3. Map of loc<strong>at</strong>ions sampled in March <strong>and</strong><br />
September 2003-2005. The test fishing<br />
was performed <strong>at</strong> the encircled turbine<br />
sites.<br />
10<br />
6<br />
4<br />
20<br />
2<br />
Photo 9. Survey vessel.<br />
The coordin<strong>at</strong>es of the six turbine positions are given in Appendix 1.<br />
2.2.1. Field surveys<br />
Depth <strong>at</strong> the turbine sites was measured with an echo sounder with the depth being from<br />
the w<strong>at</strong>er surface to the top of the scour protection close to the monopile.<br />
At different individual found<strong>at</strong>ion st<strong>at</strong>ions, SCUBA divers collected samples along a line<br />
(transect) in the direction of the main current (NNE 20°) in order to cover many zones exposed<br />
to different current situ<strong>at</strong>ions. Three st<strong>at</strong>ions <strong>at</strong> distances 0.5 m, 2 m <strong>and</strong> 5 m<br />
(NNE0.5, NNE2, <strong>and</strong> NNE5, respectively) from the monopiles were selected along the<br />
transects. As a reference, one st<strong>at</strong>ion (SSW5) was additionally sampled 5 metres upstream<br />
(SSW 200°) from the monopile (Figure 2.4).<br />
Figure 2.4. Sampling loc<strong>at</strong>ions <strong>at</strong> the turbine sites.<br />
Doc. No. 2572-03-005 rev. 4
<strong>Horns</strong> <strong>Rev</strong>. <strong>Benthic</strong> communities Page 34<br />
At each st<strong>at</strong>ion, samples of fouling organisms were thoroughly scraped off the stone<br />
blocks within a frame of 0.04 m² using a special scraping tool <strong>and</strong> a special underw<strong>at</strong>er<br />
air-lift device. Three replic<strong>at</strong>es of faunal samples were collected in bags with a mesh size<br />
of 1 mm. A total of 72 scour protection samples were collected during each survey.<br />
Along each upstream (SSW) <strong>and</strong> downstream (NNE) found<strong>at</strong>ion transect, a visual determin<strong>at</strong>ion<br />
was performed of the fouling communities <strong>and</strong> species th<strong>at</strong> could be identified<br />
were identified on site by the divers in addition to the quantit<strong>at</strong>ive sampling. A semiquantit<strong>at</strong>ive<br />
assessment was carried out on the frequency of each group of organism as<br />
well as an evalu<strong>at</strong>ion of the coverage of species <strong>and</strong> substr<strong>at</strong>e. The species-specific degree<br />
of coverage is the term used to describe the degree of coverage by a single species on a<br />
specific substr<strong>at</strong>e based on a suitable adapt<strong>at</strong>ion of the Braun-Blanquet scale (Table 2.1)<br />
(Leewis <strong>and</strong> Hallie, 2000). Fish species observed were registered <strong>and</strong> numbered according<br />
to Table 2.1. Underw<strong>at</strong>er video recordings were also made for document<strong>at</strong>ion.<br />
Table 2.1. Braun-Blanquet scores for hard substr<strong>at</strong>e fouling organisms. Code for observ<strong>at</strong>ions of mobile<br />
benthic species <strong>and</strong> fish species.<br />
Sessile species<br />
Mobile species Fish species<br />
Code Degree of coverage % Number of individuals/m² Code Number of individuals<br />
R < 0.05 0.5 O Observed<br />
+ 0.05–0.50 2 R Common<br />
1 0.50–5 5 ∞ Numerous<br />
2 5–25 5–50<br />
3 25–50 50–500<br />
4 50–75<br />
5 75–100<br />
The total degree of coverage for floral <strong>and</strong> faunal communities on the scour protection <strong>and</strong><br />
the monopiles is termed the substr<strong>at</strong>e-specific degree of coverage. Certain groups of organisms<br />
were collected for species identific<strong>at</strong>ion in the labor<strong>at</strong>ory. Some green algae in<br />
the genus Ulva, especially the species in the Enteromorpha group, are very difficult to<br />
identify during field surveys. Identific<strong>at</strong>ion of Ulva intestinalis <strong>and</strong> U. linza were done in<br />
the labor<strong>at</strong>ory. Some species of sea anemones were identified using video recordings.<br />
Sampling also included the monopile <strong>at</strong> three loc<strong>at</strong>ions (marked with ** in Table 1.4a).<br />
The sampling covered the vertical vari<strong>at</strong>ion <strong>at</strong> depth intervals of 0 m, 2 m, 4 m, 6 m <strong>and</strong> 8<br />
m measured from the bottom of the scour protection (Figure 2.4). The sampling was performed<br />
to cover the direction of the principal current on both the currentward (SSW) <strong>and</strong><br />
leeward sides (NNE) of the monopiles.<br />
In addition to the visual studies <strong>and</strong> the photographic document<strong>at</strong>ion, the studies on the<br />
monopiles included the collection of quantit<strong>at</strong>ive samples by divers to determine the composition<br />
of species, abundance, <strong>and</strong> biomass. Two 0.04 m² frame samples were taken<br />
within each depth interval on each side of the monopile. Larger algae <strong>and</strong> shellfish as well<br />
as other fouling organisms were scraped off using the same technique used on the scour<br />
protection. Dependent on tidal depth vari<strong>at</strong>ions a total of 54 to 64 samples from the monopiles<br />
were collected <strong>at</strong> the individual surveys.<br />
Additional frame samples concerning the abundance of specific epifauna communities in<br />
the splash zone were made <strong>at</strong> a selected number of monopiles.<br />
Doc. No. 2572-03-005 rev. 4
<strong>Horns</strong> <strong>Rev</strong>. <strong>Benthic</strong> communities Page 35<br />
2.3. Sample h<strong>and</strong>ling<br />
2.3.1. Sediment<br />
Sediment was characterised by analyses for grain size distribution, dry m<strong>at</strong>ter content <strong>and</strong><br />
the amount of organic m<strong>at</strong>erial measured by combustion loss. Dry m<strong>at</strong>ter content was<br />
measured as a percentage of the wet weight. The combustion loss was measured as a percentage<br />
of the dry weight. D<strong>at</strong>a are presented in Appendices 3 <strong>and</strong> 4. The samples were<br />
tre<strong>at</strong>ed according to DS 405.11 <strong>and</strong> DS 204. The sediment was washed in distilled w<strong>at</strong>er<br />
to remove any remaining salts <strong>and</strong> dried <strong>at</strong> 105°C until constant weight was obtained. The<br />
sediment was pre-tre<strong>at</strong>ed with hydrogen peroxide to remove organic m<strong>at</strong>erial.<br />
Grain size distribution was determined using a combin<strong>at</strong>ion of sieve analysis <strong>and</strong> sedigraph<br />
technique. Sieve analysis was used for the s<strong>and</strong> fraction, i.e. all the m<strong>at</strong>erial retained<br />
by a 63 µ sieve according to a modified st<strong>and</strong>ard DS 405.9 using a total of 15 sieves.<br />
A sedigraph 5100 was used for analysis of the silt/clay fraction, i.e. all the m<strong>at</strong>erial passing<br />
through a 63 µ sieve. The sediment was pre-tre<strong>at</strong>ed with a 0.005 molar solution of sodium<br />
pyro phosph<strong>at</strong>e <strong>and</strong> tre<strong>at</strong>ed with an ultrasound vibr<strong>at</strong>or for 5 minutes.<br />
Cumul<strong>at</strong>ive percentage curves of the sieve <strong>and</strong> the sedigraph analysis d<strong>at</strong>a were prepared<br />
with their characteristics described by means of median particle diameter <strong>and</strong> measured as<br />
the point <strong>at</strong> which the 50% abscissa intersects the cumul<strong>at</strong>ive percentage curve.<br />
On the basis of sediment st<strong>at</strong>istics, a sorting index was calcul<strong>at</strong>ed. Sediments with a sorting<br />
index less than 0.5 were characterised as well-sorted. A sorting index of 0.5–1 characterises<br />
sediments as medium-sorted, while a sorting index of >1 characterises sediments as<br />
poorly sorted (modified after Folk & Ward [GEUS, 2002]).<br />
2.3.2. Benthos<br />
In the labor<strong>at</strong>ory, samples for identific<strong>at</strong>ion of species composition, abundance <strong>and</strong> biomass<br />
were carefully sieved through a 0.5 mm test sieve. All remaining organisms in the<br />
collection net bag were carefully removed with use of a pincer.<br />
The fauna samples were sorted under a microscope <strong>and</strong> the animals were identified to the<br />
lowest possible taxon. Due to the large number of individuals in the frame samples, st<strong>and</strong>ard<br />
sub sampling was practised for both numbering <strong>and</strong> measurement of biomass. The<br />
number of individuals <strong>and</strong> the ethanol wet weight of each taxon were determined. Abundance<br />
(ind. m -2 ) <strong>and</strong> biomass (g wet weight [ww] m -2 /g; dry weight [dw] m -2 ) were calcul<strong>at</strong>ed<br />
for the total fauna. Dry weight d<strong>at</strong>a exists only for surveys performed from 2003 to<br />
2005.<br />
The shell length of the mussels, i.e. the longest distance between anterior end <strong>and</strong> posterior<br />
end, <strong>and</strong> the disc diameter of the brittle stars were measured by means of electronic<br />
slide gauge.<br />
2.4. Test fishing<br />
As a supplement to the fauna sampling programme, test fishing using st<strong>and</strong>ard gill nets<br />
was performed <strong>at</strong> turbine sites 54 <strong>and</strong> 33. Test fishing was performed <strong>at</strong> turbine site 54 in<br />
September 2003 <strong>and</strong> in March 2004. From September 2004, turbine site 33 was selected<br />
Doc. No. 2572-03-005 rev. 4
<strong>Horns</strong> <strong>Rev</strong>. <strong>Benthic</strong> communities Page 36<br />
due to the fact th<strong>at</strong> the divers observed more species than <strong>at</strong> any other sites investig<strong>at</strong>ed.<br />
Both pelagic gill nets <strong>and</strong> sinking gill nets were used during day <strong>and</strong> night.<br />
The st<strong>and</strong>ard biological survey gill nets used were 42 m long <strong>and</strong> 1.5 m high. The nets are<br />
composed of 14 different mesh sizes from 6.25 mm to 60 mm in 14 sections. The nets<br />
were placed with the southern end close to the monopile in the direction of the main current<br />
towards 20º NNE. The pelagic nets were placed in the pelagic zone approxim<strong>at</strong>ely<br />
1.5-2.5 m above the seabed covering both the scour protection <strong>and</strong> the seabed outside the<br />
scour protection (Figure 2.5).<br />
Figure 2.5. Schem<strong>at</strong>ic illustr<strong>at</strong>ion of the placement of the pelagic gill nets <strong>at</strong> the test fishing sites.<br />
2.5 m<br />
2.4.1. Objective<br />
The objective of the test fishing was to valid<strong>at</strong>e the fish species observed during the sampling<br />
programme in the evalu<strong>at</strong>ion of the fish <strong>at</strong>traction effect of the introduced hard substr<strong>at</strong>es.<br />
2.5. D<strong>at</strong>a analyses<br />
Differences in infauna d<strong>at</strong>asets between the wind farm <strong>and</strong> reference areas <strong>and</strong> between<br />
survey campaigns were analysed on the basis of the combined d<strong>at</strong>a of sediment characteristics<br />
<strong>and</strong> species composition in terms of abundance <strong>and</strong> biomass.<br />
Campaign d<strong>at</strong>a available for analysis are presented in Table 2.2.<br />
Table 2.2. Campaign d<strong>at</strong>a available for infauna community analysis. 1<br />
Wind farm area Reference area<br />
Campaign Year<br />
Spring Autumn Spring Autumn<br />
EIA screening 1999 x x<br />
Baseline 2001 x x<br />
Monitoring 2003 x x<br />
Monitoring 2004 x x<br />
Monitoring/extended survey area 2005 x x<br />
1 Only comparable d<strong>at</strong>a sets are included in the analysis. Due to high heterogeneity, the benthic community<br />
within the design<strong>at</strong>ed reference area sampled in autumn 2001 showed to be st<strong>at</strong>istically different from the<br />
benthic community in the wind farm area (Leonhard & Pedersen, 2002).<br />
42 m<br />
1.5 m<br />
Doc. No. 2572-03-005 rev. 4
<strong>Horns</strong> <strong>Rev</strong>. <strong>Benthic</strong> communities Page 37<br />
Due to the n<strong>at</strong>ure of the sampling layout, where the reference area was moved between<br />
2001 <strong>and</strong> 2003 to st<strong>at</strong>ions identical with st<strong>at</strong>ions surveyed in 1999, <strong>and</strong> the difference in<br />
sampling time between 2003/2004 <strong>and</strong> 2005, the samples were segmented into the following<br />
subsets:<br />
1. Wind farm area: 3 campaigns (September 2001, September 2003, September<br />
2004).<br />
2. Reference area: 3 campaigns (spring 1999, September 2003, September 2004).<br />
3. Wind farm area: 2 campaigns (spring 2001 <strong>and</strong> spring 2005) compared to extended<br />
reference areas.<br />
D<strong>at</strong>asets from autumn 2001 to 2004 <strong>and</strong> d<strong>at</strong>asets from spring 1999 <strong>and</strong> 2005 were used for<br />
effect analysis <strong>and</strong> analysis for temporal yearly vari<strong>at</strong>ions.<br />
Differences in d<strong>at</strong>asets from 2003 to 2005 were analysed for hard bottom substr<strong>at</strong>e communities.<br />
Table 2.3. Campaign d<strong>at</strong>a available for hard bottom substr<strong>at</strong>e community analysis.<br />
Wind farm area<br />
Campaign Year<br />
Spring Autumn<br />
Monitoring 2003 x x<br />
Monitoring 2004 x x<br />
Monitoring 2005 x x<br />
2.5.1. Sediment characteristics<br />
For each subset, differences in sediment characteristics were analysed using a series of<br />
ANOVA tests. Each variable was checked for normality <strong>and</strong> homogeneity of variance. In<br />
addition, the correl<strong>at</strong>ions between characteristics were quantified using Pearson’s correl<strong>at</strong>ion<br />
coefficient, also called linear or product-moment correl<strong>at</strong>ion.<br />
For further explan<strong>at</strong>ion, see http://www.st<strong>at</strong>soft.com/textbook/stbasic.html#Correl<strong>at</strong>ions.<br />
2.5.2. Species composition<br />
Differences between the faunal communities <strong>at</strong> the individual sampling sites, (wind farm<br />
area, reference area <strong>and</strong> wind turbine sites) vari<strong>at</strong>ion in fauna communities <strong>at</strong> monopiles<br />
according to depth <strong>and</strong> vari<strong>at</strong>ion in fauna communities between turbine sites were analysed<br />
on the basis of the combined d<strong>at</strong>a of species composition in terms of abundance <strong>and</strong><br />
biomass.<br />
Within each subset, differences in the species compositions between the wind farm area<br />
<strong>and</strong> the reference area <strong>and</strong> between survey campaigns or between the sampling sites were<br />
quantified using the Bray-Curtis dissimilarity index based on root-root transformed d<strong>at</strong>a.<br />
Root-root transform<strong>at</strong>ion reduces the importance of domin<strong>at</strong>ing species, which gives a better<br />
reflection of the species composition based on presence/absence compared with nontransformed<br />
d<strong>at</strong>a.<br />
Doc. No. 2572-03-005 rev. 4
<strong>Horns</strong> <strong>Rev</strong>. <strong>Benthic</strong> communities Page 38<br />
The Bray-Curtis index is calcul<strong>at</strong>ed as:<br />
BC =<br />
∑<br />
k<br />
∑<br />
k<br />
x − x<br />
ik jk<br />
∑<br />
x + x<br />
ik jk<br />
k<br />
where i <strong>and</strong> j are sub-samples <strong>and</strong> k is the number of species in the sub-samples. Similarity<br />
was expressed as 1 - BC. At maximum similarity, BC = 0 <strong>and</strong> <strong>at</strong> maximum dissimilarity,<br />
BC = 1.<br />
The BC values are used for presenting d<strong>at</strong>a in 2-dimensional plots using a non-metric<br />
Multidimensional Scaling (MDS) ordin<strong>at</strong>ion. For further description of the MDS technique,<br />
see: http://www.st<strong>at</strong>soft.com/textbook/stmulsca.html.<br />
In MDS plots, usually a stress factor (0-0.5) is displayed as the distortion between the<br />
similarity rankings <strong>and</strong> the corresponding distance rankings in the ordin<strong>at</strong>ion plot. Low<br />
stress 0.1-0.2 corresponds to a good agreement between the calcul<strong>at</strong>ed similarity rankings<br />
<strong>and</strong> the ordin<strong>at</strong>ion shown.<br />
A formal test for differences between areas <strong>and</strong> campaigns was made for each subset using<br />
a non-parametric permut<strong>at</strong>ion procedure applied to the similarity m<strong>at</strong>rix underlying the<br />
ordin<strong>at</strong>ion. To evalu<strong>at</strong>e the rel<strong>at</strong>ive importance of the different species, the average contribution<br />
to the overall similarity within groups <strong>and</strong> the average contribution to the overall<br />
dissimilarity between groups were calcul<strong>at</strong>ed for each species. The results are presented<br />
listing the most important species first.<br />
To link sediment characteristics to species composition, two different approaches were<br />
used. First, a dissimilarity m<strong>at</strong>rix was calcul<strong>at</strong>ed between samples based on all sediment<br />
characteristics using the Euclidean distance as the dissimilarity measure. This m<strong>at</strong>rix was<br />
tested for agreement with the dissimilarity m<strong>at</strong>rix based on species composition using the<br />
weighted Spearman rank correl<strong>at</strong>ion, see:<br />
http://www.st<strong>at</strong>soft.com/textbook/stnonpar.html#correl<strong>at</strong>ions.<br />
Second, the same test for agreement was performed on combin<strong>at</strong>ions of sediment characteristics<br />
<strong>at</strong> steadily increasing levels of complexity to find the combin<strong>at</strong>ion with the highest<br />
rank correl<strong>at</strong>ion.<br />
No legisl<strong>at</strong>ive environmental criteria has been established for either the indic<strong>at</strong>ors or level<br />
of significance for a monitoring programme <strong>at</strong> <strong>Horns</strong> <strong>Rev</strong>. As a consequence, the monitoring<br />
programme established for the benthic infauna was reduced to enable only major<br />
changes in the community structure of the infauna. The monitoring programme included<br />
multivari<strong>at</strong>e analysis of the combined input from each species with respect to biomass <strong>and</strong><br />
abundance, which have increased the sensitivity of the st<strong>at</strong>istical analysis considerably. A<br />
variance test (ANOVA) on logarithm transformed d<strong>at</strong>a was used for analysing differences<br />
in abundance <strong>and</strong> biomass for selected dominant <strong>and</strong> character species between surveys.<br />
The software package PRIMER was used for st<strong>at</strong>istical analysis (Clarke & Warwick,<br />
1994). A formal test for differences between sites was made for each subset using a nonparametric<br />
permut<strong>at</strong>ion procedure applied to the similarity m<strong>at</strong>rix underlying the ordin<strong>at</strong>ion.<br />
To evalu<strong>at</strong>e the rel<strong>at</strong>ive importance of the different species, the average contribution<br />
Doc. No. 2572-03-005 rev. 4
<strong>Horns</strong> <strong>Rev</strong>. <strong>Benthic</strong> communities Page 39<br />
to the overall similarity within groups <strong>and</strong> the average contribution to the overall dissimilarity<br />
between groups were calcul<strong>at</strong>ed for each species.<br />
Doc. No. 2572-03-005 rev. 4
<strong>Horns</strong> <strong>Rev</strong>. <strong>Benthic</strong> communities Page 40<br />
3. Results<br />
3.1. Sediment<br />
The sediments in the wind farm <strong>and</strong> reference areas can generally be characterised as homogeneous<br />
<strong>and</strong> medium sorted medium-fine to coarse s<strong>and</strong>.<br />
The average medium grain size of the sediment in the wind farm area has significantly increased<br />
(P
<strong>Horns</strong> <strong>Rev</strong>. <strong>Benthic</strong> communities Page 41<br />
Figure 3.1. A box plot of the median grain size in<br />
the wind farm in September 2001, 2003<br />
<strong>and</strong> 2004.<br />
Sediment d<strong>at</strong>a<br />
Stress: 0.14<br />
Turbine 2001<br />
Reference 2001<br />
Turbine 2003<br />
Reference 2003<br />
turbine 2004<br />
Reference 2004<br />
Figure 3.2. A multidimensional scaling (MDS 2 ) plot<br />
of the sediment characteristics in the<br />
wind farm (Turbine) <strong>and</strong> reference area<br />
(Ref) in September 2001, 2003 <strong>and</strong><br />
2004.<br />
In the northern part of the wind farm area, the sea bottom generally consisted of slightly<br />
finer sediment. In 2004 <strong>and</strong> 2005, the coarsest s<strong>and</strong> was found <strong>at</strong> turbine sites M26 <strong>and</strong><br />
M58 in the western <strong>and</strong> southern part of the wind farm area (Figure 3.3).<br />
In general, there was a gre<strong>at</strong> sp<strong>at</strong>ial variability found in the seabed surface sediment structure<br />
in the extended reference area (Figures 3.3 <strong>and</strong> 3.4). The sediment was generally homogeneous<br />
<strong>and</strong> medium sorted with an average medium grain size of 518 µm but showed<br />
a r<strong>at</strong>her heterogeneous grain size distribution varying from 220 µm to 807 µm. The sediment<br />
was more poorly sorted with coarser s<strong>and</strong> only in the northern part of the wind farm<br />
toward the Tuxen ground (Figure 3.3).<br />
A st<strong>at</strong>istical analysis revealed a significant (P
<strong>Horns</strong> <strong>Rev</strong>. <strong>Benthic</strong> communities Page 42<br />
20<br />
TUXEN<br />
q Wind turbines Elsam<br />
q Study areas<br />
Survey area: Common scoter<br />
Common scoter st<strong>at</strong>ions<br />
Common scoter st<strong>at</strong>ions<br />
Previous reference st<strong>at</strong>ions (infauna)<br />
Reference st<strong>at</strong>ions (infauna)<br />
DIFR st<strong>at</strong>ions<br />
Sampling of st<strong>at</strong>ions in the wind farm area (infauna)<br />
4<br />
10<br />
6<br />
10<br />
20<br />
4 2<br />
MUNK<br />
6<br />
M51_100<br />
q1<br />
q11<br />
q21<br />
q31<br />
q41<br />
q<br />
51 q61<br />
q71 q81<br />
q91<br />
q2<br />
q12<br />
q22<br />
q32<br />
q42<br />
q52<br />
q62<br />
q72<br />
q82<br />
q92<br />
q3<br />
q13<br />
q23<br />
q33<br />
q43<br />
q53<br />
q63<br />
q<br />
73 q83<br />
q93<br />
q4<br />
q14<br />
q24<br />
q34<br />
q44<br />
q54 q64<br />
q74<br />
q84<br />
q94<br />
M55_100 M95_100<br />
q5<br />
q15<br />
q25<br />
q35<br />
q45<br />
q<br />
55 q65<br />
q75 q85<br />
q<br />
95<br />
q6<br />
q16<br />
q<br />
26 q36<br />
q46<br />
q56<br />
q66<br />
q76<br />
q86<br />
q96<br />
M26_100<br />
q7<br />
q17<br />
q27<br />
q37<br />
q47<br />
q57<br />
q67<br />
q77<br />
q87<br />
q97<br />
M58_100<br />
q8<br />
q18<br />
q28<br />
q38<br />
q48<br />
q<br />
58 q68<br />
q78<br />
q88<br />
q98<br />
6<br />
10<br />
6<br />
10<br />
Median (50% Percentile) 6<br />
mm<br />
0<br />
4<br />
0-0.4<br />
0.4-0.5<br />
10 0.5-0.6<br />
2<br />
0.6-0.85<br />
6<br />
10<br />
6<br />
10<br />
SØREN BOVBJERGS DYB<br />
20<br />
Distances from<br />
center of wind mill<br />
113,5 m<br />
10<br />
38,5 m<br />
18,5 m<br />
q<br />
Figure 3.3. Median grain size in wind farm area<br />
<strong>and</strong> extended reference areas in 2005.<br />
Grain size (µm)<br />
0.65<br />
0.60<br />
0.55<br />
0.50<br />
0.45<br />
0.40<br />
0.35<br />
5 25 100<br />
Distance from turbine (meters)<br />
Turbine 26<br />
Turbine 51<br />
Turbine 55<br />
Turbine 58<br />
Turbine 73<br />
Turbine 95<br />
Figure 3.5. Median grain size in the wind farm in<br />
rel<strong>at</strong>ion to distance from the turbines,<br />
2004.<br />
grainsize<br />
0.8<br />
0.6<br />
0.4<br />
0.2<br />
0.0<br />
1999 Ref 1999 WT 2001 WT 2005 CS 2005 Ref 2005 WT<br />
D<strong>at</strong>a segment<br />
Figure 3.4. A box plot of the median grain size in the<br />
wind farm <strong>and</strong> reference areas in the spring<br />
surveys from 1999 to 2005.<br />
Photo 10. Sediment core samples.<br />
3.2. Infauna<br />
The cumul<strong>at</strong>ive percentage abundance of the most common species was high in both the<br />
wind farm area <strong>and</strong> reference area indic<strong>at</strong>ing community domin<strong>at</strong>ion by a few taxa (Tables<br />
3.3 <strong>and</strong> 3.4).<br />
<strong>Con</strong>siderable changes in abundances <strong>and</strong> biomass between some of the character <strong>and</strong><br />
dominant species were found between the individual spring <strong>and</strong> autumn surveys from<br />
1999 to 2005 (Tables 3.3 to 3.6). Also, considerable differences in total abundance <strong>and</strong><br />
total biomass were found between the individual surveys (Figures 3.6 <strong>and</strong> 3.7).<br />
In general, a considerable increase of abundance was found during the monitoring period<br />
from 2003 to 2004 <strong>and</strong> from the screening <strong>and</strong> baseline surveys in spring up to the 2005<br />
spring survey. A similar increase in abundance was found in the reference area for the<br />
spring surveys, whereas a decline of abundance during the monitoring period from 2003 to<br />
2004 was found in the reference area. The highest abundance was found in the wind farm<br />
in September 2001. The most dominant species was the small bivalve (Goodallia triangularis).<br />
The vari<strong>at</strong>ion in general abundances found was in principal influenced by the temporal<br />
<strong>and</strong> sp<strong>at</strong>ial vari<strong>at</strong>ion of this <strong>and</strong> the few other dominant species. Further, the bivalve<br />
(Thracia phaseolina) <strong>and</strong> the rel<strong>at</strong>ively large bristle worm (Travisia forbesii) were also<br />
Doc. No. 2572-03-005 rev. 4
<strong>Horns</strong> <strong>Rev</strong>. <strong>Benthic</strong> communities Page 43<br />
often found in rel<strong>at</strong>ively high numbers in the wind farm <strong>and</strong> reference areas contributing<br />
with rel<strong>at</strong>ive biomasses of 32% <strong>and</strong> 21% in the wind farm area in 2004. In the 2005 spring<br />
surveys, these two species often made a considerable contribution to the overall local biomasses.<br />
Especially large species of bivalves <strong>and</strong> migr<strong>at</strong>ory crustaceans like the hermit crab (Pagurus<br />
bernhardus) but also large specimens of the thick trough shell (Spisula solida) <strong>and</strong> the<br />
American razor shell (Ensis americanus) were occasionally found in samples contributing<br />
with a rel<strong>at</strong>ively large biomass (Figure 3.8). The main contribution to the biomass changes<br />
in the wind farm area between 2001 <strong>and</strong> 2004 <strong>and</strong> between spring 2001 <strong>and</strong> 2005 were<br />
declines in biomasses of Spisula solida. The high biomass in the reference area in 2004<br />
was mainly caused by the presence of one large specimen found.<br />
Table 3.3. Abundance of character species <strong>and</strong> dominants in comparable surveys from September 2001-<br />
2004.<br />
Sampling area<br />
Abundance, number/m²<br />
Wind Farm area Reference area<br />
2001 2003 2004<br />
2003 2004<br />
Species Group Mean Rel<strong>at</strong>ive % Mean Rel<strong>at</strong>ive % Mean Rel<strong>at</strong>ive % Mean Rel<strong>at</strong>ive % Mean Rel<strong>at</strong>ive %<br />
Goodallia triangularis Bivalve 203.3 10.9 664.0 58.3 862.7 58.7 630.1 53.8 616.5 75.8<br />
Pisione remota Bristle worm 411.0 22.0 22.6 2.0 85.8 5.8 13.6 1.2 6.8 0.8<br />
Goniadella bobretzkii Bristle worm 189.7 10.1 146.8 12.9 65.5 4.5 149.1 12.7 33.9 4.2<br />
Spisula solida Bivalve 36.1 1.9 20.3 1.8 13.6 0.9 27.1 2.3 13.6 1.7<br />
Ophelia borealis Bristle worm 72.3 3.9 11.3 1.0 9.0 0.6 13.6 1.2 0.0 0.0<br />
Orbinia sertul<strong>at</strong>a Bristle worm 0.0 0.0 9.0 0.8 15.8 1.1 13.6 1.2 6.8 0.8<br />
Total 912.4 48.8 874.0 76.8 1,052.4 71.6 846.9 72.3 677.5 83.3<br />
Table 3.4. Abundance of character species <strong>and</strong> dominants in comparable surveys from spring 1999-2005.<br />
Sampling area<br />
Abundance, ind./m²<br />
Wind Farm area Reference area<br />
Extended<br />
Rreference area<br />
1999 2001 2005<br />
1999<br />
2005 2005<br />
Species Group Mean Rel<strong>at</strong>ive % Mean Rel<strong>at</strong>ive % Mean Rel<strong>at</strong>ive % Mean Rel<strong>at</strong>ive % Mean Rel<strong>at</strong>ive % Mean Rel<strong>at</strong>ive %<br />
Goodallia triangularis Bivalve 199.6 31.8 153.6 16.4 474.3 40.7 54.2 10.1 758.8 61.5 197.1 26.8<br />
Pisione remota Bristle worm 206.9 32.9 176.2 18.8 203.3 17.4 74.5 13.9 108.4 8.8 170.0 23.2<br />
Goniadella bobretzkii Bristle worm 51.7 8.2 128.7 13.8 108.4 9.3 81.3 15.2 67.8 5.5 51.7 7.0<br />
Travisia forbesii Bristle worm 14.8 2.4 . . 81.3 7.0 40.7 7.6 54.2 4.4 9.9 1.3<br />
Thracia phaseolina Bivalve . . 58.7 6.3 54.2 4.7 . . . . 41.9 5.7<br />
Ensis americanus Bivalve . . . . . . . . 40.7 3.3 101.0 13.8<br />
Ophelia borealis Bristle worm 7.4 1.2 47.4 5.1 . . 54.2 10.1 13.6 1.1 12.3 1.7<br />
Orbinia sertul<strong>at</strong>a Bristle worm 7.4 1.2 24.8 2.7 13.6 1.2 40.7 7.6 . . . .<br />
Spisula solida Bivalve 7.4 1.2 31.6 3.4 . . 13.6 2.5 . . 2.5 0.3<br />
Total 495.2 78.8 621.0 66.4 935.0 80.2 359.1 67.1 1,043.4 84.6 586.4 79.9<br />
Table 3.5. Biomass of character species <strong>and</strong> dominants in comparable surveys from September 2001-2004.<br />
Sampling area<br />
Biomass, wet weight g/m²<br />
Wind Farm area Reference area<br />
2001 2003 2004<br />
2003 2004<br />
Species Group Mean Rel<strong>at</strong>ive % Mean Rel<strong>at</strong>ive % Mean Rel<strong>at</strong>ive % Mean Rel<strong>at</strong>ive % Mean Rel<strong>at</strong>ive %<br />
Spisula solida Bivalve 231.883 77.4 62.580 33.7 0.790 3.4 77.699 21.7 97.250 89.3<br />
Goodallia triangularis Bivalve 0.542 0.2 1.504 0.8 2.170 9.3 1.794 0.5 1.750 1.6<br />
Orbinia sertul<strong>at</strong>a Bristle worm 0.000 0.0 1.834 1.0 2.370 10.1 0.614 0.2 0.880 0.8<br />
Ophelia borealis Bristle worm 7.405 2.5 0.299 0.2 0.054 0.2 6.654 1.9 0.000 0.0<br />
Goniadella bobretzkii Bivalve 0.184 0.1 0.555 0.3 0.049 0.2 0.068 0.0 0.014 0.0<br />
Pisione remota Bristle worm 0.035 0.0 0.078 0.0 0.018 0.1 0.003 0.0 0.001 0.0<br />
Total 240.049 80.1 66.849 36.1 5.451 23.3 86.832 24.2 99.895 91.8<br />
Doc. No. 2572-03-005 rev. 4
<strong>Horns</strong> <strong>Rev</strong>. <strong>Benthic</strong> communities Page 44<br />
Table 3.6. Biomass of character species <strong>and</strong> dominants in comparable surveys from spring 1999-2005.<br />
Sampling area<br />
Biomass, wet weight g/m²<br />
Extended<br />
Wind Farm area Reference area<br />
Rreference area<br />
1999 2001 2005<br />
1999 2005 2005<br />
Species Group Mean Rel<strong>at</strong>ive % Mean Rel<strong>at</strong>ive % Mean Rel<strong>at</strong>ive % Mean Rel<strong>at</strong>ive % Mean Rel<strong>at</strong>ive % Mean Rel<strong>at</strong>ive %<br />
Ensis americanus Bivalve . . . . . . . . 314.45 90.4 525.25 97.6<br />
Spisula solida Bivalve 2.231 17.7 42.109 64.7 . . 1.30 1.2 . . 0.01 0.0<br />
Ophelia borealis Bristle worm 0.035 0.3 6.505 10.0 . . 15.01 14.4 0.41 0.1 4.98 0.9<br />
Travisia forbesii Bristle worm 0.028 0.2 . . 9.367 43.8 0.79 0.8 7.11 2.0 0.55 0.1<br />
Orbinia sertul<strong>at</strong>a Bristle worm 1.463 11.6 2.788 4.3 4.707 22.0 4.79 4.6 . . . .<br />
Thracia phaseolina Bivalve . . 7.687 11.8 4.108 19.2 . . . . 0.63 0.1<br />
Goodallia triangularis Bivalve 0.698 5.5 0.400 0.6 1.321 6.2 0.20 0.2 2.00 0.6 0.47 0.1<br />
Goniadella bobretzkii Bristle worm 0.052 0.4 0.075 0.1 0.077 0.4 0.07 0.1 0.04 0.0 0.04 0.0<br />
Pisione remota Bristle worm 0.017 0.1 0.025 0.0 0.054 0.3 0.01 0.0 0.07 0.0 0.15 0.0<br />
Total 4.508 35.8 59.565 91.5 19.581 91.6 22.165 21.2 324.009 93.1 531.935 98.8<br />
For the most dominant <strong>and</strong> character species, no st<strong>at</strong>istically significant differences were<br />
found for Pisione remota, Goodallia triangularis <strong>and</strong> Ophelia borealis in abundance <strong>and</strong><br />
biomass between the spring surveys from 1999 to 2005. However, st<strong>at</strong>istical differences<br />
were found between two or more surveys for the remaining dominant <strong>and</strong> characteristic<br />
species (Tables 3.7-3.8). The differences found in most cases included the extended reference<br />
area. In general, very high variances were found in the distribution p<strong>at</strong>tern of the<br />
dominant <strong>and</strong> character species.<br />
Table 3.7. Level of significance (**P 0.05 > 0.05 > 0.05 > 0.05<br />
1999 Reference > 0.05 > 0.05 > 0.05 > 0.05<br />
2001 Wind farm > 0.05 > 0.05 0.012*<br />
2005 Wind farm > 0.05 > 0.05<br />
2005 Reference > 0.05<br />
2005 Extended reference<br />
ANOVA analysis 1999 1999 2001 2005 2005 2005<br />
Orbinia sertul<strong>at</strong>a Wind farm Reference Wind farm Wind farm Reference Extended reference<br />
1999 Wind farm > 0.05 > 0.05 > 0.05 > 0.05 > 0.05<br />
1999 Reference > 0.05 > 0.05 > 0.05 0.007**<br />
2001 Wind farm > 0.05 > 0.05 0.008**<br />
2005 Wind farm > 0.05 > 0.05<br />
2005 Reference > 0.05<br />
2005 Extended reference<br />
ANOVA analysis 1999 1999 2001 2005 2005 2005<br />
Spisula solida Wind farm Reference Wind farm Wind farm Reference Extended reference<br />
1999 Wind farm > 0.05 > 0.05 > 0.05 > 0.05 > 0.05<br />
1999 Reference > 0.05 > 0.05 > 0.05 > 0.05<br />
2001 Wind farm > 0.05 > 0.05 0.011*<br />
2005 Wind farm > 0.05 > 0.05<br />
2005 Reference > 0.05<br />
2005 Extended reference<br />
ANOVA analysis 1999 1999 2001 2005 2005 2005<br />
Travisia forbesii Wind farm Reference Wind farm Wind farm Reference Extended reference<br />
1999 Wind farm > 0.05 > 0.05 > 0.05 > 0.05 > 0.05<br />
1999 Reference > 0.05 > 0.05 > 0.05 > 0.05<br />
2001 Wind farm 0.003** > 0.05 > 0.05<br />
2005 Wind farm > 0.05 0.028*<br />
2005 Reference > 0.05<br />
2005 Extended reference<br />
ANOVA analysis 1999 1999 2001 2005 2005 2005<br />
Thracia phaseolina Wind farm Reference Wind farm Wind farm Reference Extended reference<br />
1999 Wind farm > 0.05 0.022* > 0.05 > 0.05 > 0.05<br />
1999 Reference 0.016* > 0.05 > 0.05 > 0.05<br />
2001 Wind farm > 0.05 > 0.05 > 0.05<br />
2005 Wind farm > 0.05 > 0.05<br />
2005 Reference > 0.05<br />
2005 Extended reference<br />
ANOVA analysis 1999 1999 2001 2005 2005 2005<br />
Ensis americanus Wind farm Reference Wind farm Wind farm Reference Extended reference<br />
1999 Wind farm > 0.05 > 0.05 > 0.05 > 0.05 0.002**<br />
1999 Reference > 0.05 > 0.05 > 0.05 0.002**<br />
2001 Wind farm > 0.05 > 0.05 < 001**<br />
2005 Wind farm > 0.05 0.033*<br />
2005 Reference > 0.05<br />
2005 Extended reference<br />
Doc. No. 2572-03-005 rev. 4
<strong>Horns</strong> <strong>Rev</strong>. <strong>Benthic</strong> communities Page 45<br />
Table 3.8. Level of significance (**P 0.05 > 0.05 > 0.05 > 0.05<br />
1999 Reference > 0.05 > 0.05 > 0.05 > 0.05<br />
2001 Wind farm > 0.05 > 0.05 0.028*<br />
2005 Wind farm > 0.05 > 0.05<br />
2005 Reference > 0.05<br />
2005 Extended reference<br />
2000<br />
1500<br />
1000<br />
500<br />
0<br />
ANOVA analysis 1999 1999 2001 2005 2005 2005<br />
Orbinia sertul<strong>at</strong>a Wind farm Reference Wind farm Wind farm Reference Extended reference<br />
1999 Wind farm > 0.05 > 0.05 > 0.05 > 0.05 > 0.05<br />
1999 Reference > 0.05 > 0.05 > 0.05 0.008**<br />
2001 Wind farm > 0.05 > 0.05 0.014*<br />
2005 Wind farm > 0.05 > 0.05<br />
2005 Reference > 0.05<br />
2005 Extended reference<br />
ANOVA analysis 1999 1999 2001 2005 2005 2005<br />
Spisula solida Wind farm Reference Wind farm Wind farm Reference Extended reference<br />
1999 Wind farm > 0.05 > 0.05 > 0.05 > 0.05 > 0.05<br />
1999 Reference > 0.05 > 0.05 > 0.05 > 0.05<br />
2001 Wind farm > 0.05 > 0.05 0.01*<br />
2005 Wind farm > 0.05 > 0.05<br />
2005 Reference > 0.05<br />
2005 Extended reference<br />
ANOVA analysis 1999 1999 2001 2005 2005 2005<br />
Travisia forbesii Wind farm Reference Wind farm Wind farm Reference Extended reference<br />
1999 Wind farm > 0.05 > 0.05 0.02* > 0.05 > 0.05<br />
1999 Reference > 0.05 > 0.05 > 0.05 > 0.05<br />
2001 Wind farm 0.001** 0.049* > 0.05<br />
2005 Wind farm > 0.05 0.009**<br />
2005 Reference > 0.05<br />
2005 Extended reference<br />
ANOVA analysis 1999 1999 2001 2005 2005 2005<br />
Thracia phaseolina Wind farm Reference Wind farm Wind farm Reference Extended reference<br />
1999 Wind farm > 0.05 0.007** > 0.05 > 0.05 > 0.05<br />
1999 Reference 0.005** > 0.05 > 0.05 > 0.05<br />
2001 Wind farm > 0.05 > 0.05 > 0.05<br />
2005 Wind farm > 0.05 > 0.05<br />
2005 Reference > 0.05<br />
2005 Extended reference<br />
ANOVA analysis 1999 1999 2001 2005 2005 2005<br />
Ensis americanus Wind farm Reference Wind farm Wind farm Reference Extended reference<br />
1999 Wind farm > 0.05 > 0.05 > 0.05 > 0.05 0.002**<br />
1999 Reference > 0.05 > 0.05 > 0.05 0.001**<br />
2001 Wind farm > 0.05 > 0.05 < 001**<br />
2005 Wind farm > 0.05 0.027*<br />
2005 Reference > 0.05<br />
2005 Extended reference<br />
No/m² Total abundance<br />
2001 2003 2004<br />
400<br />
300<br />
200<br />
100<br />
0<br />
WW g/m² Total biomass<br />
2001 2003 2004<br />
Wind farm area<br />
Reference area<br />
Figure 3.6. Total abundance <strong>and</strong> total biomass in the wind farm <strong>and</strong> reference areas from 2001 to 2004. Autumn<br />
samples.<br />
A r<strong>at</strong>her heterogeneous sp<strong>at</strong>ial distribution p<strong>at</strong>tern was displayed for more of the most<br />
dominant <strong>and</strong> character species in 2005 (Figure 3.8). One of the main differences in the<br />
sp<strong>at</strong>ial distribution was found for the American razor shell (Ensis americanus), which was<br />
most abundant in the northwestern part of the extended reference area. The consequence<br />
of this was a conspicuously larger biomass in this particular area <strong>and</strong> in the extended reference<br />
area in general compared to the wind farm area <strong>and</strong> in lesser extent the reference<br />
area, where this mussel also was found. The small mussel (Goodallia triangularis) was<br />
most common in the wind farm area, whereas Thracia phaseolina seemed to be more ho-<br />
Doc. No. 2572-03-005 rev. 4
<strong>Horns</strong> <strong>Rev</strong>. <strong>Benthic</strong> communities Page 46<br />
mogeneously distributed even though the biomass of Goodallia triangularis was higher in<br />
the wind farm area.<br />
1400<br />
1200<br />
1000<br />
800<br />
600<br />
400<br />
200<br />
0<br />
No/m² Total abundance<br />
1999 2001 2005<br />
600<br />
500<br />
400<br />
300<br />
200<br />
100<br />
0<br />
WW g/m² Total biomass<br />
Wind farm area<br />
Reference area<br />
Extended reference area<br />
1999 2001 2005<br />
Figure 3.7. Total abundance <strong>and</strong> total biomass in the wind farm <strong>and</strong> reference areas from 1999 to 2005. Spring<br />
samples.<br />
20<br />
TUXEN<br />
q Wind turbines Elsam<br />
q Study areas<br />
Survey area: Common scoter<br />
Common scoter st<strong>at</strong>ions<br />
Common scoter st<strong>at</strong>ions<br />
Previous reference st<strong>at</strong>ions (infauna)<br />
Reference st<strong>at</strong>ions (infauna)<br />
DIFR st<strong>at</strong>ions<br />
Sampling of st<strong>at</strong>ions in the wind farm area (infauna)<br />
4<br />
10<br />
4<br />
10<br />
4<br />
10<br />
6<br />
6<br />
6<br />
10<br />
10<br />
10<br />
20<br />
4 2<br />
MUNK<br />
6<br />
M51_100<br />
q1<br />
q11<br />
q21<br />
q31<br />
q41<br />
q q51<br />
q61<br />
q71 q81<br />
q91<br />
q2<br />
q12<br />
q22<br />
q32<br />
q42<br />
q52<br />
q62<br />
q72<br />
q82<br />
q92<br />
q3<br />
q13<br />
q23<br />
q33<br />
q43<br />
q53<br />
q63<br />
q q73<br />
q83<br />
q93<br />
q4<br />
q14<br />
q24<br />
q34<br />
q44<br />
q54 q64<br />
q74<br />
q84<br />
q94<br />
M55_100 M95_100<br />
q5<br />
q15<br />
q25<br />
q35<br />
q45<br />
q q55<br />
q65<br />
q75 q85<br />
q q95<br />
q6<br />
q16<br />
q q26<br />
q36<br />
q46<br />
q56<br />
q66<br />
q76<br />
q86<br />
q96<br />
M26_100<br />
q7<br />
q17<br />
q27<br />
q37<br />
q47<br />
q57<br />
q67<br />
q77<br />
q87<br />
q97<br />
M58_100<br />
q8<br />
q18<br />
q28<br />
q38<br />
q48<br />
q q58<br />
q68<br />
q78<br />
q88<br />
q98<br />
20<br />
6<br />
10<br />
6<br />
4 2<br />
MUNK<br />
6<br />
M51_100<br />
q1<br />
q11<br />
q21<br />
q31<br />
q41<br />
q q51<br />
q61<br />
q71 q81<br />
q91<br />
q2<br />
q12<br />
q22<br />
q32<br />
q42<br />
q52<br />
q62<br />
q72<br />
q82<br />
q92<br />
q3<br />
q13<br />
q23<br />
q33<br />
q43<br />
q53<br />
q63<br />
q q73<br />
q83<br />
q93<br />
q4<br />
q14<br />
q24<br />
q34<br />
q44<br />
q54 q64<br />
q74<br />
q84<br />
q94<br />
M55_100 M95_100<br />
q5<br />
q15<br />
q25<br />
q35<br />
q45<br />
q q55<br />
q65<br />
q75 q85<br />
q q95<br />
q6<br />
q16<br />
q q26<br />
q36<br />
q46<br />
q56<br />
q66<br />
q76<br />
q86<br />
q96<br />
M26_100<br />
q7<br />
q17<br />
q27<br />
q37<br />
q47<br />
q57<br />
q67<br />
q77<br />
q87<br />
q97<br />
M58_100<br />
q8<br />
q18<br />
q28<br />
q38<br />
q48<br />
q q58<br />
q68<br />
q78<br />
q88<br />
q98<br />
6<br />
10<br />
6<br />
10<br />
10<br />
10<br />
Ensis americanus 6<br />
Abundance no./m²<br />
0<br />
4<br />
0-100<br />
100-200<br />
10 200-600<br />
2<br />
600-900<br />
6<br />
10<br />
6<br />
10<br />
SØREN BOVBJERGS DYB<br />
20<br />
Distances from<br />
center of wind mill<br />
113,5 m<br />
10<br />
38,5 m<br />
18,5 m<br />
q<br />
Goodallia triangularis 6<br />
Abundance no./m²<br />
0<br />
4<br />
0-200<br />
200-600<br />
10 600-1000<br />
2<br />
1000-3300<br />
6<br />
6<br />
10<br />
10<br />
6<br />
6<br />
10<br />
10<br />
SØREN BOVBJERGS DYB<br />
20<br />
Distances from<br />
center of wind mill<br />
113,5 m<br />
10<br />
38,5 m<br />
18,5 m<br />
q<br />
Tracia phaseolina 6<br />
Abundance no./m²<br />
0<br />
4<br />
0-25<br />
25-75<br />
10 75-150<br />
2<br />
150-250<br />
SØREN BOVBJERGS DYB<br />
20<br />
Distances from<br />
center of wind mill<br />
113,5 m<br />
10<br />
38,5 m<br />
18,5 m<br />
q<br />
20<br />
TUXEN<br />
q Wind turbines Elsam<br />
q Study areas<br />
Survey area: Common scoter<br />
Common scoter st<strong>at</strong>ions<br />
Common scoter st<strong>at</strong>ions<br />
Previous reference st<strong>at</strong>ions (infauna)<br />
Reference st<strong>at</strong>ions (infauna)<br />
DIFR st<strong>at</strong>ions<br />
Sampling of st<strong>at</strong>ions in the wind farm area (infauna)<br />
4<br />
10<br />
4<br />
10<br />
4<br />
10<br />
6<br />
6<br />
6<br />
10<br />
10<br />
10<br />
20<br />
4 2<br />
MUNK<br />
6<br />
M51_100<br />
q1<br />
q11<br />
q21<br />
q31<br />
q41<br />
q<br />
51 q61<br />
q71 q81<br />
q91<br />
q2<br />
q12<br />
q22<br />
q32<br />
q42<br />
q52<br />
q62<br />
q72<br />
q82<br />
q92<br />
q3<br />
q13<br />
q23<br />
q33<br />
q43<br />
q53<br />
q63<br />
q<br />
73 q83<br />
q93<br />
q4<br />
q14<br />
q24<br />
q34<br />
q44<br />
q54 q64<br />
q74<br />
q84<br />
q94<br />
M55_100 M95_100<br />
q5<br />
q15<br />
q25<br />
q35<br />
q45<br />
q<br />
55 q65<br />
q75 q85<br />
q<br />
95<br />
q6<br />
q16<br />
q<br />
26 q36<br />
q46<br />
q56<br />
q66<br />
q76<br />
q86<br />
q96<br />
M26_100<br />
q7<br />
q17<br />
q27<br />
q37<br />
q47<br />
q57<br />
q67<br />
q77<br />
q87<br />
q97<br />
M58_100<br />
q8<br />
q18<br />
q28<br />
q38<br />
q48<br />
q<br />
58 q68<br />
q78<br />
q88<br />
q98<br />
20<br />
6<br />
10<br />
6<br />
4 2<br />
MUNK<br />
6<br />
M51_100<br />
q1<br />
q11<br />
q21<br />
q31<br />
q41<br />
q<br />
51 q61<br />
q71 q81<br />
q91<br />
q2<br />
q12<br />
q22<br />
q32<br />
q42<br />
q52<br />
q62<br />
q72<br />
q82<br />
q92<br />
q3<br />
q13<br />
q23<br />
q33<br />
q43<br />
q53<br />
q63<br />
q<br />
73 q83<br />
q93<br />
q4<br />
q14<br />
q24<br />
q34<br />
q44<br />
q54 q64<br />
q74<br />
q84<br />
q94<br />
M55_100 M95_100<br />
q5<br />
q15<br />
q25<br />
q35<br />
q45<br />
q<br />
55 q65<br />
q75 q85<br />
q<br />
95<br />
q6<br />
q16<br />
q<br />
26 q36<br />
q46<br />
q56<br />
q66<br />
q76<br />
q86<br />
q96<br />
M26_100<br />
q7<br />
q17<br />
q27<br />
q37<br />
q47<br />
q57<br />
q67<br />
q77<br />
q87<br />
q97<br />
M58_100<br />
q8<br />
q18<br />
q28<br />
q38<br />
q48<br />
q<br />
58 q68<br />
q78<br />
q88<br />
q98<br />
6<br />
10<br />
6<br />
10<br />
10<br />
10<br />
Ensis americanus 6<br />
Biomass WW g/m²<br />
0<br />
4<br />
0-50<br />
50-200<br />
10 200-1000<br />
2<br />
1000-3945<br />
SØREN BOVBJERGS DYB<br />
Doc. No. 2572-03-005 rev. 4<br />
6<br />
10<br />
6<br />
10<br />
20<br />
Distances from<br />
center of wind mill<br />
113,5 m<br />
10<br />
38,5 m<br />
18,5 m<br />
q<br />
Goodallia triangularis 6<br />
Biomass WW g/m²<br />
0<br />
4<br />
0-1<br />
1-3<br />
10 3-5<br />
2<br />
5-8<br />
6<br />
10<br />
6<br />
10<br />
SØREN BOVBJERGS DYB<br />
20<br />
Distances from<br />
center of wind mill<br />
113,5 m<br />
10<br />
38,5 m<br />
18,5 m<br />
q<br />
Thracia phaseolina 6<br />
Biomass WW g/m²<br />
0<br />
4<br />
0-1<br />
1-5<br />
10 5-10<br />
2<br />
10-20<br />
Figure 3.8. Abundance (left) <strong>and</strong> biomass (right) of the most abundant mussels found in the 2005 survey.<br />
Note the differences in colour levels.<br />
6<br />
10<br />
6<br />
10<br />
SØREN BOVBJERGS DYB<br />
20<br />
Distances from<br />
center of wind mill<br />
113,5 m<br />
10<br />
38,5 m<br />
18,5 m<br />
q
<strong>Horns</strong> <strong>Rev</strong>. <strong>Benthic</strong> communities Page 47<br />
3.2.1. Structure of the community<br />
When analysing the 2001 to 2004 d<strong>at</strong>a from the autumn surveys in terms of abundance, a<br />
significant difference in community structure was found between the wind farm area in<br />
2001 <strong>and</strong> both the reference <strong>and</strong> wind farm areas in September 2003 <strong>and</strong> 2004 (P=0.017;<br />
P=0.004) (Table 3.9). The most dram<strong>at</strong>ic change was the decline in abundance of Pisione<br />
remota <strong>and</strong> Goniadella bobretzkii from 2001 to 2004. A significant difference was also<br />
found if the same analysis was performed using biomass instead of abundance to express<br />
community structure. Significant changes were also found in community structure between<br />
the wind farm area in September 2003 <strong>and</strong> 2004 (P=0.027), but the reference area<br />
remained unchanged from 2003 to 2004 (P=0.756). The difference in abundance of the<br />
most common species in the wind farm area between 2003 <strong>and</strong> 2004 was caused by an increase<br />
in the most common species of bivalve (Goodallia triangularis) (Table 3.2).<br />
Table 3.9. Level of significance (* P
<strong>Horns</strong> <strong>Rev</strong>. <strong>Benthic</strong> communities Page 48<br />
ANOSIM analysis 1999 1999 2001 2005 2005 2005<br />
Wind farm Reference Wind farm Wind farm Reference Extended reference<br />
1999. Wind farm 0.276 0.002** 0.291 0.419 0.020*<br />
1999. Reference 0.001** 0.153 0.156 0.002**<br />
2001. Wind farm 0.116 0.029* 0.001**<br />
2005. Wind farm 0.238 0.427<br />
2005. Reference 0.573<br />
2005. Extended reference<br />
<strong>Con</strong>cerning the d<strong>at</strong>a from the different spring surveys in terms of abundance, st<strong>at</strong>istically<br />
significance changes were found in the community structure in the wind farm area in 2001<br />
compared to the wind farm area <strong>and</strong> the reference area in 1999 (P=0.002; P=0.001). A decline<br />
in the abundance of the small bristle worm (Pisione remota) <strong>and</strong> the small bivalve<br />
(Goodallia triangularis) was the main reason for the differences found between 1999 <strong>and</strong><br />
2001.<br />
Between 2001 <strong>and</strong> 2005, there was a marked increase in the abundance of Goodallia triangularis<br />
th<strong>at</strong> was most pronounced in the reference area <strong>and</strong> an increase in the abundance<br />
of the bristle worm (Travisia forbesii) (Figure 3.10). However, a marked decrease was<br />
found for the bristle worm (Ophelia borealis) in the wind farm <strong>and</strong> reference area (Figure<br />
3.10). Although differences were found, no unambiguous distribution p<strong>at</strong>terns were found<br />
for Pisione remota <strong>and</strong> Goniadella bobretzkii. No st<strong>at</strong>istically significant differences were<br />
found in the community structure in the reference <strong>and</strong> wind farm areas between 1999 <strong>and</strong><br />
2005 or in the wind farm area between 2001 <strong>and</strong> 2005, whereas a st<strong>at</strong>istically significant<br />
difference in community structure was found between the wind farm area in 2001 <strong>and</strong> the<br />
reference area in 2005 (P=0.029) (Figure 3.10). In 2005, the benthic community in the extended<br />
reference area was comparable with the benthic communities in both the wind farm<br />
area <strong>and</strong> in the reference area, although considerable differences in abundance were found<br />
for most of the dominant species (Table 3.10). St<strong>at</strong>istically significant differences in the<br />
community structure were found between the extended reference area <strong>and</strong> the wind farm<br />
area in 1999 <strong>and</strong> 2001 <strong>and</strong> the reference area in 1999. This was partly explained by the<br />
abundance of Ensis americanus in the exp<strong>and</strong>ed reference area.<br />
Doc. No. 2572-03-005 rev. 4
<strong>Horns</strong> <strong>Rev</strong>. <strong>Benthic</strong> communities Page 49<br />
<strong>Horns</strong> <strong>Rev</strong>, abundance, no/m2<br />
Travisia forbesii<br />
Goniadella bobretzkii<br />
Ensis americanus<br />
Stress: 0,21<br />
Stress: 0,21<br />
Stress: 0,21<br />
1999 WT<br />
1999 Ref<br />
2001 WT<br />
2005 Ref<br />
2005 CS<br />
2005 WT<br />
Stress: 0,21<br />
Goodallia triangularis<br />
Ophelia borealis<br />
Pisione remota<br />
Figure 3.10. Multidimensional scaling (MDS) plots of the abundance of the dominant species in the spring surveyed<br />
areas from 1999 to 2005. Photo 11. Ensis americanus.<br />
Stress: 0,21<br />
Stress: 0,21<br />
Stress: 0,21<br />
Doc. No. 2572-03-005 rev. 4
<strong>Horns</strong> <strong>Rev</strong>. <strong>Benthic</strong> communities Page 50<br />
In 2003 <strong>and</strong> 2004, no significant differences were found between the benthos communities<br />
along the transects 5 m, 25 m <strong>and</strong> 100 m from the edge of the scour protection rel<strong>at</strong>ed to<br />
the possible effect of changes in current regimes from the wind turbine found<strong>at</strong>ions. At<br />
each turbine site, similar community structure was present 5 m, 25 m <strong>and</strong> 100 m from the<br />
found<strong>at</strong>ion.<br />
Local differences in community structure within the wind farm area were also found in<br />
2003 <strong>and</strong> 2004. The community structure <strong>at</strong> turbine site 51 was st<strong>at</strong>istically significant different<br />
from the community structures <strong>at</strong> the other investig<strong>at</strong>ed turbine sites.<br />
Species associ<strong>at</strong>ed with the hard bottom structures <strong>at</strong> the wind farm sites like the slipper<br />
limpet (Crepidula fornic<strong>at</strong>a) <strong>and</strong> the crustaceans (Jassa marmor<strong>at</strong>a <strong>and</strong> Caprella line<strong>at</strong>a)<br />
were occasionally found in the infauna samples.<br />
3.3. Hard bottom substr<strong>at</strong>e<br />
The colonis<strong>at</strong>ion <strong>and</strong> succession of the hard bottom substr<strong>at</strong>e monitored in spring <strong>and</strong> autumn<br />
from 2003-2005 showed rapid coloniz<strong>at</strong>ion of benthic macro algae <strong>and</strong> sessile <strong>and</strong><br />
mobile benthic fauna.<br />
3.3.1. Veget<strong>at</strong>ion<br />
3.3.1.1. Species composition<br />
A total of 26 different species/taxa were found during the monitoring period (Appendix 2).<br />
Of these species, the red algae from the genus Hildenbr<strong>and</strong>ia <strong>and</strong> the green algae from the<br />
genus Ulva are difficult to identify in the field surveys, which might reduce the number of<br />
species in total.<br />
A succession in the species composition was found from 2003 to 2004 with differences<br />
between the individual surveys in spring <strong>and</strong> autumn (Appendix 2.2).Differences in species<br />
composition were also found <strong>at</strong> sampling sites between monopiles <strong>and</strong> scour protections.<br />
At the monopiles, some species like Urospora penicilliformis <strong>and</strong> Blidingia minima<br />
were only found in 2003, whereas the red algae (Polysiphonia fibrillosa <strong>and</strong> Porphyra<br />
umbilicalis) <strong>and</strong> the green algae (Chaetomorpha linum) were only found in 2005. Of<br />
these, Polysiphonia fibrillosa <strong>and</strong> Chaetomorpha linum were the only species also found<br />
on the scour protections. Polysiphonia fibrillosa was found with rel<strong>at</strong>ively high coverage<br />
on the scour protection <strong>at</strong> more turbine sites.<br />
The filamentous brown algae (Pilayella littoralis) was more abundant in the spring surveys<br />
compared to the autumn surveys whereas the green laver (Ulva lactuca) was more<br />
abundant <strong>and</strong> found in higher coverage in the autumn surveys.<br />
The red algae (Coccotylus trunc<strong>at</strong>us <strong>and</strong> Corallina officinalis) were only found on the<br />
scour protections <strong>and</strong> only in low numbers.<br />
3.3.1.2. Structure of the community<br />
Scour protections<br />
On the scour protections, a distinct seasonal vari<strong>at</strong>ion was found. Differences in the species<br />
composition <strong>and</strong> veget<strong>at</strong>ion cover were rel<strong>at</strong>ed to different depth regimes between the<br />
different turbine sites. In general, the veget<strong>at</strong>ion in spring was very sparse <strong>and</strong> often absent<br />
Doc. No. 2572-03-005 rev. 4
<strong>Horns</strong> <strong>Rev</strong>. <strong>Benthic</strong> communities Page 51<br />
<strong>at</strong> turbine sites 33, 55, 58 <strong>and</strong> 95, which are situ<strong>at</strong>ed in deeper w<strong>at</strong>ers compared to turbine<br />
sites 91 <strong>and</strong> 92 (Table 3.11).<br />
The encrusting red algae (Hildenbr<strong>and</strong>ia rubra (Hildenbr<strong>and</strong>iales)) was found rel<strong>at</strong>ively<br />
abundant in 2003 <strong>at</strong> turbine sites 91 <strong>and</strong> 92 <strong>and</strong> sc<strong>at</strong>tered on the stones <strong>at</strong> turbine sites 92<br />
<strong>and</strong> 95 in spring 2004. It was not observed on the scour protections in 2005.<br />
Although sparse, the most abundant veget<strong>at</strong>ion on the scour protection in spring 2003 was<br />
the brown algae (Pilayella littoralis). In spring 2004, the green algae Ulva (Enteromorpha)<br />
was the most dominant but found very sparsely, whereas in spring 2005 the red algae<br />
(Polysiphonia fibrillosa) was most abundant.<br />
In the 2005 autumn, the Ulva (Enteromorpha) <strong>and</strong> especially Ulva lactuca was the most<br />
prominent veget<strong>at</strong>ion with local coverage up to 60%. In 2005, the green algae (Chaetomorpha<br />
linum) was also rel<strong>at</strong>ively numerous. The highest average coverage of Ulva spp.<br />
was found in 2004 (Figure 3.11).<br />
A sc<strong>at</strong>tered <strong>and</strong> a temporal vari<strong>at</strong>ion in the distribution was found for other algae such as<br />
the red algae (Callithamnion corymbosum, Phyllophora pseudoceranoides, Coccotylus<br />
trunc<strong>at</strong>es), the red coral algae (Corallina officinalis) <strong>and</strong> the brown algae (Ectocarpus<br />
spp., Petalonia fascia <strong>and</strong> Desmarestia acule<strong>at</strong>a).<br />
Table 3.11. Groups of veget<strong>at</strong>ion registered <strong>at</strong> the turbine sites in March (S) <strong>and</strong> September (A)during the<br />
surveys from 2003 to 2005.<br />
2003-2005<br />
Turbine site<br />
33 55 58 91<br />
92 95<br />
Actual depth m<br />
9.2-10.8 7.9-8.8 6.3-7.3 5.1-6.0 4.5-5.7 7.0-7.8<br />
Sample time S A S A S A S A S A S A<br />
Red algae 03 03 03 ´05 04 03/04/05 03/04/05 04/05 04/05 04/05<br />
Brown Algae 04 04 03 04/05 03 03/05 03/04 03/05 05<br />
Green algae 03 05 03/04/05 04/05 03/04/05 04/05 03/04/05 04<br />
No veget<strong>at</strong>ion 05 05 03/04/05 04 04 03 03<br />
25<br />
20<br />
15<br />
10<br />
5<br />
0<br />
Rel<strong>at</strong>ive coverage %<br />
Ulva spp.<br />
March 03<br />
Sept. 03<br />
March 04<br />
Sept. 04<br />
March 05<br />
Sept. 05<br />
0-2 m 2-4 m 4-6 m 6-8 m 8-10 m 10-12 m 12-14 m<br />
Distance from monopile<br />
Figure 3.11.The mean rel<strong>at</strong>ive coverage of Ulva (Enteromorpha) spp. along transects on scour protections in 2003-<br />
2005.Photo 12. The green algae Ulva lactuca on the scour protection..<br />
Monopiles<br />
At the monopiles, a distinct seasonal vari<strong>at</strong>ion was found <strong>and</strong> distinct differences in the<br />
species composition <strong>and</strong> veget<strong>at</strong>ion cover were found rel<strong>at</strong>ed to different depth zones.<br />
Doc. No. 2572-03-005 rev. 4
<strong>Horns</strong> <strong>Rev</strong>. <strong>Benthic</strong> communities Page 52<br />
In the splash zone of the monopiles, a dense cover of the filamentous green algae (Urospora<br />
penicilliformis) was only observed in spring 2003 whereas Cladophora was observed<br />
in rel<strong>at</strong>ively low coverage in autumn 2003 <strong>and</strong> autumn 2005. In 2004 <strong>and</strong> 2005, the<br />
veget<strong>at</strong>ion of filamentous algae was generally replaced by a distinct green/brown co<strong>at</strong>ing<br />
of microscopic green algae <strong>and</strong> di<strong>at</strong>oms.<br />
Just bene<strong>at</strong>h the surface to approxim<strong>at</strong>ely 2 metres below the sea surface, r<strong>at</strong>her dense<br />
m<strong>at</strong>s of the filamentous brown algae (Pilayella littoralis/Ectocarpus) were found. The<br />
coverage of Pilayella littoralis was especially high in 2003 <strong>and</strong> 2005 <strong>and</strong> this species was<br />
almost exclusively found in the spring surveys (Figure 3.12). Species of Ulva cl<strong>at</strong>hr<strong>at</strong>a<br />
<strong>and</strong> Ulva prolifera (Enteromorpha spp.) were rel<strong>at</strong>ively domin<strong>at</strong>ing in this zone with the<br />
highest coverage of these species being generally found in the autumn. The green algae<br />
(Ch<strong>at</strong>omorpha linum) <strong>and</strong> the red algae (Polysiphonia fibrillosa) were found <strong>at</strong> most turbine<br />
sites in 2005 with small tufts of the common red porphyra algae (Porphyra umbilicalis)<br />
being found <strong>at</strong> some turbine sites. The seaweeds (Petalonia fascia <strong>and</strong> Petalonia<br />
zosterifolia) were also typically found in this depth zone but in rel<strong>at</strong>ively low coverage.<br />
Veget<strong>at</strong>ion coverage declined with increasing depth, which was pronounced for the most<br />
abundant species, Pilayella littoralis/Ectocarpus <strong>and</strong> Ulva (Enteromorpha) (Figure 3.12),<br />
which were found 4-6 m below the sea surface. In 2005, Ulva lactuca was found 6-8 m<br />
below the sea surface. Petalonia fascia <strong>and</strong> Polysiphonia fibrillosa were occasionally<br />
found 4-6 m <strong>and</strong> 2-4 m below the sea surface.<br />
0-2 m<br />
2-4 m<br />
4-6 m<br />
6-8 m<br />
8-10 m<br />
Ectocarpus/Pilayella Coverage monopiles<br />
March 03<br />
Sept. 03<br />
March 04<br />
Sept. 04<br />
March 05<br />
Sept. 05<br />
0 5 10<br />
Rel<strong>at</strong>ive coverage<br />
15 20<br />
0-2 m<br />
2-4 m<br />
4-6 m<br />
6-8 m<br />
8-10 m<br />
Ulva spp. Coverage monopiles<br />
March 03<br />
Sept. 03<br />
March 04<br />
Sept. 04<br />
March 05<br />
Sept. 05<br />
0 5 10<br />
Rel<strong>at</strong>ive coverage<br />
15 20<br />
Figure 3.12.Depth distribution <strong>and</strong> mean rel<strong>at</strong>ive coverage of filamentous algae (Ectocarpus/Pilayella) <strong>and</strong><br />
Ulva spp. along transects <strong>at</strong> monopiles in 2003-2005.<br />
3.3.2. Epifauna<br />
The total number of species associ<strong>at</strong>ed with the hard bottom structures <strong>at</strong> <strong>Horns</strong> <strong>Rev</strong> has<br />
increased gradually from the first surveys in 2003 to the surveys in 2005.<br />
Of the 111 total invertebr<strong>at</strong>e species registered <strong>and</strong> observed during the monitoring of the<br />
hard bottom structures, only 37 species/taxons could be characteristically found as n<strong>at</strong>ive<br />
infauna or mobile fauna in the area before the establishment of the offshore wind farm <strong>at</strong><br />
<strong>Horns</strong> <strong>Rev</strong>. Only 14 species/taxons were not sampled or identified in the quantit<strong>at</strong>ive<br />
samples. Some of these species were occasionally <strong>and</strong> only observed by divers during the<br />
transect surveys (Appendix 2.1). It was mainly very mobile species such as crabs <strong>and</strong> larger<br />
species like the common whelk. Other very common species, such as the plumose<br />
Doc. No. 2572-03-005 rev. 4
<strong>Horns</strong> <strong>Rev</strong>. <strong>Benthic</strong> communities Page 53<br />
anemone (Metridium senile), the Dahlia anemone (Urticine feline, Sargartia elegans <strong>and</strong><br />
Sargartiogeton lacer<strong>at</strong>es), were often more easily identifiable in the field than in the labor<strong>at</strong>ory<br />
<strong>and</strong> th<strong>at</strong> is why they were only registered in the field surveys. Typical infauna species<br />
such as the thick trough shell (Spisula solida), the American razor shell (Ensis americanus),<br />
the sea pot<strong>at</strong>o (Echinocardium cord<strong>at</strong>um) <strong>and</strong> the bristle worm (Lanice conchilega)<br />
were only observed in the outer periphery of the scour protections.<br />
3.3.2.1. Species composition<br />
Two species of amphipods (Jassa marmor<strong>at</strong>a <strong>and</strong> Caprella linearis 3 ) constituted the most<br />
important species with respect to abundance <strong>at</strong> all turbine sites during the monitoring<br />
campaigns. Jassa marmor<strong>at</strong>a was the most numerous species of the 7 dominant species<br />
th<strong>at</strong> contributed to more than 99% of the total individuals found on the hard bottom substr<strong>at</strong>e<br />
<strong>at</strong> <strong>Horns</strong> <strong>Rev</strong> (Table 3.12). Furthermore, these 7 species generally contributed to<br />
more than 90% of the total biomass registered.<br />
Table 3.12. Distribution p<strong>at</strong>tern found for some typical hard bottom substr<strong>at</strong>e dominants between surveys in<br />
2003, 2004 <strong>and</strong> 2005.<br />
Hard bottom substr<strong>at</strong>e dominants<br />
Abundance ind./m² Abundance ind./m²<br />
Abundance ind./m²<br />
March 2003 September 2003 March 2004 September 2004<br />
March 2005 September 2005<br />
Species Group Mean Rel<strong>at</strong>ive % Mean Rel<strong>at</strong>ive % Mean Rel<strong>at</strong>ive % Mean Rel<strong>at</strong>ive % Mean Rel<strong>at</strong>ive % Mean Rel<strong>at</strong>ive %<br />
Jassa marmor<strong>at</strong>a Crustacean 56,169 86.5 111,891 90.7 95,563 94.0 228,081 91.0 53,076 91.1 258,051 93.0<br />
Caprella linearis Crustacean 927 1.4 9,491 7.7 4,743 4.7 19,119 7.6 3,702 6.4 14,549 5.2<br />
Mytilus edulis Bivalve 4,451 6.9 1,320 1.1 865 0.9 2,206 0.9 869 1.5 3,099 1.1<br />
Balanus cren<strong>at</strong>us Crustacean 2,982 4.6 16 0.0 74 0.1 23 0.0 1 0.0 1 0.0<br />
Asterias rubens Echinoderm 34 0.1 76 0.1 41 0.0 122 0.0 26 0.0 20 0.0<br />
Cancer pagurus Crustacean 4 0.0 78 0.1 7 0.0 350 0.1 17 0.0 310 0.1<br />
Pom<strong>at</strong>oceros triqueter Bristle worm 7 0.0 49 0.0 34 0.0 23 0.0 26 0.0 16 0.0<br />
Total 64,574 99.5 122,921 99.7 101,327 99.7 249,924 99.6 57,717 99 276,047 99<br />
Hard bottom substr<strong>at</strong>e dominants<br />
Biomass ww g/m² Biomass ww g/m²<br />
Biomass ww g/m²<br />
March 2003 September 2003 March 2004 September 2004 March 2005 September 2005<br />
Species Group Mean Rel<strong>at</strong>ive % Mean Rel<strong>at</strong>ive % Mean Rel<strong>at</strong>ive % Mean Rel<strong>at</strong>ive % Mean Rel<strong>at</strong>ive % Mean Rel<strong>at</strong>ive %<br />
Jassa marmor<strong>at</strong>a Crustacean 276.903 29.4 87.724 5.9 234.424 11.9 272.507 17.2 52.016 2.8 312.453 8.0<br />
Caprella linearis Crustacean 6.949 0.7 15.721 1.1 18.326 0.9 42.245 2.7 7.752 0.4 48.044 1.2<br />
Mytilus edulis Bivalve 41.749 4.4 1,132.353 75.8 1,624.208 82.5 1,134.795 71.8 1,683.255 89.6 3,022.707 77.1<br />
Balanus cren<strong>at</strong>us Crustacean 489.612 51.9 0.568 0.0 1.079 0.1 0.670 0.0 0.018 0.0 0.028 0.0<br />
Asterias rubens Echinoderm 67.679 7.2 101.610 6.8 32.657 1.7 36.657 2.3 41.740 2.2 60.595 1.5<br />
Cancer pagurus Crustacean 0.166 0.0 0.267 0.0 0.968 0.0 4.221 0.3 3.033 0.2 113.562 2.9<br />
Pom<strong>at</strong>oceros triqueter Bristle worm 0.154 0.0 0.913 0.1 1.266 0.1 1.103 0.1 1.392 0.1 0.918 0.0<br />
Total 883.212 93.6 1,339.156 89.7 1,912.928 97.2 1,492.198 94.4 1,789.206 95.2 3,558.307 90.7<br />
Hard bottom substr<strong>at</strong>e dominants<br />
Biomass dw g/m² Biomass dw g/m² Biomass dw g/m²<br />
March 2003 September 2003 March 2004 September 2004 March 2005 September 2005<br />
Species Group Mean Rel<strong>at</strong>ive % Mean Rel<strong>at</strong>ive % Mean Rel<strong>at</strong>ive % Mean Rel<strong>at</strong>ive % Mean Rel<strong>at</strong>ive % Mean Rel<strong>at</strong>ive %<br />
Jassa marmor<strong>at</strong>a Crustacean 59.482 14.8 17.740 1.8 42.129 4.7 56.292 6.8 9.966 1.1 50.447 2.5<br />
Caprella linearis Crustacean 1.234 0.3 2.526 0.3 3.563 0.4 7.206 0.9 1.513 0.2 7.816 0.4<br />
Mytilus edulis Bivalve 18.172 4.5 857.701 87.6 815.867 91.5 709.387 85.1 883.713 93.2 1,738.365 87.2<br />
Balanus cren<strong>at</strong>us Crustacean 265.786 66.2 0.364 0.0 0.628 0.1 0.411 0.0 0.009 0.0 0.019 0.0<br />
Asterias rubens Echinoderm 23.774 5.9 29.932 3.1 9.096 1.0 12.744 1.5 10.862 1.1 17.151 0.9<br />
Cancer pagurus Crustacean 0.057 0.0 0.063 0.0 0.332 0.0 1.112 0.1 1.007 0.1 11.170 0.6<br />
Pom<strong>at</strong>oceros triqueter Bristle worm 0.108 0.0 0.599 0.1 0.885 0.1 0.700 0.1 0.880 0.1 0.597 0.0<br />
Total 368.613 91.8 908.925 92.8 872.500 97.9 787.852 94.5 907.950 95.8 1,825.565 91.6<br />
A considerable increase in the total abundance was found from March to September <strong>and</strong><br />
from 2003 to 2005 th<strong>at</strong> mainly reflects the distribution p<strong>at</strong>tern <strong>and</strong> increase in the popul<strong>at</strong>ion<br />
of Jassa marmor<strong>at</strong>a (Figure 3.13). A r<strong>at</strong>her high rel<strong>at</strong>ive abundance was found in<br />
March 2003 for the common mussel (Mytilus edulis) <strong>and</strong> the barnacle (Balanus cren<strong>at</strong>us).<br />
The popul<strong>at</strong>ion of Balanus cren<strong>at</strong>us has decreased dram<strong>at</strong>ically whereas the autumn popul<strong>at</strong>ion<br />
of Mytilus edulis has grown since 2003. This is also partly reflected in the biomass<br />
distribution showing a similar increase from 2003 to 2005 (Table 3.12 <strong>and</strong> Figure 3.13).<br />
The rel<strong>at</strong>ively higher abundance of Mytilus edulis in March 2003 did not result in a correspondingly<br />
higher biomass compared to biomasses found for lesser densities in the rest of<br />
the surveys. The biomass in March 2003 was domin<strong>at</strong>ed by small specimens of Mytilus<br />
edulis, larger specimens of Jassa marmor<strong>at</strong>a, Caprella linearis, Balanus cren<strong>at</strong>us <strong>and</strong> Asterias<br />
rubens (Table 3.13). Growth of Mytilus edulis <strong>and</strong> Cancer pagurus individuals was<br />
demonstr<strong>at</strong>ed by increasing body weights (Figure 3.14). For Mytilus edulis, development<br />
of different cohorts from different spawning periods was also an indic<strong>at</strong>ion of growth<br />
3<br />
A review has shown th<strong>at</strong> some specimens could be identified as Caprella mutica, an alien species introduced<br />
from northeast Asia.<br />
Doc. No. 2572-03-005 rev. 4
<strong>Horns</strong> <strong>Rev</strong>. <strong>Benthic</strong> communities Page 54<br />
(Figure 3.14). Lengths in the popul<strong>at</strong>ion of Mytilus edulis increased from a maximum of<br />
10 mm in March 2003 to a maximum of 75 mm in September 2005. Differences between<br />
spring <strong>and</strong> autumn surveys <strong>and</strong> the gradually approxim<strong>at</strong>ion to steady levels of body size<br />
reflects n<strong>at</strong>ural breeding <strong>and</strong> succession in the popul<strong>at</strong>ions of Jassa marmor<strong>at</strong>a <strong>and</strong><br />
Caprella linearis.<br />
<strong>Con</strong>siderable differences were found in the abundance <strong>and</strong> biomass between the individual<br />
turbine sites of the dominant species, which was evident by the distribution p<strong>at</strong>tern of<br />
Mytilus edulis. Popul<strong>at</strong>ions of Mytilus edulis were basically well established <strong>at</strong> turbine<br />
sites 55, 58 <strong>and</strong> especially <strong>at</strong> 95 by the end of the monitoring period. At turbine sites 33,<br />
91 <strong>and</strong> 92, only very young <strong>and</strong> newly settled mussels were registered.<br />
300000<br />
250000<br />
200000<br />
150000<br />
100000<br />
50000<br />
0<br />
No/m² Abundance<br />
March<br />
September<br />
2003 2004 2005<br />
a<br />
100<br />
90<br />
80<br />
70<br />
60<br />
50<br />
40<br />
30<br />
20<br />
10<br />
0<br />
% Abundance<br />
b<br />
March 03<br />
Sept. 03<br />
March 04<br />
Sept. 04<br />
March 05<br />
Sept. 05<br />
Figure 3.13.Abundance <strong>at</strong> hard bottom substr<strong>at</strong>e a) Surveys. b) Rel<strong>at</strong>ive abundance of dominant species.<br />
4000<br />
3000<br />
2000<br />
1000<br />
0<br />
100<br />
90<br />
80<br />
70<br />
60<br />
50<br />
40<br />
30<br />
20<br />
10<br />
0<br />
WW g/m² Biomass<br />
March<br />
September<br />
2003 2004 2005<br />
% Biomass WW<br />
March 03<br />
Sept. 03<br />
March 04<br />
Sept. 04<br />
March 05<br />
Sept. 05<br />
a<br />
c<br />
2000<br />
1800<br />
1600<br />
1400<br />
1200<br />
1000<br />
800<br />
600<br />
400<br />
200<br />
0<br />
DW g/m²<br />
March<br />
September<br />
2003 2004 2005<br />
Jassa marmor<strong>at</strong>a<br />
Caprella linearis<br />
Mytilus edulis<br />
Balanus cren<strong>at</strong>us<br />
Asterias rubens<br />
Cancer pagurus<br />
Pom<strong>at</strong>oceros triqueter<br />
Jassa marmor<strong>at</strong>a<br />
Caprella linearis<br />
Mytilus edulis<br />
Balanus cren<strong>at</strong>us<br />
Asterias rubens<br />
Cancer pagurus<br />
Pom<strong>at</strong>oceros triqueter<br />
Biomass<br />
Figure 3.14.Biomass <strong>at</strong> hard bottom substr<strong>at</strong>e a) Surveys wet weight. b) Surveys dry weight. c) Rel<strong>at</strong>ive biomass<br />
of dominant species.* Differences between the wet <strong>and</strong> dry biomass distribution were mainly caused<br />
by the differences in the rel<strong>at</strong>ive proportion between species with shells (barnacles <strong>and</strong> mussels) <strong>and</strong><br />
without shells (amphipods).<br />
Doc. No. 2572-03-005 rev. 4<br />
b
<strong>Horns</strong> <strong>Rev</strong>. <strong>Benthic</strong> communities Page 55<br />
Table 3.13. Development of mean individual body weight (ww) of typical hard bottom substr<strong>at</strong>e dominants.<br />
Hard bottom substr<strong>at</strong>e dominants<br />
Mean individual weight mg (ww)<br />
March 2003 September 2003 March 2004 September 2004 March 2005 September 2005<br />
Species Group Mean Mean Mean Mean Mean Mean<br />
Jassa marmor<strong>at</strong>a Crustacean 4.9 0.8 2.5 1.2 1.0 1.2<br />
Caprella linearis Crustacean 7.5 1.7 3.9 2.2 2.1 3.3<br />
Mytilus edulis Bivalve 9.4 857.8 1,877.7 514.4 1,937.1 975.2<br />
Balanus cren<strong>at</strong>us Crustacean 164.2 35.5 14.6 29.1 19.1 29.2<br />
Asterias rubens Echinoderm 1,990.6 1,337.0 796.5 300.5 1,633.6 3,018.3<br />
Cancer pagurus Crustacean 41.5 3.4 138.3 12.1 181.3 366.1<br />
Pom<strong>at</strong>oceros triqueter Bristle worm 22.0 18.6 37.2 48.0 52.6 56.4<br />
2003 Spring<br />
Number<br />
Number<br />
2500<br />
2000<br />
1500<br />
1000<br />
500<br />
2500<br />
2000<br />
1500<br />
1000<br />
500<br />
2004 Spring<br />
Number<br />
Number<br />
1000<br />
750<br />
500<br />
250<br />
0<br />
1000<br />
750<br />
500<br />
250<br />
Mytilus edulis<br />
Turbine 55 Turbine 58 Turbine 95<br />
Turbine 91 Turbine 92<br />
0 5 10 15<br />
Length (mm)<br />
Mytilus edulis<br />
0 5 10 15<br />
Length (mm)<br />
Turbine 55 Turbine 58 Turbine 95<br />
Turbine 33 Turbine 91 Turbine 92<br />
0<br />
0 20 40 60<br />
Length (mm)<br />
2005 Spring<br />
Number<br />
Number<br />
150<br />
100<br />
50<br />
0<br />
150<br />
100<br />
50<br />
Mytilus edulis<br />
0 20 40 60<br />
Length (mm)<br />
0 20 40 60<br />
Length (mm)<br />
TurbineM55 TurbineM58 TurbineM95<br />
TurbineM33 TurbineM91 TurbineM92<br />
0<br />
0 20 40 60<br />
Length (mm)<br />
0 20 40 60<br />
Length (mm)<br />
0 20 40 60<br />
Length (mm)<br />
2003 Autumn<br />
Number<br />
Number<br />
2500<br />
2000<br />
1500<br />
1000<br />
500<br />
2500<br />
2000<br />
1500<br />
1000<br />
500<br />
Mytilus edulis<br />
Turbine 55 Turbine 58 Turbine 95<br />
Turbine 33 Turbine 91 Turbine 92<br />
0 10 20 30 40<br />
Length (mm)<br />
2004 Autumn<br />
Number<br />
Number<br />
4,000<br />
3,000<br />
2,000<br />
1,000<br />
4,000<br />
3,000<br />
2,000<br />
1,000<br />
Mytilus edulis<br />
0 10 20 30 40<br />
Length (mm)<br />
0 10 20 30 40<br />
Length (mm)<br />
Turbine 55 Turbine 58 Turbine 95<br />
Turbine 33 Turbine 91 Turbine 92<br />
0 20 40 60<br />
Length (mm)<br />
2005 Autumn<br />
Number<br />
3000<br />
2000<br />
1000<br />
0<br />
Mytilus edulis<br />
0 20 40 60<br />
Length (mm)<br />
0 20 40 60<br />
Length (mm)<br />
Turbine 55 Turbine 58 Turbine 95<br />
Turbine 33 Turbine 91 Turbine 92<br />
0<br />
0 25 50 75<br />
Length (mm)<br />
Figure 3.15.Length frequency diagram of the common mussel Mytilus edulis.<br />
Number<br />
3000<br />
2000<br />
1000<br />
0 25 50 75<br />
Length (mm)<br />
0 25 50 75<br />
Length (mm)<br />
Doc. No. 2572-03-005 rev. 4
<strong>Horns</strong> <strong>Rev</strong>. <strong>Benthic</strong> communities Page 56<br />
3.3.2.2. Structure of the community<br />
St<strong>at</strong>istically significant differences (P
<strong>Horns</strong> <strong>Rev</strong>. <strong>Benthic</strong> communities Page 57<br />
Table 3.14. Abundance <strong>and</strong> biomass distribution p<strong>at</strong>tern found for typical hard bottom dominants on the scour<br />
protections <strong>at</strong> <strong>Horns</strong> <strong>Rev</strong> in 2003-2005.<br />
Abundance ind./m²<br />
2003 2004<br />
2005<br />
Found<strong>at</strong>ions<br />
March September March September<br />
March September<br />
Species Group Mean Rel<strong>at</strong>ive % Mean Rel<strong>at</strong>ive % Mean Rel<strong>at</strong>ive % Mean Rel<strong>at</strong>ive % Mean Rel<strong>at</strong>ive % Mean Rel<strong>at</strong>ive %<br />
Jassa marmor<strong>at</strong>a Crustacean 25,663 89.0 31,571 92.4 34,854 96.6 97,911 97.4 48,579 98.4 101,683 94.7<br />
Caprella linearis Crustacean 591 2.0 1,937 5.7 718 2.0 1,590 1.6 189 0.4 2,794 2.6<br />
Mytilus edulis Bivalve 1,583 5.5 124 0.4 199 0.6 150 0.1 133 0.3 1,177 1.1<br />
Balanus cren<strong>at</strong>us Crustacean 674 2.3 11 0.0 6 0.0 14 0.0 0 0.0 2 0.0<br />
Asterias rubens Echinoderm 50 0.2 89 0.3 65 0.2 159 0.2 40 0.1 24 0.0<br />
Cancer pagurus Crustacean 1 0.0 21 0.1 0 0.0 205 0.2 2 0.0 293 0.3<br />
Pom<strong>at</strong>oceros triqueter Bristle worm 4 0.0 19 0.1 14 0.0 20 0.0 26 0.1 17 0.0<br />
Total 28,566 99.0 33,771 98.8 35,856 99.4 100,049 99.6 48,968 99.2 105,990 98.7<br />
Biomass ww g/m²<br />
2003 2004 2005<br />
Found<strong>at</strong>ions<br />
March September March September March September<br />
Species Group Mean Rel<strong>at</strong>ive % Mean Rel<strong>at</strong>ive % Mean Rel<strong>at</strong>ive % Mean Rel<strong>at</strong>ive % Mean Rel<strong>at</strong>ive % Mean Rel<strong>at</strong>ive %<br />
Jassa marmor<strong>at</strong>a Crustacean 104.661 32.7 36.344 18.4 134.526 57.7 167.691 61.8 59.774 33.7 187.974 35.9<br />
Caprella linearis Crustacean 3.345 1.0 5.008 2.5 5.534 2.4 4.507 1.7 2.326 1.3 6.327 1.2<br />
Mytilus edulis Bivalve 3.296 1.0 1.100 0.6 0.251 0.1 0.313 0.1 0.110 0.1 2.093 0.4<br />
Balanus cren<strong>at</strong>us Crustacean 148.528 46.3 0.666 0.3 0.116 0.0 0.922 0.3 0.013 0.0 0.051 0.0<br />
Asterias rubens Echinoderm 51.485 16.1 71.867 36.4 45.480 19.5 38.091 14.0 47.517 26.8 41.497 7.9<br />
Cancer pagurus Crustacean 0.036 0.0 0.094 0.0 0.003 0.0 2.326 0.9 0.094 0.1 1.907 0.4<br />
Pom<strong>at</strong>oceros triqueter Bristle worm 0.066 0.0 0.285 0.1 0.305 0.1 0.658 0.2 1.056 0.6 0.964 0.2<br />
Total 311.418 97.2 115.364 58.5 186.216 79.8 214.508 79.0 110.892 62.4 240.813 46.0<br />
Biomass dw g/m²<br />
2003 2004 2005<br />
Found<strong>at</strong>ions<br />
March September March September March September<br />
Species Group Mean Rel<strong>at</strong>ive % Mean Rel<strong>at</strong>ive % Mean Rel<strong>at</strong>ive % Mean Rel<strong>at</strong>ive % Mean Rel<strong>at</strong>ive % Mean Rel<strong>at</strong>ive %<br />
Jassa marmor<strong>at</strong>a Crustacean 27.222 16.6 11.247 17.0 33.357 50.7 38.100 53.2 11.676 25.4 32.493 28.6<br />
Caprella linearis Crustacean 0.722 0.4 1.386 2.1 1.934 2.9 0.768 1.1 0.907 2.0 1.094 1.0<br />
Mytilus edulis Bivalve 1.450 0.9 0.635 1.0 0.149 0.2 0.165 0.2 0.048 0.1 1.102 1.0<br />
Balanus cren<strong>at</strong>us Crustacean 114.570 69.9 0.562 0.8 0.086 0.1 0.635 0.9 0.008 0.0 0.035 0.0<br />
Asterias rubens Echinoderm 17.202 10.5 29.630 44.8 16.613 25.2 11.981 16.7 13.359 29.0 12.696 11.2<br />
Cancer pagurus Crustacean 0.015 0.0 0.026 0.0 0.001 0.0 0.616 0.9 0.029 0.1 0.435 0.4<br />
Pom<strong>at</strong>oceros triqueter Bristle worm 0.042 0.0 0.205 0.3 0.293 0.4 0.449 0.6 0.727 1.6 0.669 0.6<br />
Total 161.225 98.4 43.691 66.0 52.432 79.6 52.713 73.6 26.754 58.1 48.525 42.7<br />
St<strong>at</strong>istically significant differences (P
<strong>Horns</strong> <strong>Rev</strong>. <strong>Benthic</strong> communities Page 58<br />
Although no distinct distribution p<strong>at</strong>terns in abundance <strong>and</strong> biomass could be shown for<br />
the any of the most abundant species, st<strong>at</strong>istically significant differences in community<br />
structures between different zones on the scour protection <strong>at</strong> different distances from the<br />
monopile were found (Figure 3.18 <strong>and</strong> Table 3.15). Gradually overlapping zones with<br />
similarities in community structures were found within 2 metres of the monopile, whereas<br />
the community structure in zone closest to the monopile was st<strong>at</strong>istically significant different<br />
from the community structures closer to the periphery of the scour protections. No<br />
differences in the community structure were found between the NNE <strong>and</strong> the SSW sites<br />
with respect to current regimes.<br />
In the transect surveys, no significant differences between the NNE <strong>and</strong> SSW transects<br />
were found. In general, as in the quantit<strong>at</strong>ive samples, st<strong>at</strong>istical differences were also<br />
found between the st<strong>at</strong>ions close to the monopile <strong>and</strong> st<strong>at</strong>ions <strong>at</strong> the edge of the scour protection.<br />
Close to the edge of the scour protections, no st<strong>at</strong>istical differences were shown<br />
between st<strong>at</strong>ions across the zones with different size of stones. Three overlapping zones on<br />
the scour protections were identified. One distinct zone covered the distance from the monopiles<br />
to 10 m from the piles, the second zone covered the distance from 6 m to 12 m <strong>and</strong><br />
the last zone covered the distance from 10 m to 16 m from the monopile. The coverage<br />
<strong>and</strong> frequency of Jassa marmor<strong>at</strong>a, Metridium senile <strong>and</strong> Cancer pagurus decreased towards<br />
the edge of the scour protection while the occurrence of the s<strong>and</strong> dwelling bristle<br />
worm (Lanice conchilega) <strong>at</strong> the outer edge of the scour protections contributed to the difference<br />
between the zones. The sea anemone (Sargartiogeton lacer<strong>at</strong>us) was less frequent<br />
close to the monopiles <strong>and</strong> <strong>at</strong> the periphery of the scour protections compared to the zone<br />
2-10 metres from the monopiles.<br />
Scour protections, spring Scour protections, autumn<br />
Jassa marmor<strong>at</strong>a<br />
Stress: 0.2<br />
Stress: 0.2<br />
2003<br />
2004<br />
2005<br />
Jassa marmor<strong>at</strong>a<br />
Mytilus edulis Mytilus edulis<br />
Stress: 0.23<br />
Stress: 0.23<br />
2003<br />
2004<br />
2005<br />
Doc. No. 2572-03-005 rev. 4
<strong>Horns</strong> <strong>Rev</strong>. <strong>Benthic</strong> communities Page 59<br />
Asterias rubens<br />
Stress: 0.2<br />
Stress: 0.2<br />
Asterias rubens<br />
Stress: 0.23<br />
Stress: 0.23<br />
Figure 3.17.MDS plots of rel<strong>at</strong>ive abundance on scour protections concerning differences between different<br />
sampling campaigns.<br />
Doc. No. 2572-03-005 rev. 4
<strong>Horns</strong> <strong>Rev</strong>. <strong>Benthic</strong> communities Page 60<br />
160000<br />
120000<br />
80000<br />
40000<br />
0<br />
2500<br />
2000<br />
1500<br />
1000<br />
500<br />
0<br />
400<br />
300<br />
200<br />
100<br />
0<br />
No/m²<br />
No/m²<br />
No/m²<br />
Jassa marmor<strong>at</strong>a<br />
A 0.5 NNE B 2 NNE C 5 NNE D 5 SSW<br />
Distance<br />
Mytilus edulis<br />
A 0.5 NNE B 2 NNE C 5 NNE D 5 SSW<br />
Distance<br />
Cancer pagurus<br />
A 0.5 NNE B 2 NNE C 5 NNE D 5 SSW<br />
Distance<br />
600<br />
500<br />
400<br />
300<br />
200<br />
100<br />
0<br />
250<br />
200<br />
150<br />
100<br />
50<br />
0<br />
WW g/m²<br />
No/m²<br />
A 0.5 NNE B 2 NNE C 5 NNE D 5 SSW<br />
Distance<br />
Asterias rubens<br />
A 0.5 NNE B 2 NNE C 5 NNE D 5 SSW<br />
Distance<br />
March 03<br />
Sept. 03<br />
March 04<br />
Sept. 04<br />
March 05<br />
Sept. 05<br />
Biomass<br />
Figure 3.18.Distribution p<strong>at</strong>tern on the scour protections <strong>at</strong> different distances from the monopiles shown as<br />
average abundance <strong>and</strong> average biomass.<br />
The number of edible juvenile crabs (Cancer pagurus) has increased significantly since<br />
2003 with local densities being found up to 700 ind./m 2 in 2005. Small specimens were<br />
more abundantly found in autumn than in spring (Figure 3.18). <strong>During</strong> the transect surveys,<br />
m<strong>at</strong>ure edible crabs with carapace width up to 18-20 cm could frequently be observed<br />
in crevices <strong>and</strong> holes between the stones on the scour protections.<br />
Besides the dominant species, the o<strong>at</strong>en pipe hydroid (Tubularia indivisia) was frequently<br />
found on the scour protections, whereas other typical epifauna species such as the sponge<br />
(Halichondria panicea) <strong>and</strong> the broyzoan (Flustra foliacea) <strong>and</strong> the hydrozoan (Sertularia<br />
cupressina) were less frequently found. Sertularia cupressina has become more common<br />
in 2005. Records of low numbers of the ross worm (Sabellaria spinulosa) were made on<br />
the scour protection in 2005.<br />
Doc. No. 2572-03-005 rev. 4
<strong>Horns</strong> <strong>Rev</strong>. <strong>Benthic</strong> communities Page 61<br />
Juveniles of other more mobile epifauna species such as the long legged spider crab<br />
(Macropodium rostr<strong>at</strong>a), the common shore crab, the masked crab (Corystes cassivelaunus),<br />
the bristly crab (Pilumnus hirtellus) <strong>and</strong> the northern sea urchin (Strongylocentrotus<br />
droebachiensis) were occasionally recorded on the scour protections. Green egg<br />
masses of bristle worms (Phyllodocidae), probably Phyllodoce groenl<strong>and</strong>ica, <strong>and</strong> eggs of<br />
sea slugs <strong>at</strong>tached to stones were frequently recorded on the scour protections in the spring<br />
surveys. Adult specimens of the sea slugs (Facelina bostoniensis, Polycera quadriline<strong>at</strong>a,<br />
Aeolidiae papillosa <strong>and</strong> Onchidoris muric<strong>at</strong>a) were rel<strong>at</strong>ively abundant <strong>and</strong> frequently recorded<br />
feeding on their preys Tubularia indivisa, Electra pilosa, sea anemones <strong>and</strong> bryozoans.<br />
Table 3.15. Level of significance (**P
<strong>Horns</strong> <strong>Rev</strong>. <strong>Benthic</strong> communities Page 62<br />
Table 3.16. Abundance <strong>and</strong> biomass distribution p<strong>at</strong>tern found for typical hard bottom dominants <strong>at</strong> the monopiles<br />
<strong>at</strong> <strong>Horns</strong> <strong>Rev</strong> in 2003-2005.<br />
Abundance ind./m²<br />
2003 2004 2005<br />
Mono-piles<br />
March September March September March September<br />
Species Group Mean Rel<strong>at</strong>ive % Mean Rel<strong>at</strong>ive % Mean Rel<strong>at</strong>ive % Mean Rel<strong>at</strong>ive % Mean Rel<strong>at</strong>ive % Mean Rel<strong>at</strong>ive %<br />
Jassa marmor<strong>at</strong>a Crustacean 94,113 85.4 208,303 90.4 168,413 93.3 350,029 89.7 51,681 84.8 445,693 92.5<br />
Caprella linearis Crustacean 1,312 1.2 18,568 8 9,573 5.3 34,527 8.8 6,804 11.2 28,655 5.9<br />
Mytilus edulis Bivalve 8,497 7.7 2,755 1.2 1,664 0.9 4,017 1.0 1,509 2.5 5,406 1.1<br />
Balanus cren<strong>at</strong>us Crustacean 5,469 5.0 23 0.0 155 0.1 30 0.0 2 0.0 0 0.0<br />
Asterias rubens Echinoderm 14 0.0 63 0.0 13 0.0 71 0.0 9 0.0 15 0.0<br />
Cancer pagurus Crustacean 8 0.0 146 0.1 14 0.0 456 0.1 30 0.0 331 0.1<br />
Pom<strong>at</strong>oceros triqueter Bristle worm 9 0.0 86 0.0 59 0.0 24 0.0 24 0.0 15 0.0<br />
Total 109,423 99.3 229,943 99.8 179,891 99.7 389,154 99.7 60,058 98.6 480,115 99.7<br />
Biomass ww g/m²<br />
2003 2004 2005<br />
Mono-piles<br />
March September March September March September<br />
Species Group Mean Rel<strong>at</strong>ive % Mean Rel<strong>at</strong>ive % Mean Rel<strong>at</strong>ive % Mean Rel<strong>at</strong>ive % Mean Rel<strong>at</strong>ive % Mean Rel<strong>at</strong>ive %<br />
Jassa marmor<strong>at</strong>a Crustacean 532.775 28.9 147.139 4.8 374.105 9.2 377.889 13.4 38.484 1.1 461.828 5.8<br />
Caprella linearis Crustacean 11.651 0.6 30.239 1.0 35.567 0.9 75.294 2.7 12.317 0.4 98.105 1.2<br />
Mytilus edulis Bivalve 96.737 5.3 2,489.926 80.9 3,572.985 87.6 2,143.190 76.2 3,179.371 94.2 6,647.444 83.1<br />
Balanus cren<strong>at</strong>us Crustacean 895.916 48.7 0.519 0.0 2.238 0.1 0.343 0.0 0.033 0.0 0.000 0.0<br />
Asterias rubens Echinoderm 96.158 5.2 154.747 5.0 21.942 0.5 34.643 1.2 31.326 0.9 83.512 1.0<br />
Cancer pagurus Crustacean 0.390 0.0 0.478 0.0 2.125 0.1 5.647 0.2 5.636 0.2 247.549 3.1<br />
Pom<strong>at</strong>oceros triqueter Bristle worm 0.245 0.0 1.784 0.1 2.460 0.1 1.425 0.1 1.572 0.0 0.863 0.0<br />
Total 1,633.873 88.7 2,824.831 91.8 4,011.421 98.3 2,638.431 93.9 3,268.739 96.9 7,539.301 94.2<br />
Biomass dw g/m²<br />
2003 2004 2005<br />
Mono-piles<br />
March September March September March September<br />
Species Group Mean Rel<strong>at</strong>ive % Mean Rel<strong>at</strong>ive % Mean Rel<strong>at</strong>ive % Mean Rel<strong>at</strong>ive % Mean Rel<strong>at</strong>ive % Mean Rel<strong>at</strong>ive %<br />
Jassa marmor<strong>at</strong>a Crustacean 105.784 14.5 31.046 1.5 72.464 3.8 73.812 4.8 7.149 0.4 71.991 1.7<br />
Caprella linearis Crustacean 2.050 0.3 4.742 0.2 6.946 0.4 12.845 0.8 1.951 0.1 15.881 0.4<br />
Mytilus edulis Bivalve 40.596 5.6 1,886.231 89.6 1,794.776 93.8 1,339.789 86.6 1,669.187 95.6 3,823.081 90.0<br />
Balanus cren<strong>at</strong>us Crustacean 441.405 60.4 0.312 0.0 1.284 0.1 0.141 0.0 0.017 0.0 0.000 0.0<br />
Asterias rubens Echinoderm 35.604 4.9 45.594 2.2 5.488 0.3 12.092 0.8 7.158 0.4 22.497 0.5<br />
Cancer pagurus Crustacean 0.131 0.0 0.111 0.0 0.730 0.0 1.485 0.1 1.872 0.1 24.052 0.6<br />
Pom<strong>at</strong>oceros triqueter Bristle worm 0.177 0.0 1.114 0.1 1.711 0.1 0.874 0.1 0.936 0.1 0.511 0.0<br />
Total 625.747 85.7 1,969.150 93.5 1,883.398 98.5 1,441.037 93.1 1,688.271 96.7 3,958.012 93.2<br />
500000<br />
400000<br />
300000<br />
200000<br />
100000<br />
0<br />
No/m² Abundance<br />
March<br />
September<br />
2003 2004 2005<br />
Figure 3.19.Abundance (a) <strong>and</strong> biomass (b) distribution from 2003-2005.<br />
a<br />
9000<br />
8000<br />
7000<br />
6000<br />
5000<br />
4000<br />
3000<br />
2000<br />
1000<br />
0<br />
WW g/m² Biomass<br />
March<br />
September<br />
2003 2004 2005<br />
St<strong>at</strong>istically significant differences (P
<strong>Horns</strong> <strong>Rev</strong>. <strong>Benthic</strong> communities Page 63<br />
Monopiles, spring Monopiles, autumn<br />
Jassa marmor<strong>at</strong>a<br />
Mytilus edulis<br />
Asterias rubens<br />
Stress: 0.12<br />
Stress: 0.12<br />
Stress: 0.12<br />
Stress: 0.12<br />
2003<br />
2004<br />
2005<br />
Jassa marmor<strong>at</strong>a<br />
Mytilus edulis<br />
Asterias rubens<br />
Stress: 0.15<br />
Stress: 0.15<br />
Stress: 0.15<br />
Stress: 0.15<br />
Figure 3.20.MDS plots of rel<strong>at</strong>ive abundance <strong>at</strong> monopiles concerning differences between different sampling<br />
campaigns.<br />
2003<br />
2004<br />
2005<br />
Doc. No. 2572-03-005 rev. 4
<strong>Horns</strong> <strong>Rev</strong>. <strong>Benthic</strong> communities Page 64<br />
No/m²<br />
20000<br />
18000<br />
16000<br />
14000<br />
12000<br />
10000<br />
8000<br />
6000<br />
4000<br />
2000<br />
0<br />
mg DW<br />
1400<br />
1200<br />
1000<br />
800<br />
600<br />
400<br />
200<br />
0<br />
Abundance Mytilus edulis, spring<br />
Turbine 55<br />
Turbine 58<br />
Turbine 95<br />
2003 2004 2005<br />
Average body weight Mytilus edulis, spring<br />
2003 2004 2005<br />
a<br />
c<br />
11000<br />
10000<br />
9000<br />
8000<br />
7000<br />
6000<br />
5000<br />
4000<br />
3000<br />
2000<br />
1000<br />
0<br />
mg DW<br />
1400<br />
1200<br />
1000<br />
800<br />
600<br />
400<br />
200<br />
0<br />
No/m² Abundance Mytilus edulis, autumn<br />
2003 2004 2005<br />
Average body weight Mytilus edulis, autumn<br />
2003 2004 2005<br />
Figure 3.21.Average abundance <strong>and</strong> average body weight of Mytilus edulis <strong>at</strong> monopiles <strong>at</strong> turbine sites 55, 58<br />
<strong>and</strong> 95.<br />
A distinct zon<strong>at</strong>ion was observed in the fauna communities in rel<strong>at</strong>ion to different depth<br />
zones. The community structure in two distinct zones, 0-1 metres <strong>and</strong> 1-3 metres below<br />
the sea surface, were significantly different (P0.05) <strong>and</strong> an increase was<br />
found in the similarity from 2003 to 2005 in the community structure between the zones<br />
from 3 metres below the sea surface to the zone <strong>at</strong> the bottom of the monopiles. The st<strong>at</strong>istical<br />
analysis has generally shown no differences (P>0.05) between the sampling <strong>at</strong> the<br />
two sides, NNE <strong>and</strong> SSW, of the monopiles concerning current regimes, except for 2005<br />
where a significant difference in the community structure <strong>at</strong> the bottom between each side<br />
of the monopile was found.<br />
A distinct distribution p<strong>at</strong>tern of the giant midge (Telm<strong>at</strong>ogeton japonicus) was observed<br />
in the green algal m<strong>at</strong>s in the splash zone of most of the wind turbines, except wind turbine<br />
95 in March 2003. In March 2003, the abundance of Telm<strong>at</strong>ogeton japonicus was estim<strong>at</strong>ed<br />
<strong>at</strong> 1,000-2,800 ind./m 2 in the splash zone. In autumn 2005, the density of Telm<strong>at</strong>ogeton<br />
japonicus in the splash zone was 4,400 ind./m 2 . The midge was found in the samples<br />
from September 2003 <strong>and</strong> in all depth zones, although it was significantly more<br />
abundant in depth zone 0-1 metres below the sea surface compared to other depth zones.<br />
Although low in numbers, it was also registered <strong>at</strong> turbine 95 in September 2003. Highest<br />
average densities were found in September 2004 (Figure 3.22). With an average individual<br />
body weight of less than 2.05 mg(dw), this species contributed inconsiderably to the<br />
main biomass from the monopile samples.<br />
Doc. No. 2572-03-005 rev. 4<br />
b<br />
d
<strong>Horns</strong> <strong>Rev</strong>. <strong>Benthic</strong> communities Page 65<br />
0 m<br />
0-1 m<br />
1-3 m<br />
3-5 m<br />
5-7 m<br />
>7 m<br />
Telm<strong>at</strong>ogeton japonicus<br />
March 03<br />
Sept. 03<br />
March 04<br />
Sept. 04<br />
March 05<br />
Sept. 05<br />
0 500 1000 1500<br />
No/m²<br />
2000 2500<br />
Figure 3.22.Depth distribution of Telm<strong>at</strong>ogeton japonicus<br />
<strong>at</strong> the monopiles<br />
Photo 14. Larvae tubes of Telm<strong>at</strong>ogeton japonicus<br />
(green dots inside white spots) in the splash<br />
zone <strong>at</strong> a monopile found<strong>at</strong>ion.<br />
In spring 2003, a pronounced initial settlement of barnacles (Balanus cren<strong>at</strong>us <strong>and</strong> B.<br />
balanus) was found <strong>at</strong> the monopiles, which almost was restricted to the upper zones just<br />
bene<strong>at</strong>h the sea surface (Figure 3.23). A drastic decline in the abundance of barnacles <strong>and</strong><br />
especially of Balanus cren<strong>at</strong>us was found from 2003 to 2005.<br />
0 m<br />
0-1 m<br />
1-3 m<br />
3-5 m<br />
5-7 m<br />
>7 m<br />
Balanus cren<strong>at</strong>us<br />
March 03<br />
Sept. 03<br />
March 04<br />
Sept. 04<br />
March 05<br />
Sept. 05<br />
0 2000 4000 6000 8000<br />
No/m²<br />
10000 12000 14000<br />
0 m<br />
0-1 m<br />
1-3 m<br />
3-5 m<br />
5-7 m<br />
>7 m<br />
Balanus balanus<br />
0 500 1000 1500 2000 2500<br />
No/m²<br />
Figure 3.23.Depth distribution of the barnacles Balanus cren<strong>at</strong>us <strong>and</strong> Balanus balanus <strong>at</strong> the monopiles.<br />
March 03<br />
Sept. 03<br />
March 04<br />
Sept. 04<br />
March 05<br />
Sept. 05<br />
In spring 2003, the settlement of Mytilus edulis sp<strong>at</strong> was more or less evenly distributed<br />
between the depth zones, whereas the mussels were generally most abundant in the depth<br />
zone closest to the sea surface. Compared to this zone coverage, abundance <strong>and</strong> biomass<br />
of mussels were reduced in the lover depth zones (Figure 3.24). Locally <strong>at</strong> turbine site 95<br />
in 2004, the mussels were found with 100% coverage in very high densities of more than<br />
90,000 ind./m 2 <strong>and</strong> with a corresponding biomass of more than 22,000 g(dw)/m 2 . In 2005,<br />
the abundance found <strong>at</strong> turbine site 95 was less but the biomass had increased locally to<br />
more than 32,000 g(dw)/m 2 <strong>and</strong> to an average of more than 10,000 g(dw)/m 2 . This was a<br />
result of an increase in the average body weight in this zone from 2003 to 2005 (Figure<br />
3.25). At lower depth zones the average body weight was less than 3.5 mg(dw).<br />
Doc. No. 2572-03-005 rev. 4
<strong>Horns</strong> <strong>Rev</strong>. <strong>Benthic</strong> communities Page 66<br />
0 m<br />
0-1 m<br />
1-3 m<br />
3-5 m<br />
5-7 m<br />
>7 m<br />
Mytilus edulis<br />
0 4000 8000 12000<br />
No/m²<br />
16000 20000<br />
March 03<br />
Sept. 03<br />
March 04<br />
Sept. 04<br />
March 05<br />
Sept. 05<br />
0 m<br />
0-1 m<br />
1-3 m<br />
3-5 m<br />
5-7 m<br />
>7 m<br />
Mytilus edulis<br />
a b<br />
0 2000 4000 6000<br />
DW g/m²<br />
8000 10000<br />
Figure 3.24.Depth distribution of abundance (a) <strong>and</strong> biomass, dw, (b) of Mytilus edulis <strong>at</strong> the monopiles.<br />
March 03<br />
Sept. 03<br />
March 04<br />
Sept. 04<br />
March 05<br />
Sept. 05<br />
In 2003, numerous species of Asterias rubens were observed just underne<strong>at</strong>h the zone with<br />
Mytilus edulis feeding on the mussels. This was especially characteristic in September,<br />
where large Asterias rubens were found in the samples domin<strong>at</strong>ing the biomass. As a result<br />
of the pred<strong>at</strong>ion of Asterias rubens, large numbers of empty shells of Mytilus edulis<br />
were often observed <strong>at</strong> the seabed close to the turbine towers.<br />
0-1 m<br />
1-3 m<br />
3-5 m<br />
5-7 m<br />
>7 m<br />
Mytilus edulis<br />
March 03<br />
Sept. 03<br />
March 04<br />
Sept. 04<br />
March 05<br />
Sept. 05<br />
0 500 1000 1500 2000 2500 3000<br />
Average body weight mg DW<br />
a<br />
3000<br />
2500<br />
2000<br />
1500<br />
1000<br />
500<br />
0<br />
mg DW<br />
Mytilus edulis<br />
Depth zone 1-3 m<br />
March<br />
September<br />
2003 2004<br />
Year<br />
2005<br />
Figure 3.25.Average body weight (dw) of Mytilus edulis <strong>at</strong> different depth zones (a) <strong>and</strong> <strong>at</strong> depth zone 1-3 metres<br />
<strong>at</strong> different sampling campaigns (b).<br />
In general, Jassa marmor<strong>at</strong>a was more frequently found in the mid zone 1-5 metres with<br />
an average coverage of more than 40% (Figure 3.26). Based on the average body weight<br />
found in spring 2003, mainly large <strong>and</strong> m<strong>at</strong>ure specimens were found to have colonized<br />
the monopiles in 2002/2003. The average body weight for Jassa marmor<strong>at</strong>a was 1.2<br />
mg(dw) in spring 2003 compared to 0.40 mg(dw) <strong>and</strong> 0.16 mg(dw) in spring 2004 <strong>and</strong><br />
spring 2005, respectively. The depth distribution of the largest specimens follows the main<br />
abundance distribution except in the spring 2003 where the largest specimens were found<br />
in the upper depth zone.<br />
Doc. No. 2572-03-005 rev. 4<br />
b
<strong>Horns</strong> <strong>Rev</strong>. <strong>Benthic</strong> communities Page 67<br />
0 m<br />
0-1 m<br />
1-3 m<br />
3-5 m<br />
5-7 m<br />
>7 m<br />
0-1 m<br />
1-3 m<br />
3-5 m<br />
5-7 m<br />
>7 m<br />
Jassa marmor<strong>at</strong>a<br />
0 100000 200000 300000 400000 500000 600000<br />
No/m²<br />
Jassa marmor<strong>at</strong>a<br />
March 03<br />
Sept. 03<br />
March 04<br />
Sept. 04<br />
March 05<br />
Sept. 05<br />
0.0 0.2 0.4 0.6 0.8 1.0 1.2 1.4 1.6 1.8<br />
Average body weight mg DW<br />
0 m<br />
0-1 m<br />
1-3 m<br />
3-5 m<br />
5-7 m<br />
>7 m<br />
Jassa marmor<strong>at</strong>a<br />
a b<br />
c<br />
March 03<br />
Sept. 03<br />
March 04<br />
Sept. 04<br />
March 05<br />
Sept. 05<br />
0 20 40 60 80<br />
g/m² DW<br />
100 120 140<br />
Jassa marmor<strong>at</strong>a<br />
Figure 3.26.Depth distribution of abundance (a), biomass, dw, (b) <strong>and</strong> average body weight (dw) of Jassa marmor<strong>at</strong>a<br />
<strong>at</strong> the monopiles (c)<br />
the distribution of Caprella linearis showed a similar p<strong>at</strong>tern th<strong>at</strong> was found for Jassa<br />
marmor<strong>at</strong>a, although it was much less frequent with a maximum coverage of 10% (Figure<br />
3.27). Mainly large <strong>and</strong> m<strong>at</strong>ure specimens were also found to have colonized the monopiles<br />
in 2002/2003. The average body weight for Caprella linearis was 1.47 mg(dw) in<br />
spring 2003 compared to 0.87 mg(dw) <strong>and</strong> 0.34 mg(dw) in spring 2004 <strong>and</strong> spring 2005,<br />
respectively.<br />
0 m<br />
0-1 m<br />
1-3 m<br />
3-5 m<br />
5-7 m<br />
>7 m<br />
Caprella linearis<br />
March 03<br />
Sept. 03<br />
March 04<br />
Sept. 04<br />
March 05<br />
Sept. 05<br />
0 10000 20000 30000 40000<br />
No/m²<br />
50000 60000 70000<br />
Figure 3.27.Depth distribution of Caprella linearis <strong>at</strong> the<br />
monopiles.<br />
Photo 15. Initial coloniz<strong>at</strong>ion of Jassa marmor<strong>at</strong>a <strong>at</strong> a<br />
monopile 2003.<br />
Doc. No. 2572-03-005 rev. 4
<strong>Horns</strong> <strong>Rev</strong>. <strong>Benthic</strong> communities Page 68<br />
Even though the edible crab (Cancer pagurus) only constituted less than 1% of the total<br />
abundance, this species showed some interesting characteristics. In March, Cancer pagurus<br />
generally showed a very sc<strong>at</strong>tered distribution; although juveniles were registered in<br />
rel<strong>at</strong>ively low numbers <strong>at</strong> all depth zones <strong>at</strong> the monopiles, larger individuals were less<br />
frequently observed by divers along the transect surveys than in the September surveys. In<br />
September large numbers of juveniles were found in all depth zones <strong>at</strong> the monopiles<br />
(Figure 3.27). The highest mean abundance of 950 ind./m 2 was found in depth zone 1-3 m<br />
in September 2004 <strong>and</strong> abundances over 1,900 ind./m 2 were registered <strong>at</strong> turbine site 55.<br />
From 2003 to 2005, a considerable increase in total biomass was found for Cancer pagurus,<br />
which was a result of increasing abundance <strong>and</strong> an increase in average individual<br />
body weight from 1.52 mg(dw) in September 2003 to 44.16 mg(dw) in September 2005.<br />
The average individual body weight of the initial popul<strong>at</strong>ion of Cancer pagurus <strong>at</strong> the<br />
monopiles in March 2003 was 17.52 mg(dw). In March 2005, three size classes of juvenile<br />
crabs were found. One probably representing the 0 group from 5-11 mm, the second representing<br />
the 1+ group from 20-23 mm <strong>and</strong> the third probably representing the 2+ group<br />
from approxim<strong>at</strong>ely 40 mm.<br />
0 m<br />
0-1 m<br />
1-3 m<br />
3-5 m<br />
5-7 m<br />
>7 m<br />
Cancer pagurus<br />
March 03<br />
Sept. 03<br />
March 04<br />
Sept. 04<br />
March 05<br />
Sept. 05<br />
0 100 200 300 400 500 600 700 800<br />
No/m²<br />
Figure 3.28.Depth distribution of Cancer pagurus <strong>at</strong> the<br />
monopiles.<br />
Photo 16. Adult Cancer pagurus <strong>at</strong> the scour protection..<br />
Juveniles of other crab species like the masked crab (Corystes cassivelaunus), the long<br />
clawed porcelain crab (Pisidia longicornis) <strong>and</strong> the bristly crab (Pilumnus hirtellus) were<br />
occasionally found on the monopiles. Also juveniles of the northern sea urchin (Strongylocentrotus<br />
droebachiensis) were found in low numbers.<br />
Only an insignificant contribution to the total biomass of less than 0.5% was made by the<br />
sea anemones Metridium senile, Sargartia elegans, Sargartiogeton lacer<strong>at</strong>us <strong>and</strong> Urticina<br />
feline, although they all were found on the monopiles. They were locally found in a combined<br />
coverage up to 45% with a biomass (dw) contribution of more than 50%. The most<br />
common was Metridium senile <strong>and</strong> the combined coverage of the sea anemones increased<br />
<strong>at</strong> the monopiles with increasing depth.<br />
Rel<strong>at</strong>ively high coverage in all depth zones <strong>at</strong> the monopiles, locally up to 50%, were also<br />
found for the o<strong>at</strong>en pipes hydroid (Tubularia indivisa). The pred<strong>at</strong>or of this species, the<br />
sea slug (Facelina bostoniensis), together with other sea slugs Polycera quadriline<strong>at</strong>a,<br />
Aeolidiae papillosa <strong>and</strong> Onchidoris muric<strong>at</strong>a were rel<strong>at</strong>ively abundant <strong>and</strong> frequently recorded.<br />
Doc. No. 2572-03-005 rev. 4
<strong>Horns</strong> <strong>Rev</strong>. <strong>Benthic</strong> communities Page 69<br />
3.3.3. Fish<br />
Table 3.17. Fish species observed during the surveys in 2003-2005.<br />
Common name Scientific name<br />
2003 2004 2005<br />
Number of sites Max. Abundance Number of sites Max. Abundance Number of sites Max. Abundance<br />
European spr<strong>at</strong> Spr<strong>at</strong>tus spr<strong>at</strong>tus 1 O<br />
Atlantic cod Gadus morhua 6 R 2 R 5 R<br />
Bib (Pouting) Trisopterus luscus 4 R 3 R 3 R<br />
Whiting Merlangus merlangus 2 O<br />
Pollock (Saithe) Pollachius virens 1 O 1 O 3 R<br />
Broad-nosed pipefish Syngn<strong>at</strong>hus typhle 1 O<br />
Shorthorn sculpin Myoxocephalus scorpius 5 R 4 R 4 R<br />
Hooknose Agonus c<strong>at</strong>aphractus 5 R 4 O 1 O<br />
Longspined bullhead Taurulus bubaris 2 O 1 O<br />
Horse mackerel Trachurus trachurus 2 R<br />
Stribed red mullet Mullus surmuletus 1 O<br />
Ballan wrasse Labrus bergylta 1 O<br />
Corkwing wrasse Symphodus melops 6 R<br />
Goldsinny-wrasse Ctenolabrus rupestris 1 R 6 ∞ 6 ∞<br />
Lumpsucker Cyclopteus lumpus 1 O<br />
Viviparous blenny Zoarces viviparous 2 R 1 O<br />
Small s<strong>and</strong>eel Ammodytes tobianus 2 O 1 ∞<br />
Rock gunnel Pholis gunnellus 6 R 6 R 6 ∞<br />
Dragonet Callionymus lyra 5 O 3 R<br />
S<strong>and</strong> goby Pom<strong>at</strong>oschistus minutus 4 ∞ 6 ∞ 2 O<br />
Painted goby Pom<strong>at</strong>oschistus pictus 2 R<br />
A total of 22 species have been registered during the surveys on the hard bottom substr<strong>at</strong>e<br />
<strong>at</strong> the <strong>Horns</strong> <strong>Rev</strong> Offshore Wind Farm since the erection of the wind turbines in 2002. Besides<br />
the fish observed in the area close to the turbine structures inclusive of the scour protections,<br />
as presented in Table 3.17, Atlantic mackerel (Scomber scombrus) were observed<br />
in the area between the turbines in 2004. Whiting was only caught during in the test fishing<br />
in 2003 <strong>and</strong> not observed by the divers.<br />
Photo 17. Bib (pouting) Trisopterus luscus. Photo 18. Atlantic cod Gadus morhua.<br />
Photo 19. Goldsinny-wrasse Ctenolabrus rupestris. Photo 20. Goldsinny-wrasse Ctenolabrus rupestris<br />
<strong>and</strong> the edible crab Cancer pagurus.<br />
Doc. No. 2572-03-005 rev. 4
<strong>Horns</strong> <strong>Rev</strong>. <strong>Benthic</strong> communities Page 70<br />
Two species, goldsinny-wrasse <strong>and</strong> rock gunnel, were often found in numbers <strong>at</strong> the turbine<br />
sites whereas bib <strong>and</strong> shoals of Atlantic cod were most often occasionally found foraging<br />
on the scour protection. In the test fishing, more cod <strong>and</strong> bib were caught in 2005<br />
compared to 2003 <strong>and</strong> 2004. The majority of fish <strong>and</strong> fish species were observed during<br />
the autumn surveys.<br />
In 2004, the broad-nosed pipefish (Syngn<strong>at</strong>hus typhle) was observed. This species is typically<br />
found in areas with veget<strong>at</strong>ion.<br />
Doc. No. 2572-03-005 rev. 4
<strong>Horns</strong> <strong>Rev</strong>. <strong>Benthic</strong> communities Page 71<br />
4. Discussion<br />
4.1. N<strong>at</strong>ural p<strong>at</strong>terns in distribution <strong>and</strong> abundance<br />
4.1.1.1. Sediment<br />
The <strong>Horns</strong> <strong>Rev</strong> area is n<strong>at</strong>urally a highly dynamic area with respect to hydrography th<strong>at</strong> is<br />
influenced by tide, strong currents <strong>and</strong> domin<strong>at</strong>ed by waves. In the r<strong>at</strong>her shallow area <strong>at</strong><br />
the wind farm site, the sediment dynamics are highly influenced by the hydrographic<br />
conditions, migr<strong>at</strong>ing bed forms <strong>and</strong> constantly re-suspension <strong>and</strong> reworking of the sediment.<br />
<strong>Con</strong>siderable sp<strong>at</strong>ial <strong>and</strong> temporal vari<strong>at</strong>ions in the sediment characteristics were found.<br />
Gre<strong>at</strong> vari<strong>at</strong>ions <strong>and</strong> a general st<strong>at</strong>istically significant increase in median grain size was<br />
found in the wind farm area from 1999, before the establishment of the wind farm, to<br />
2005, after the wind farm had been in oper<strong>at</strong>ion for three years. No detailed inform<strong>at</strong>ion of<br />
sediment variability in local shallow areas of the North Sea exists. Seasonal <strong>and</strong> sp<strong>at</strong>ial<br />
changes as well as vari<strong>at</strong>ions in grain size parameters in the wind farm area were interpreted<br />
as n<strong>at</strong>ural vari<strong>at</strong>ions because no st<strong>at</strong>istical differences in grain size distribution between<br />
different areas outside <strong>and</strong> inside the wind farm area were found.<br />
4.1.1.2. Infauna<br />
Due to the highly variable environmental conditions <strong>and</strong> the high variability in sediment<br />
parameters, the community structure within regional shallow s<strong>and</strong>bank areas, such as<br />
<strong>Horns</strong> <strong>Rev</strong>, display high sp<strong>at</strong>ial <strong>and</strong> temporal variability <strong>and</strong> heterogeneity (Vanosmael et<br />
al. 1982; Salzwedel et al. 1985; Degraer et al. 1999).<br />
<strong>Con</strong>siderable <strong>and</strong> st<strong>at</strong>istically significant changes in the community structure were found<br />
in the infauna community in the wind farm area from 2001 to 2003 <strong>and</strong> 2004, although no<br />
changes were found in the community structure between 1999 <strong>and</strong> 2005. In general, no<br />
st<strong>at</strong>istically significant changes were found in abundance <strong>and</strong> biomass distributions from<br />
1999 to 2005 for most of the design<strong>at</strong>ed indic<strong>at</strong>or organisms.<br />
The vari<strong>at</strong>ion in temporal <strong>and</strong> sp<strong>at</strong>ial distribution p<strong>at</strong>terns were interpreted as n<strong>at</strong>ural<br />
vari<strong>at</strong>ions as similar distribution p<strong>at</strong>terns were found in reference areas. Gre<strong>at</strong> variability<br />
in the distribution p<strong>at</strong>tern was also found for the commercially important bivalve Spisula<br />
solida, which is a common species in the North Sea. Recruitment of Spisula solida is often<br />
very irregular. This species has a preference for sediments with a grain size of 200-300<br />
µm, which might explain the decline in abundance from 1999 <strong>and</strong> 2001 (Sab<strong>at</strong>ini, 2004).<br />
4.2. Effects from the wind farm<br />
4.2.1. <strong>Con</strong>struction<br />
4.2.1.1. Pile driving activities<br />
The most immedi<strong>at</strong>e impact during construction on benthic communities might have been<br />
habit<strong>at</strong> disturbance arising from pile driving activities resulting in lethal effects, sub lethal<br />
effects or increased exposure of infauna species to pred<strong>at</strong>ors in close vicinity of the wind<br />
turbine sites. Highly mobile epibenthic species like the edible crab (Cancer pagurus) <strong>and</strong><br />
the brown shrimp (Crangon crangon) might have escaped from the piling sites. A fast<br />
Doc. No. 2572-03-005 rev. 4
<strong>Horns</strong> <strong>Rev</strong>. <strong>Benthic</strong> communities Page 72<br />
colonis<strong>at</strong>ion of Cancer pagurus to the introduced hard substr<strong>at</strong>es was interpreted negligible<br />
impact from the piling activities on the popul<strong>at</strong>ion of Cancer pagurus. No investig<strong>at</strong>ions<br />
were made on the impacts from pile driving activities or from cable laying activities<br />
to the benthic communities.<br />
4.2.1.2. Introduction of hard bottom substr<strong>at</strong>es<br />
The most significant effect from the construction of the offshore wind farm was the loss of<br />
habit<strong>at</strong>s <strong>and</strong> the introduction of hard substr<strong>at</strong>e habit<strong>at</strong>s into a community exclusively<br />
domin<strong>at</strong>ed by infauna in s<strong>and</strong>y sediments.<br />
The fauna communities on the introduced hard substr<strong>at</strong>es are completely different from<br />
the infauna community as existed <strong>at</strong> the wind turbine sites prior to the erection of the wind<br />
turbines <strong>and</strong> the establishment of the scour protections. At the turbine sites, new habit<strong>at</strong>s<br />
were introduced th<strong>at</strong> changed the substr<strong>at</strong>es from pure s<strong>and</strong> to found<strong>at</strong>ions of steel, gravel<br />
<strong>and</strong> stones. A typical epifaunal community has replaced the n<strong>at</strong>ive infaunal community<br />
th<strong>at</strong> is characteristic of s<strong>and</strong>banks in the North Sea.<br />
<strong>During</strong> the 2003 to 2005 surveys <strong>at</strong> the introduced hard substr<strong>at</strong>es, all of the larger mobile<br />
epifaunal species previously observed were found. Except for the brown shrimp (Crangon<br />
crangon), the larger species were generally found more frequently <strong>and</strong> in higher numbers.<br />
More members found in the infauna Goniadella-Spisula community, typical for the infauna<br />
community <strong>at</strong> the <strong>Horns</strong> <strong>Rev</strong> area, were registered <strong>at</strong> the hard bottom substr<strong>at</strong>e <strong>at</strong> the<br />
turbine found<strong>at</strong>ions.<br />
The hard substr<strong>at</strong>es after construction of the wind farm were used as h<strong>at</strong>chery or nursery<br />
grounds for several species, which was an especially successful nursery for the edible crab<br />
(Cancer pagurus). The number <strong>and</strong> biomass of Cancer pagurus juveniles <strong>at</strong> the turbine<br />
sites has increased markedly from 2003 to 2005. Juveniles of the edible crab were especially<br />
found in large numbers on the monopiles in autumn with larger individuals often<br />
observed in caves <strong>and</strong> crevices among stones on the scour protection. More size classes of<br />
Cancer pagurus were found in March 2005. The growth of Cancer pagurus individuals<br />
were demonstr<strong>at</strong>ed from September 2003 to September 2005 indic<strong>at</strong>ing th<strong>at</strong> juvenile edible<br />
crabs utilise the turbine found<strong>at</strong>ions as nursery grounds. It is likely th<strong>at</strong> Cancer pagurus<br />
larvae <strong>and</strong> juveniles rapidly invade the hard substr<strong>at</strong>es from the breeding areas. Cancer<br />
pagurus females normally breed buried in s<strong>and</strong> in deeper areas of the North Sea <strong>and</strong> can<br />
be buried for months after m<strong>at</strong>ing. Juveniles settle in l<strong>at</strong>e summer/ early autumn <strong>and</strong> remain<br />
there until they reach a carapace width of 6-7 cm, which takes about 3 years, before<br />
they move to subtidal areas (Neal & Wilson, 2005). It is possible th<strong>at</strong> the juveniles in size<br />
class 2+ with carapace widths of approxim<strong>at</strong>ely 4 cm were about 2 years old <strong>at</strong> <strong>Horns</strong> <strong>Rev</strong><br />
. The average body weight of the juveniles found in the initial popul<strong>at</strong>ion in March 2003<br />
were higher than the average body weight of the juveniles found in March 2004 indic<strong>at</strong>ing<br />
th<strong>at</strong> the hard bottom substr<strong>at</strong>es were initially colonized by <strong>at</strong> least some young crabs <strong>and</strong><br />
not only by larvae. Further m<strong>at</strong>ure specimens were initially found <strong>and</strong> studies off the<br />
Dutch coast have also shown th<strong>at</strong> m<strong>at</strong>ure individuals of Cancer pagurus quickly invaded<br />
newly established artificial reefs (Leewis & Hallie, 2000).<br />
Doc. No. 2572-03-005 rev. 4
<strong>Horns</strong> <strong>Rev</strong>. <strong>Benthic</strong> communities Page 73<br />
Photo 21. Cancer pagurus Photo 22. Egg masses of the bristle worm Phyllodoce<br />
groenl<strong>and</strong>ica.<br />
The hard substr<strong>at</strong>e <strong>at</strong> <strong>Horns</strong> <strong>Rev</strong> is probably also an important nursery ground for other<br />
crab species like the masked crab (Corystes cassivelaunus) <strong>and</strong> probably also for the<br />
northern sea urchin (Strongylocentrotus droebachiensis) as both species were found as<br />
juveniles. Verific<strong>at</strong>ion th<strong>at</strong> more species are breeding on the hard substr<strong>at</strong>es was shown as<br />
egg masses of the bristle worm (Phyllodoce groenl<strong>and</strong>ica), the common whelk (Buccinum<br />
und<strong>at</strong>um) <strong>and</strong> different sea slugs were found frequently in spring.<br />
Photo 23. Common mussel Mytilus edulis <strong>at</strong><br />
monopile structures.<br />
Photo 24. Common starfish Asterias rubens.<br />
Within newly established heterogeneous habit<strong>at</strong>s such as the hard substr<strong>at</strong>es structures <strong>at</strong><br />
<strong>Horns</strong> <strong>Rev</strong>, recruitment variability <strong>and</strong> pred<strong>at</strong>ion will influence the abundance of individuals<br />
<strong>and</strong> community structure of epibenthic assemblages (Glassier, 1979; Chiba & Noda,<br />
2000: Worm et al., 2002), which often result in st<strong>at</strong>istical differences in abundance <strong>and</strong><br />
diversity between sites. Mosaics of sessile organisms form the faunal assemblages <strong>at</strong> each<br />
turbine site with the general faunal assemblages <strong>at</strong> all turbine sites <strong>at</strong> <strong>Horns</strong> <strong>Rev</strong> being<br />
highly variable <strong>and</strong> shown to be different. It was also shown <strong>at</strong> <strong>Horns</strong> <strong>Rev</strong> th<strong>at</strong> pred<strong>at</strong>ion,<br />
especially from the starfish (Asterias rubens), was one of the main factors to the dram<strong>at</strong>ic<br />
changes in the fouling communities between sites. A discrepancy in the abundance of<br />
Mytilus edulis <strong>and</strong> Asterias rubens was also shown. This keystone pred<strong>at</strong>or controlling the<br />
area distribution, vertical distribution, popul<strong>at</strong>ion abundance <strong>and</strong> size distribution of the<br />
prey target Mytilus edulis was probably also the main controller of the barnacles. Mytilus<br />
edulis was only found as juveniles on the scour protections with evident cohorts of more<br />
Doc. No. 2572-03-005 rev. 4
<strong>Horns</strong> <strong>Rev</strong>. <strong>Benthic</strong> communities Page 74<br />
gener<strong>at</strong>ions of the common mussels. Larger individuals of mussels were mainly found on<br />
a few monopiles th<strong>at</strong> often were on banisters outside the reach of the starfish. In 2005,<br />
successful establishment of Mytilus edulis was found <strong>at</strong> more turbine sites than previously<br />
demonstr<strong>at</strong>ed by growth in the popul<strong>at</strong>ion. Other studies have shown th<strong>at</strong> Asterias rubens<br />
often is the “keystone” pred<strong>at</strong>or controlling the vertical distribution <strong>and</strong> abundance in littoral<br />
<strong>and</strong> sublittoral mussel beds (Saier, 2001). M<strong>at</strong>ure starfish are mainly feeding upon larger<br />
mussels whereas smaller starfish are feeding on smaller mussels <strong>and</strong> barnacles. A considerably<br />
higher number of starfish, mainly more juveniles, were found in 2004 compared<br />
to 2003 <strong>and</strong> 2005. In 2004, this resulted in a drastic decline in the abundance of the barnacle<br />
Balanus cren<strong>at</strong>us compared to 2003. In 2005, almost no Balanus cren<strong>at</strong>us was found<br />
<strong>and</strong> this species is also known as an initial colonizing species (White, 2004).<br />
Photo 25. Shells of Balanus cren<strong>at</strong>us <strong>and</strong> the<br />
northern sea urchin Strongylocentrotus<br />
droebachiensis <strong>at</strong> monopile 2003.<br />
Photo 26. Initial coloniz<strong>at</strong>ion of Balanus cren<strong>at</strong>us<br />
<strong>and</strong> Jassa marmor<strong>at</strong>us.<br />
Differences were also found in the epibenthic assemblages between vertical structures<br />
such as monopiles <strong>and</strong> horizontal structures such as scour protections. Studies on shipwrecks<br />
in the North Sea have also shown some differences between communities on vertical<br />
<strong>and</strong> horizontal structures (Leewis et al., 2000). A distinct zon<strong>at</strong>ion <strong>and</strong> marked change<br />
was observed in the epifouling communities <strong>at</strong> the monopiles. The splash or wash zone<br />
was characterised by marked changes in the veget<strong>at</strong>ion cover <strong>and</strong> species composition.<br />
The splash or wash zone was also composed of dense m<strong>at</strong>s of green algae (Urospora penicilliformis)<br />
in 2003 whereas, in 2004 <strong>and</strong> 2005, the veget<strong>at</strong>ion cover was replaced by a<br />
co<strong>at</strong>ing of microscopic green algae <strong>and</strong> di<strong>at</strong>oms. The almost monoculture popul<strong>at</strong>ion of<br />
the “giant” midge (Telm<strong>at</strong>ogeton japonicus) has increased markedly since 2003 by grazing<br />
on this co<strong>at</strong>ing. Telm<strong>at</strong>ogeton japonicus, first recorded <strong>at</strong> <strong>Horns</strong> <strong>Rev</strong> in 2003 (Leonhard<br />
<strong>and</strong> Pedersen, 2004), was hitherto not recorded in Denmark. This midge was probably introduced<br />
to Western Europe where it was recorded in 1962 <strong>at</strong> Kiel (Germany) (Remmert,<br />
1963) <strong>and</strong> is now known from the Baltic coastal regions of Germany <strong>and</strong> Pol<strong>and</strong> (Ashe<br />
<strong>and</strong> Cranston, 1990; Murray, 1999). Personal observ<strong>at</strong>ions of Telm<strong>at</strong>ogeton japonicus<br />
shows th<strong>at</strong> this species is widely distributed <strong>and</strong> very numerous on boulders <strong>at</strong> breakw<strong>at</strong>ers<br />
<strong>and</strong> coast defence structures all over Denmark.<br />
In the upper part of the monopile in the littoral zone, the community was partly characterised<br />
by a high number of common mussels (Mytilus edulis), the green algae Ulva (Enteromorpha)<br />
spp., Ulva intestinalis, Ulva linza <strong>and</strong> Ulva lactuca <strong>and</strong> the brown algae<br />
Petalonia fascia <strong>and</strong> Petalonia zosterifolia. Also, the barnacle Balanus balanus <strong>and</strong> filamentous<br />
brown algae Pilayella litoralis <strong>and</strong> Ectocarpus were very common, often domin<strong>at</strong>ing<br />
in this zone. Compared to 2003, a drastically reduced dominance of Balanus cren<strong>at</strong>us<br />
was found <strong>at</strong> the monopiles in 2004 <strong>and</strong> 2005. A succession in the veget<strong>at</strong>ion was<br />
Doc. No. 2572-03-005 rev. 4
<strong>Horns</strong> <strong>Rev</strong>. <strong>Benthic</strong> communities Page 75<br />
found introducing new species <strong>at</strong> the monopiles from 2003. The red algae Polysiphonia<br />
fibrillosa, the purple laver Porphyra umbilicalis <strong>and</strong> the green algae Chaetomorpha linum<br />
were introduced <strong>at</strong> the l<strong>at</strong>est in 2005.<br />
Photo 27. Polysiphonia fibrillose Photo 28. Chaetomorpha linum.<br />
Apparently a more or less permanent veget<strong>at</strong>ion of different species of green algae (Ulva<br />
spp.) replaced the initial veget<strong>at</strong>ion cover of filamentous algae . A succession in the veget<strong>at</strong>ion<br />
cover of green algae <strong>at</strong> the monopiles was increasing with depth from 2003.<br />
A dense layer of tube m<strong>at</strong>s was found from the upper sublittoral zone to the scour protection<br />
of the tube dwelling amphipod Jassa marmor<strong>at</strong>a. Jassa marmor<strong>at</strong>a, often covering<br />
the total substr<strong>at</strong>e surface completely, was the most significant species recorded on the<br />
hard bottom substr<strong>at</strong>e <strong>at</strong> <strong>Horns</strong> <strong>Rev</strong>. The cosmopolitan Jassa marmor<strong>at</strong>a was not recorded<br />
in Denmark until 2003; although comprehensive studies on stone reefs in the K<strong>at</strong>teg<strong>at</strong> <strong>and</strong><br />
elsewhere in Denmark were conducted (Lundsteen, 2000; Dahl et al., 2004). Tube dwelling<br />
amphipods (Jassa sp.) were found domin<strong>at</strong>ing the epifauna communities <strong>at</strong> artificially<br />
submerged structures in the North Sea (Leewis & Hallie, 2000; Leewis et al., 2000). Jassa<br />
marmor<strong>at</strong>a was found in numbers on artificial hard substr<strong>at</strong>um in the Mediterranean<br />
(Athanasios & Chariton, 2000) <strong>and</strong> USA (Duffy & Hay, 2000). Although Jassa marmor<strong>at</strong>a<br />
was found <strong>at</strong> <strong>Horns</strong> <strong>Rev</strong> in very high densities, more than 1 mil./m 2 , this species was<br />
recorded in even higher densities of up to 8 mil./m 2 in other studies (Tish, 2003).<br />
Due to the large abundance, Jassa marmor<strong>at</strong>a might contribute significantly to the diet of<br />
a number of other invertebr<strong>at</strong>es <strong>and</strong> vertebr<strong>at</strong>es including fish <strong>and</strong> pred<strong>at</strong>ors such as the<br />
edible crab, the common shore crab <strong>and</strong> the harbour crab. The diet of the bib (Trisopterus<br />
luscus) consists of small crustaceans (www.fishbase.org 4 ). Together with Jassa marmor<strong>at</strong>a,<br />
the skeleton shrimp (Caprella linearis) was found in high numbers. A marked increase<br />
in abundance of these two dominant species was shown from 2003 to 2005 with<br />
changes in popul<strong>at</strong>ion structures measured by individual body weight, which might be a<br />
result of a popul<strong>at</strong>ion regul<strong>at</strong>ion process. In the m<strong>at</strong>erial of Caprella linearis, some specimens<br />
appears to have been misidentified <strong>and</strong> evidently belong to Caprella mutica<br />
4 Froese, R. <strong>and</strong> D. Pauly. Editors. 2006.FishBase.World Wide Web electronic public<strong>at</strong>ion. Version<br />
(03/2006). <strong>Con</strong>tains inform<strong>at</strong>ion of more than 29,300 Species, 217,200 Common names, 41,500 Pictures <strong>and</strong><br />
38,200 References.<br />
Doc. No. 2572-03-005 rev. 4
<strong>Horns</strong> <strong>Rev</strong>. <strong>Benthic</strong> communities Page 76<br />
(Schurin), an alien species introduced to the Atlantic Ocean from the Siberian coast of the<br />
Sea of Japan (Willis et al., 2004).<br />
In the lower zone <strong>at</strong> the monopiles, the keelworm (Pom<strong>at</strong>oceros triqueter) was more<br />
abundant than in the upper zones <strong>and</strong> has decreased in abundance since September 2003.<br />
Pom<strong>at</strong>oceros triqueter is predomin<strong>at</strong>ely a sublittoral species <strong>and</strong> considered to be an initial<br />
fouling organism making use of available space quickly (Crisp, 1965; Burnell et al.,<br />
1991). So the apparent stagn<strong>at</strong>ion in popul<strong>at</strong>ion size of Pom<strong>at</strong>oceros triqueter might be<br />
the result of competition for space from other species. The initial colonizer, hydrozoan<br />
Tubularia indivisa, displayed a r<strong>at</strong>her fluctu<strong>at</strong>ing distribution p<strong>at</strong>tern <strong>and</strong> was less abundant<br />
in 2004 compared to 2003. This could be a result of lack of space or pred<strong>at</strong>ion from<br />
the sea slugs, among others Facelina bostoniensis, which is new to the <strong>Horns</strong> <strong>Rev</strong> fauna in<br />
2004. In other studies on artificial reefs, Tubularia indivisa could be found on the substr<strong>at</strong>es<br />
a few weeks after deployment <strong>and</strong> together with the hydrozoans Campanularidae<br />
were considered to be a pioneer community (Leewis & Hallie, 2000; Leewis et al., 2000).<br />
More species, such as the plumose anemone (Metridium senile), the sea anemones Sargartia<br />
troglodytes <strong>and</strong> species of Sargartiogeton, the dead man’s finger (Alcyonium digit<strong>at</strong>um),<br />
the sea slug (Polycera quadriline<strong>at</strong>a) <strong>and</strong> the bryozoan (Electra pilosa), were<br />
found colonizing deployed hard substr<strong>at</strong>es in other parts of the North Sea (Leewis & Hallie,<br />
2000) <strong>and</strong> were also found colonizing the turbine found<strong>at</strong>ions <strong>at</strong> <strong>Horns</strong> <strong>Rev</strong>.<br />
Photo 29. The o<strong>at</strong>en pipes hydroid Tubularia indivisa. Photo 30. The sea slug Facelina bostoniensis.<br />
Photo 31. The sea slug Aeolidia papillosa. Photo 32. The sea slug Polycera quadriline<strong>at</strong>a.<br />
Doc. No. 2572-03-005 rev. 4
<strong>Horns</strong> <strong>Rev</strong>. <strong>Benthic</strong> communities Page 77<br />
Due to high current, wave action or s<strong>and</strong> scouring, the epifouling community will be<br />
elimin<strong>at</strong>ed from the substr<strong>at</strong>e, leaving place for new settlements, which was observed by<br />
divers. More of the species found on the hard substr<strong>at</strong>e <strong>at</strong> Horn <strong>Rev</strong>, such as Sertularia<br />
cupressina, Flustra foliacea <strong>and</strong> Alcyonium digit<strong>at</strong>um, are typical for s<strong>and</strong> scoured habit<strong>at</strong>s<br />
c<strong>at</strong>egorised as “slightly scoured circalittoral rock” (Tyler-Walters, 2002). This together<br />
with impacts from pred<strong>at</strong>ion will contribute to a continuously repe<strong>at</strong>ing succession<br />
process until a more or less stabile community will be reached. Studies have indic<strong>at</strong>ed<br />
(Leewis et al., 2000; Leewis <strong>and</strong> Hallie, 2000) th<strong>at</strong> community stability in fouling communities<br />
is not <strong>at</strong>tained before 5-6 years after substr<strong>at</strong>e deployment <strong>and</strong> th<strong>at</strong> occasional<br />
events such as heavy storms <strong>and</strong> severe winters may even prolong this process. Some<br />
similarity in the succession of the epifouling community <strong>and</strong> the species present was<br />
found between the epifauna <strong>at</strong> the found<strong>at</strong>ions <strong>at</strong> <strong>Horns</strong> <strong>Rev</strong> <strong>and</strong> the epifauna on shipwrecks<br />
in other parts of the North Sea (Leewis et al., 2000). More species th<strong>at</strong> are found<br />
on wrecks are likely to be found <strong>at</strong> <strong>Horns</strong> <strong>Rev</strong> in the future.<br />
Photo 33. The dead man’s finger Alcyonium digit<strong>at</strong>um<br />
<strong>and</strong> the sea anemone Sargartiogeton<br />
lacer<strong>at</strong>us.<br />
Photo 34. The white weed Sertularia cupressina<br />
partly covered by tubes of Jassa marmor<strong>at</strong>a.<br />
On the scour protection, sea anemones <strong>and</strong> the soft coral (Alcyonium digit<strong>at</strong>um) contributed<br />
with high percentages to the total biomass. The most prominent species of sea anemones<br />
were Metridium senile, Sargartia elegans <strong>and</strong> Sargartiogeton lacer<strong>at</strong>us, which also<br />
have been found together with Alcyonium digit<strong>at</strong>um on hard substr<strong>at</strong>es such as shipwrecks<br />
in the Dutch area of the North Sea (Leewis et al., 2000). The sea anemones were also<br />
found on the monopiles <strong>and</strong> but less frequent <strong>and</strong> mostly restricted to the zones near the<br />
bottom.<br />
Of the epifaunal species found on the hard bottom fauna <strong>and</strong> new to the <strong>Horns</strong> <strong>Rev</strong> area,<br />
special <strong>at</strong>tention should be given to the ross worm (Sabellaria spinulosa) <strong>and</strong> the white<br />
weed (Sertularia cupressina). Both the ross worm <strong>and</strong> white weed, in addition to the n<strong>at</strong>ive<br />
oyster (Ostrea edulis), which was also found <strong>at</strong> the turbine sites, are regarded as<br />
thre<strong>at</strong>ened or red listed species in the Wadden Sea area as a result of habit<strong>at</strong> loss (Lotze,<br />
2004). The <strong>Horns</strong> <strong>Rev</strong> offshore wind farm might function as a sanctuary area for these<br />
thre<strong>at</strong>ened species. Sertularia cupressina is the object of harvesting for decor<strong>at</strong>ion purposes<br />
in Europe (Gibson et al., 2001; Lotze, 2004), but this species is obviously not uncommon<br />
in Denmark as it was found frequently <strong>and</strong> in high numbers in other studies<br />
elsewhere in the Danish part of the North Sea <strong>at</strong> the Jyske <strong>Rev</strong> (Dahl et al., 2004; Leonhard,<br />
2005). The ross worm (Sabellaria spinulosa) may form thin crusts or large biogenic<br />
reefs, up to several metres across, performing important stabilising functions on substra-<br />
Doc. No. 2572-03-005 rev. 4
<strong>Horns</strong> <strong>Rev</strong>. <strong>Benthic</strong> communities Page 78<br />
tum (Jackson & Hiscock, 2003) but is more common in different hard bottom communities<br />
confined to exposed circalittoral rocks (Jones et al., 2000). Sabellaria spinulosa was<br />
expected to establish on the hard substr<strong>at</strong>e in the wind farm area (Elsam, 2000) because it<br />
was also found on deployed hard substr<strong>at</strong>es off the Dutch coast (Lewis & Hallie, 2000).<br />
A marked succession in the number of fish species was observed from the surveys in<br />
March to the surveys in September. This might be a result of seasonal migr<strong>at</strong>ions of fish<br />
species to the turbine site for foraging. Bip (pouting) was observed presumably partly<br />
feeding on the crustaceans on the scour protection together with schools of cod. The numbers<br />
of cod <strong>and</strong> the small s<strong>and</strong>eel seems to have increased since 2003. Studies on fish<br />
communities around wrecks off the Dutch coast showed th<strong>at</strong> more species were partly dependent<br />
on the wrecks for food (Leewis et al., 2000). Individuals of species like the rock<br />
gunnel <strong>and</strong> the dragonet were commonly found inhabiting caves <strong>and</strong> crevices between the<br />
stones. Similar observ<strong>at</strong>ions were made in other studies (Leewis & Hallie, 2000).<br />
Taking into account considerable vari<strong>at</strong>ions in the infauna biomass, including high vari<strong>at</strong>ions<br />
in the presence of larger infauna species, it is estim<strong>at</strong>ed th<strong>at</strong> the availability of food<br />
for fish <strong>and</strong> other pred<strong>at</strong>ory animals as a consequence of the introduction of the physical<br />
hard substr<strong>at</strong>e structures <strong>at</strong> the wind turbine sites has increased by a factor of approxim<strong>at</strong>ely<br />
50 to about 483 kg(dw) compared to th<strong>at</strong> of the normal soft seabed fauna <strong>at</strong> the<br />
wind farm sites. Taking the whole wind farm area into account, the estim<strong>at</strong>ed increase in<br />
biomass is only 38 tonnes or about 7% of the total biomass in the area. However, an increase<br />
in fish production rel<strong>at</strong>ed to the presence of the hard substr<strong>at</strong>um is considered possible.<br />
4.2.1.3. Hydrodynamic effect<br />
Changes in hydrodynamic regimes due to deployment of “artificial reefs” in the North Sea<br />
have only had a small impact on the infauna community very close to the reef (Leewis &<br />
Hallie, 2000). St<strong>at</strong>istical analysis on the correl<strong>at</strong>ion between the various sediment parameters<br />
<strong>and</strong> the abundance of the infauna community in the wind farm area <strong>at</strong> <strong>Horns</strong> <strong>Rev</strong> was<br />
not significant. No significant impact on the infauna was detectable concerning distancerel<strong>at</strong>ed<br />
effects, although a tendency was found towards an increase in sediment coarseness<br />
with increasing distance from the turbine found<strong>at</strong>ions.<br />
On the scour protections, no st<strong>at</strong>istically significant differences have been found in fouling<br />
community structures between the leeward <strong>and</strong> current side of the monopiles. However, a<br />
st<strong>at</strong>istical significant difference was found between the two sides in the zone near the bottom<br />
of the monopiles indic<strong>at</strong>ing an impact from different hydrodynamic regimes on each<br />
side of the monopiles. Differences in community structure on the scour protections between<br />
overlapping zones <strong>at</strong> the leeward side of the monopiles might also reflect the effect<br />
of turbulence in the hydrodynamic regimes.<br />
4.2.1.4. Indirect <strong>and</strong> secondary effects<br />
Indirect <strong>and</strong> secondary effects on the infauna community inside the wind farm as a consequence<br />
of changes in feeding behaviour of sea birds <strong>and</strong> fish might be a result of the construction<br />
of offshore wind farms.<br />
In general, the density of the most abundant bivalves <strong>and</strong> bristle worms was higher in the<br />
wind farm area indic<strong>at</strong>ing th<strong>at</strong> the potential pred<strong>at</strong>ion pressure from sea birds could contribute<br />
to increasing differences between the density of their favoured prey inside <strong>and</strong> out-<br />
Doc. No. 2572-03-005 rev. 4
<strong>Horns</strong> <strong>Rev</strong>. <strong>Benthic</strong> communities Page 79<br />
side the wind farm area. The contribution to dissimilarity of the abundance of the 10 most<br />
important species between the reference <strong>and</strong> the wind farm area were consistent with this<br />
theory, which indic<strong>at</strong>es th<strong>at</strong> the effect of bird pred<strong>at</strong>ion might be detected.<br />
The differences found in the distribution p<strong>at</strong>tern of the American razor shell (Ensis americanus)<br />
between the wind farm area <strong>and</strong> the extended reference area could be <strong>at</strong>tributed to<br />
different pred<strong>at</strong>ion p<strong>at</strong>terns on this species from the common scoter (Melanitta nigra). The<br />
common scoter is very common <strong>and</strong> numerous in the <strong>Horns</strong> <strong>Rev</strong> area (Petersen et al.,<br />
2004) but it was however observed th<strong>at</strong> common scoters forage in the area outside of the<br />
wind farm avoiding the wind farm area (Christensen et al., 2004) in which the American<br />
razor shell was observed in significantly lower numbers than in the extended reference<br />
area<br />
On the other h<strong>and</strong>, differences in distribution p<strong>at</strong>terns for the bivalve Thracia phaseolina<br />
between the wind farm area <strong>and</strong> the reference area might be explained by differences in<br />
the pred<strong>at</strong>ion pressure from sea birds inside <strong>and</strong> outside the wind farm area. Thracia<br />
phaseolina, although not very numerous, seems to have increased in the wind farm area<br />
from 1999 to 2005 without a similar increase in the reference area. This species might be<br />
found more frequently in more coarse sediments but no differences in the sediment structures<br />
have been found between the wind farm area <strong>and</strong> the reference area. Further differences<br />
in abundance <strong>and</strong> biomass rel<strong>at</strong>ions of Thracia phaseolina between the wind farm<br />
area <strong>and</strong> the extended reference area could possiblly be explained by the pred<strong>at</strong>ion of<br />
common scoter on predominantly larger mussels.<br />
The benthic communities in the <strong>Horns</strong> <strong>Rev</strong> area are influenced by bottom trawling for<br />
s<strong>and</strong>eels <strong>and</strong> brown shrimp (Crangon crangon) <strong>and</strong> dredge-fishing for clams (Spisula<br />
solida) (Elsam, 2000). An indirect effect of an increased pressure from fish pred<strong>at</strong>ion due<br />
to a ban against fishing inside the wind farm area is however considered negligible <strong>and</strong><br />
undetectable as the fish <strong>at</strong>tracted to the turbine found<strong>at</strong>ions mainly seem to forage <strong>at</strong> the<br />
turbine found<strong>at</strong>ions (Leonhard <strong>and</strong> Pedersen, 2005).<br />
In other aspects, the benthic community inside the wind farm area might indirectly be affected<br />
by the termin<strong>at</strong>ion of fishing activities. Besides the reduction in target species popul<strong>at</strong>ions,<br />
repe<strong>at</strong>ed <strong>and</strong> frequent disturbance by fishing gear over an extended period results<br />
in alter<strong>at</strong>ion of the benthic community. This is characterised by a general reduction in the<br />
abundance of long-lived benthic species <strong>and</strong> an increase in small opportunistic species<br />
(Bergman et al., 1996; Kröncke & Bergfeld, 2001; Piersma & Camphuysen, 2001;<br />
Chícharo et al., 2002). The interdiction of trawling activities might be beneficial to the<br />
benthic communities by enabling the species to m<strong>at</strong>ure to their n<strong>at</strong>ural sizes <strong>and</strong> enabling<br />
very sensitive species to be established, however no such changes or effects were dectectable<br />
<strong>and</strong> <strong>at</strong>tributable to the termin<strong>at</strong>ion of fishing activities inside the wind farm area three<br />
years after deployment.<br />
4.2.1.5. Introduced species<br />
Besides the epifouling communities associ<strong>at</strong>ed with the hard bottom structures introduced<br />
in the wind farm area, some of these species might also be introduced to the faunal communities<br />
on the s<strong>and</strong>ed seabed.<br />
The crustaceans Jassa marmor<strong>at</strong>a <strong>and</strong> Caprella linearis, typically associ<strong>at</strong>ed with hard<br />
substr<strong>at</strong>e habit<strong>at</strong>s, were found on the seabed outside the wind turbine sites. P<strong>at</strong>ches of<br />
Doc. No. 2572-03-005 rev. 4
<strong>Horns</strong> <strong>Rev</strong>. <strong>Benthic</strong> communities Page 80<br />
small stones or shell assemblages on the seabed between the wind turbine sites are easily<br />
colonised by these epifaunal species th<strong>at</strong> drift from the turbine found<strong>at</strong>ions. It is most<br />
likely th<strong>at</strong> Jassa marmor<strong>at</strong>a cannot build tubes <strong>and</strong> establish itself on the s<strong>and</strong>y bottom.<br />
The presence of Jassa marmor<strong>at</strong>a <strong>and</strong> other epifouling species found on the seabed was<br />
presumably caused by drifting organisms caught by the current <strong>at</strong> the found<strong>at</strong>ions or the<br />
occurrence of small stones or shells colonised by epifouling species. In 2004, Jassa marmor<strong>at</strong>a<br />
was even found in the reference area indic<strong>at</strong>ing th<strong>at</strong> the “drifting” effect is more<br />
distinct than anticip<strong>at</strong>ed.<br />
4.2.2. Oper<strong>at</strong>ion<br />
More of the fish species, including the benthic species such as gobies (Pom<strong>at</strong>oschistus<br />
spp.), the long spined bullhead (Taurulus bubaris) <strong>and</strong> the shorthorn sculpin (Myxocephalus<br />
scorpius), th<strong>at</strong> are found <strong>at</strong> the turbine sites <strong>at</strong> <strong>Horns</strong> <strong>Rev</strong> are also typically found<br />
around wrecks in other parts of the North Sea (Leewis et al., 2000). Very mobile species<br />
like the edible crab (Cancer pagurus) have also established themselves <strong>at</strong> the turbine site<br />
indic<strong>at</strong>ing th<strong>at</strong> noise <strong>and</strong> vibr<strong>at</strong>ions from the turbine gener<strong>at</strong>ors apparently have no impact<br />
on fish <strong>and</strong> other mobile organisms <strong>at</strong>tracted to the hard bottom substr<strong>at</strong>es for foraging,<br />
shelter <strong>and</strong> protection.<br />
4.2.3. Cumul<strong>at</strong>ive effects<br />
Cumul<strong>at</strong>ive effects to the benthic communities if more wind farms were placed in r<strong>at</strong>her<br />
close vicinity to the <strong>Horns</strong> <strong>Rev</strong> offshore wind farm might be changes in community structure<br />
in areas between the wind farms <strong>and</strong> can be <strong>at</strong>tributable to changes in foraging activities<br />
of seabirds avoiding areas with wind turbines. Changes <strong>at</strong>tributable to the habit<strong>at</strong> disruption<br />
or changes in hydrodynamic regimes are considered to be of negligible magnitude.<br />
An increase in the coloniz<strong>at</strong>ion r<strong>at</strong>e of epifouling organisms on introduced hard substr<strong>at</strong>es<br />
might be expected <strong>at</strong> newly established wind farms in close vicinity to the <strong>Horns</strong> <strong>Rev</strong><br />
wind farm compared to the coloniz<strong>at</strong>ion r<strong>at</strong>es found <strong>at</strong> <strong>Horns</strong> <strong>Rev</strong>. Increased colonis<strong>at</strong>ion<br />
r<strong>at</strong>es are foreseen, especially for different macro algae <strong>and</strong> crabs including the edible crab<br />
(Cancer pagurus).<br />
Interdicting trawling inside the wind farm area <strong>and</strong> by hampering effective trawling by<br />
cutting off trawling routes might be beneficial to the benthic communities <strong>at</strong> a local scale<br />
in areas of more wind farms in rel<strong>at</strong>ively close proximity of each other. The overall cumul<strong>at</strong>ive<br />
effect of extending wind farms <strong>and</strong> establishing large-scale offshore wind farms<br />
within the same area might be beneficial to the local biodiversity <strong>and</strong> might improve local<br />
environmental conditions.<br />
4.3. Methodological consider<strong>at</strong>ions for future studies (lessons learned)<br />
Most methods are known <strong>and</strong> well documented to study the impact on benthic communities<br />
<strong>and</strong> coloniz<strong>at</strong>ion of introduced hard substr<strong>at</strong>es. The st<strong>at</strong>istical power of analysis was<br />
adjusted according to the objective <strong>and</strong> hypotheses <strong>and</strong> th<strong>at</strong> is why no adjustments to the<br />
methodology approach were considered.<br />
Doc. No. 2572-03-005 rev. 4
<strong>Horns</strong> <strong>Rev</strong>. <strong>Benthic</strong> communities Page 81<br />
5. <strong>Con</strong>clusion<br />
At the turbine sites in the offshore wind farm area <strong>at</strong> <strong>Horns</strong> <strong>Rev</strong>, the indigenous benthic<br />
community characterised by infauna species belonging to the Goniadella-Spisula community<br />
has been changed to an epifouling community associ<strong>at</strong>ed with hard bottom habit<strong>at</strong>s<br />
since the introduction of hard bottom structures in 2002. The small crustacean Jassa marmor<strong>at</strong>a<br />
has shown to be the most abundant species on the hard bottom substr<strong>at</strong>es.<br />
Introduction of epifouling communities have increased the general biodiversity in the<br />
wind farm area <strong>and</strong> progress succession has been observed in the epifouling community.<br />
High sp<strong>at</strong>ial <strong>and</strong> temporal variability was found in the n<strong>at</strong>ive infaunal community <strong>and</strong><br />
sediment parameters but no impact was found due to changes in hydrodynamic regimes<br />
caused by the physical wind farm install<strong>at</strong>ions.<br />
Changes <strong>and</strong> differences in the sp<strong>at</strong>ial distribution p<strong>at</strong>tern for some mussels might be an<br />
indirect effect of changes in foraging p<strong>at</strong>tern for sea birds avoiding wind turbine areas.<br />
Evidence th<strong>at</strong> the hard bottom substr<strong>at</strong>es provide habit<strong>at</strong> as nursery grounds for larger <strong>and</strong><br />
more mobile species was shown for the edible crab (Cancer pagurus).<br />
Significant sp<strong>at</strong>ial <strong>and</strong> temporal differences have been found in the epifouling communities<br />
<strong>at</strong> the hard bottom substr<strong>at</strong>es. Differences in community structures between monopiles<br />
<strong>and</strong> scour protections were shown mainly due to differences in abundance <strong>and</strong> biomass of<br />
a few epifouling dominant species.<br />
A significant vertical zon<strong>at</strong>ion was found in epifouling communities <strong>at</strong> the monopiles. The<br />
splash zone <strong>at</strong> the monopiles was entirely domin<strong>at</strong>ed by the “giant” midge (Telm<strong>at</strong>ogeton<br />
japonicus) with a pronounced increase in abundance since 2003. The upper investig<strong>at</strong>ed<br />
zones of the monopiles were characterised by high numbers <strong>and</strong> high biomass of the<br />
common mussel (Mytilus edulis) <strong>and</strong> veget<strong>at</strong>ion cover of green, red <strong>and</strong> brown algae. No<br />
clear distribution p<strong>at</strong>tern was found in the lower zones or near the bottom apart from a<br />
general lower abundance of the dominant species <strong>and</strong> increased coverage of sea anemones.<br />
Zon<strong>at</strong>ion in the epifouling community on the scour protections might be <strong>at</strong>tributable to<br />
differences in hydrodynamic regimes.<br />
The starfish (Asterias rubens) was found to be a keystone pred<strong>at</strong>or mainly controlling the<br />
distribution of the common mussel <strong>and</strong> the barnacles <strong>at</strong> the hard bottom substr<strong>at</strong>es in the<br />
wind farm area.<br />
Succession in community structure was demonstr<strong>at</strong>ed with a decrease in the abundance of<br />
some initial colonizers, which might be a result of pred<strong>at</strong>ion <strong>and</strong> competition for space.<br />
Stability in fouling communities will not be <strong>at</strong>tained within 5-6 years from the establishment<br />
of the wind farm. Heavy storms <strong>and</strong> severe winters may even prolong this process.<br />
Some species observed on the hard bottom structures <strong>at</strong> <strong>Horns</strong> <strong>Rev</strong> are characteristic for<br />
slightly scoured circalittoral rock habit<strong>at</strong>s.<br />
Doc. No. 2572-03-005 rev. 4
<strong>Horns</strong> <strong>Rev</strong>. <strong>Benthic</strong> communities Page 82<br />
Loss of pre-existing infauna habit<strong>at</strong>s has been replaced by hard bottom habit<strong>at</strong>s providing<br />
an estim<strong>at</strong>ed 50 times increase in the availability of food for fish <strong>and</strong> other organisms <strong>at</strong><br />
the wind farm sites but only a 7% increase in total biomass compared to the n<strong>at</strong>ive infauna<br />
biomass within the wind farm area.<br />
Seasonal vari<strong>at</strong>ions in fish fauna diversity were found with bib <strong>and</strong> schools of cod often<br />
observed on the scour protections as well as individuals of benthic fish species. Comparing<br />
the fish fauna to fish fauna on shipwrecks in other parts of the North Sea showed th<strong>at</strong><br />
there was no indic<strong>at</strong>ion th<strong>at</strong> noise <strong>and</strong> vibr<strong>at</strong>ions from the turbine gener<strong>at</strong>ors had any impact<br />
on the fish community <strong>at</strong> <strong>Horns</strong> <strong>Rev</strong>.<br />
The wind farm area might function as a sanctuary area for thre<strong>at</strong>ened or red listed species<br />
in the Wadden Sea area such as the ross worm (Sabellaria spinulosa) <strong>and</strong> the white weed<br />
(Sertularia cupressina), both of which were found <strong>at</strong> Horn <strong>Rev</strong>.<br />
The main objective of the demonstr<strong>at</strong>ion programme was to investig<strong>at</strong>e the effects of the<br />
establishment of offshore wind farms on the environment, to provide a solid basis for decisions<br />
about further development of offshore wind power <strong>and</strong> to ensure th<strong>at</strong> offshore<br />
wind power development has no damaging effect on the n<strong>at</strong>ural ecosystem. Results from<br />
the investig<strong>at</strong>ions on the benthic communities showed th<strong>at</strong> only negligible impacts on the<br />
n<strong>at</strong>ive communities were <strong>at</strong>tributable to the wind turbine structures <strong>and</strong> th<strong>at</strong> effects of the<br />
introduced hard substr<strong>at</strong>es were an increase in local biodiversity <strong>and</strong> an increase in local<br />
food availability. Cumul<strong>at</strong>ive effects of reduced trawling activities might be beneficial to<br />
local biodiversity enabling benthic communities to m<strong>at</strong>ure <strong>and</strong> generally improve environmental<br />
conditions in areas of more wind farms.<br />
Photo 35. The edible crab Cancer pagurus. Photo 36. The rock gunnel Pholis gunnellus.<br />
Doc. No. 2572-03-005 rev. 4
<strong>Horns</strong> <strong>Rev</strong>. <strong>Benthic</strong> communities Page 83<br />
6. Acknowledgements<br />
The work has been financed by the Danish Energy Authorities through the PSO (Public<br />
Service Oblig<strong>at</strong>ions) programmes. The authors would like to thank the tuff field workers<br />
<strong>and</strong> SCUBA divers Jens Christensen, Jens Dedding, Maks Klaustrup <strong>and</strong> Rune Frederiksen<br />
for excellent work <strong>and</strong> defying the harsh we<strong>at</strong>her <strong>and</strong> working conditions in a rough<br />
environment in the North Sea. We are also gr<strong>at</strong>eful to the individual members of the Environmental<br />
Project Group <strong>and</strong> members of the Intern<strong>at</strong>ional Expert Panel, with special reference<br />
to Professor Anthony Jensen, for constructive comments <strong>and</strong> inspir<strong>at</strong>ion during the<br />
project period. A special thanks to Dr. Elizabeth Cook, Scottish Associ<strong>at</strong>ion for Marine<br />
Science, for identific<strong>at</strong>ion <strong>and</strong> verific<strong>at</strong>ion of Caprella mutica.<br />
Doc. No. 2572-03-005 rev. 4
<strong>Horns</strong> <strong>Rev</strong>. <strong>Benthic</strong> communities Page 84<br />
7. References<br />
Ashe, P. <strong>and</strong> P.S. Cranston, 1990. Chironomidae, In Soos, A. <strong>and</strong> L. Papp (Eds). C<strong>at</strong>alogue<br />
of Palaearctic Diptera: Psychodidae-Chironomidae 2. Elsevier, Amsterdam:<br />
113-355.<br />
Athanasios, B. & C. Chariton, 2000. Peracarida crustacean popul<strong>at</strong>ions of the artificial<br />
hard substr<strong>at</strong>um in N. Michaniona (N. Aegean). Belg. J. Zool., 130 (supplement 1):<br />
9-14.<br />
Bech, M., R. Frederiksen, J. Pedersen, S.B. Leonhard, 2004. Infauna monitoring. <strong>Horns</strong><br />
<strong>Rev</strong> Wind Farm 2003. St<strong>at</strong>us Report: 1-74. Report request. Commissioned by Elsam<br />
Engineering A/S.<br />
Bech, M., R. Frederiksen, J. Pedersen, S.B. Leonhard, 2005. Infauna monitoring. <strong>Horns</strong><br />
<strong>Rev</strong> Wind Farm 2004. St<strong>at</strong>us Report. In Prep. Report request. Commissioned by Elsam<br />
Engineering A/S.<br />
Bergman, M.J.N., M. Fonds, S.J. de Groot <strong>and</strong> J.W. van Santbrink, 1996. Direct Effects of<br />
Beam Trawl Fishery on bottom Fauna in the Southern North Sea. In Andersen J., H.<br />
Karup <strong>and</strong> U.B. Nielsen (Eds.) Scientific Symposium on the North Sea Quality<br />
St<strong>at</strong>us Report 1993, 18-21 April 1994, Ebeltoft, Denmark: 204-209.<br />
Bio/consult, 2001. Bundforhold og begroninger ved målemast. Beskrivelser af flora og<br />
fauna 02.04.2001. Note Commissioned by Tech-wise:1-9.<br />
Birkett, L., 1953. Changes in the compositions of the bottom fauna of the Dogger Bank<br />
area. N<strong>at</strong>ure 171: 265<br />
Burnell et al., 1991. Ref. Marlin Species D<strong>at</strong>abase www. Marlin.ac.uk.<br />
Chiba, S. & T. Noda, 2000. Factors maintaining topography-rel<strong>at</strong>ed mosaic of barnacle<br />
<strong>and</strong> mussel on a rocky shore. J.Mar.Biol.Ass.U.K. 80: 617-622.<br />
Chícharo, L., A. Chícharo, M. Gaspar, F. Alves <strong>and</strong> J. Regala, 2002. Ecological characteriz<strong>at</strong>ion<br />
of dredged <strong>and</strong> non-dredged bivalve fishing areas off south Portugal. J.<br />
Mar. Bio. Ass. U.K. 82 (1): 41-50.<br />
Christensen, T. K.,Hounisen, J. P. Clausager, I. & Petersen, I. K. 2004. Visual <strong>and</strong> radar<br />
observ<strong>at</strong>ions of birds in rel<strong>at</strong>ion to collision risk <strong>at</strong> the offshore wind farm <strong>at</strong> <strong>Horns</strong><br />
<strong>Rev</strong>, 2003. Report request. Commissioned by ELSAM Engineering A/S.<br />
Clarke, K. R. & R.M. Warwick, 1994. Change in marine communities: an approach to st<strong>at</strong>istical<br />
analysis <strong>and</strong> interpret<strong>at</strong>ion. N<strong>at</strong>ural Environment Research Council, UK: 1-<br />
114.<br />
<strong>Con</strong>nor, D. W, J. Allen, N. Golding, K.L. Howell, L.M. Lieberknecht, K.O. Northern <strong>and</strong><br />
J.B. Reker, 2004. The Marine Habit<strong>at</strong> Classific<strong>at</strong>ion for Britain <strong>and</strong> Irel<strong>and</strong> Version<br />
04.05 JNCC, Peterborough<br />
Doc. No. 2572-03-005 rev. 4
<strong>Horns</strong> <strong>Rev</strong>. <strong>Benthic</strong> communities Page 85<br />
Crisp, 1965. Ref. Marlin Species D<strong>at</strong>abase. www. Marlin.ac.uk.<br />
Dahl, K., J. Nicolaisen, R. Nielsen <strong>and</strong> O. S. Tindal, 2004. Udvikling og afprøvning af<br />
metoder til indsamling af flora og fauna på småstenede hårdbundshabit<strong>at</strong>er. Faglig<br />
rapport fra DMU, nr. 521: 1-85.<br />
Danish Hydraulic Institute (DHI), 1999. Havvindmøllefundamenter ved <strong>Horns</strong> <strong>Rev</strong> – Hydrografiske<br />
d<strong>at</strong>a. ELSAMPROJEKT A/S.<br />
Degraer, S., M. Vincx, P. Meire & H. Offringa 1999. The macrozoobenthos of an important<br />
wintering area of the common scoter (Melanitta nigra). J. Mar. Biol. Ass. U.K.<br />
79: 243-251.<br />
Dewarumez, J.M., D. Devoult, L.E.S. Anorve & S. Frontier, 1992. Is the ‘muddy heterogeneous<br />
sediment assemblage’ an ecotone between the pebbles community <strong>and</strong> the<br />
Abra alba community in the Southern Bight of the North Sea? Netherl<strong>and</strong>s Journal<br />
of Sea Research.30: 229–238.<br />
Duffy, J. E. & M.E. Hay, 2000. Strong impact of grazing amphipods on the organiz<strong>at</strong>ion<br />
of a benthic community. Ecological Monographs 70 (2): 237-262.<br />
Dyer, M.F., W.G. Fry, P.D. Fry & G.J. Cranmer, 1983. <strong>Benthic</strong> regions within the North<br />
Sea. J. Mar. Biol. Ass. U.K. 63:683-693.<br />
Elsamprojekt, 2000. Havmøller <strong>Horns</strong> <strong>Rev</strong>. Vurdering af Virkninger på Miljøet. VVM–<br />
redegørelse. Rapport til Elsam I/S og Eltra amba.<br />
Fishbase. www.fishbase.org.<br />
Falace, A. <strong>and</strong> G. Bressan, 2000. “Periphyton” coloniz<strong>at</strong>ion: Principles, Criteria <strong>and</strong> Study<br />
Methods. In A. C. Jensen et al. (eds.): Artificial Reefs in European Seas: 435-449.<br />
GEUS, 2002. Personal communic<strong>at</strong>ion.<br />
Gibson, R., B. Hextall <strong>and</strong> A. Rogers, 2001. Photographic Guide to the Sea & Shore Life<br />
of Britain & North-west Europe. Oxford: 1-436.<br />
Glasser, J.W., 1979. The role of pred<strong>at</strong>ion in shaping <strong>and</strong> maintaining the structure of<br />
communities. Am. N<strong>at</strong>. Vol 113: 631-641.<br />
Govaere, J.C.R., D. Van Damme, C. Heip & A.P. De <strong>Con</strong>inck 1980. <strong>Benthic</strong> communities<br />
in the Southern Bight of the North Sea <strong>and</strong> their use in ecological monitoring. Helgoländer<br />
Meeresunters. 33: 507-521<br />
Hoffmann, E., J. Astrup, F. Larsen <strong>and</strong> S. Munch-Petersen, 2000. Effects of marine wind<br />
farms on the distribution of fish, shellfish <strong>and</strong> marine mammals in the <strong>Horns</strong> <strong>Rev</strong><br />
area. Danish Institute for Fisheries Research, Department of Marine Fisheries: 1-42.<br />
Report request. Commissioned by Elsamproject..<br />
Doc. No. 2572-03-005 rev. 4
<strong>Horns</strong> <strong>Rev</strong>. <strong>Benthic</strong> communities Page 86<br />
Hvas, E., P.B. Madsen, J. Groos, 2005. Åbne farv<strong>and</strong>e langs vestkysten. St<strong>at</strong>us og udvikling.<br />
1989-2004. Nordjyll<strong>and</strong>s amt, Ringkjøbing amt, Ribe amt, Viborg amt: 1- 47.<br />
Hvidt, C.B., L. Brünner, F.R. Knudsen <strong>and</strong> B.S. Jensen, 2005. Hydroacoustic monitoring<br />
of fish communities in offshore wind farms. Annual Report 2004. <strong>Horns</strong> <strong>Rev</strong> Offshore<br />
Wind Farm: 1-21. Report request. Commissioned by Elsam Engineering A/S.<br />
Jackson, A. & K. Hiscock, 2003. Sabellaria spinulosa. Ross worm. Marine Life Inform<strong>at</strong>ion<br />
Network: Biology <strong>and</strong> Sensitivity Key Inform<strong>at</strong>ion Sub-programme. Plymouth:<br />
Marine Biological Associ<strong>at</strong>ion of the United Kingdom. Available from:<br />
.<br />
Jensen, H., P.S. Kristensen <strong>and</strong> E. Hoffmann, 2004. S<strong>and</strong>eels in the wind farm area <strong>at</strong><br />
<strong>Horns</strong> Reef. DIFR (Danish Institute for Fisheries Research): 1-26. Report request.<br />
Commissioned by Elsam.<br />
Jones, L.A., K. Hiscock <strong>and</strong> D.W. <strong>Con</strong>nor, 2000 (<strong>Rev</strong>ised 2001). Marine habit<strong>at</strong> reviews.<br />
A summary of ecological requirements <strong>and</strong> sensitivity characteristics of the conserv<strong>at</strong>ion<br />
<strong>and</strong> management of marine SACs. Joint N<strong>at</strong>ure <strong>Con</strong>serv<strong>at</strong>ion Committee: 1-<br />
178.<br />
Kingston, P. & E. Rachor, 1982. North Sea level bottom communities. ICES CM<br />
1982/L:41: 1–15.<br />
Kirkegaard, J.B., 1969. A quantit<strong>at</strong>ive Investig<strong>at</strong>ion of the Central North Sea. Polychaeta.<br />
Spolia 29. 1–284.<br />
Kröncke, I., C. Bergfeld, 2001. Synthesis <strong>and</strong> New <strong>Con</strong>ception of North Sea Research<br />
(SYCON) 12. Working group 10. <strong>Rev</strong>iew of the Current Knowledge on North Sea<br />
Benthos. Berichte aus dem Zentrum für Meeres- und Klimaforschung dern Universität<br />
Hamburg: 1-138.<br />
Larsen, B., 2003. Blåv<strong>and</strong>s Huk – <strong>Horns</strong> <strong>Rev</strong> området – et nyt Skagen?. Temanummer<br />
Geologi nyt fra GEUS nr. 4 (2003)<br />
Leewis, R. & F. Hallie, 2000. An Artificial Reef Experiment off the Dutch Coast. – In A.<br />
C. Jensen et al. (eds.): Artificial Reefs in European Seas: 289–305.<br />
Leewis, R. G. van Moorsel <strong>and</strong> H. Waardenburg, 2000. Shipwrecks on the Dutch <strong>Con</strong>tinental<br />
Shelf as Artificial Reefs - In A. C. Jensen et al. (eds.): Artificial Reefs in<br />
European Seas: 419–434.<br />
Leonhard, S.B., 2000. <strong>Horns</strong> <strong>Rev</strong> Offshore Wind Power Farm. Environmental Impact Assessment<br />
of Sea Bottom <strong>and</strong> Marine Biology: 1-36. Report request. Commissioned<br />
by Elsam I/S.<br />
Leonhard, S.B., 2001. <strong>Horns</strong> <strong>Rev</strong> Offshore Wind Farm. Introducing hard bottom substr<strong>at</strong>e<br />
sea bottom <strong>and</strong> marine biology. St<strong>at</strong>us report 2001. Report commissioned by<br />
ELSAM Engineering A/S: 1-73.<br />
Doc. No. 2572-03-005 rev. 4
<strong>Horns</strong> <strong>Rev</strong>. <strong>Benthic</strong> communities Page 87<br />
Leonhard, S.B. <strong>and</strong> J. Pedersen, 2002. <strong>Horns</strong> <strong>Rev</strong>. Offshore Wind Farm. Introducing Hard<br />
Bottom Substr<strong>at</strong>e. Sea Bottom <strong>and</strong> marine Biology. St<strong>at</strong>us Report 2001: 1-72. Report<br />
request. Commissioned by Elsam Engineering A/S.<br />
Leonhard, S.B., 2003. <strong>Horns</strong> <strong>Rev</strong>. Introducing hard substr<strong>at</strong>e habit<strong>at</strong>s. Monitoring programme<br />
for benthos communities, flora <strong>and</strong> fauna. Upd<strong>at</strong>e autumn 2003. Memor<strong>and</strong>um<br />
request. Commissioned by Elsam Engineering A/S: 1-13.<br />
Leonhard, S.B. 2004. Hard Bottom Substr<strong>at</strong>e Monitoring <strong>Horns</strong> <strong>Rev</strong> Wind Farm 2004<br />
D<strong>at</strong>a Report No. 1: 1-85. Report request. Commissioned by Elsam Engineering A/S.<br />
Leonhard, S.B., 2005. Hard Bottom Substr<strong>at</strong>e Monitoring <strong>Horns</strong> <strong>Rev</strong> Wind Farm 2004<br />
D<strong>at</strong>a Report No. 2: 1-108. Report request. Commissioned by Elsam Engineering<br />
A/S.<br />
Leonhard, S.B., 2005. Applic<strong>at</strong>ion for extraction of raw m<strong>at</strong>erial <strong>at</strong> Jyske <strong>Rev</strong>. (in Danish).<br />
Request by Rohde-Nielsen A/S.<br />
Leonhard,, S.B. <strong>and</strong> R. Frederiksen, 2005. Hard Bottom Substr<strong>at</strong>e Monitoring <strong>Horns</strong> <strong>Rev</strong><br />
Offshore Wind Farm 2005. Survey Report No. 2.: 1-18. Report request. Commissioned<br />
by Elsam Engineering A/S.<br />
Leonhard, S.B., J. Pedersen, 2004. Hard Bottom Substr<strong>at</strong>e Monitoring <strong>Horns</strong> <strong>Rev</strong> Offshore<br />
Wind Farm. Annual St<strong>at</strong>us report 2003: 1-62. Report request. Commissioned<br />
by Elsam Engineering A/S.<br />
Leonhard, S.B., J. Pedersen, 2005. Hard Bottom Substr<strong>at</strong>e Monitoring <strong>Horns</strong> <strong>Rev</strong> Offshore<br />
Wind Farm. Annual St<strong>at</strong>us report 2004: 1-79. Report request. Commissioned<br />
by Elsam Engineering A/S.<br />
Lotze, H.K., 2004. Ecological History of the Wadden Sea: 2000 Years of Human-induced<br />
Change in a Unique Coastal Ecosystem. Wadden Sea Newsletter 2004 – 1: 22-23.<br />
Lundsteen, S., 2000. Faunaen på 26 stenrev i de indre danske farv<strong>and</strong>e i 1991 - 1994.<br />
Aqu<strong>at</strong>ic <strong>Con</strong>sult og Hedeselskabet ME for Skov- og N<strong>at</strong>urstyrelsen: 1-104.<br />
Murray, D. A., 1999. Two marine coastal-dwelling chironomidae (Diptera) new to the<br />
fauna of Icel<strong>and</strong>: Telm<strong>at</strong>ogeton japonicus Tokunaga (Telm<strong>at</strong>ogetoninae) <strong>and</strong> Clunio<br />
marinus Haliday (Orthocladiinae). Bull. Ir. Biogeof. Soc 23, 89–91.<br />
Nehring, S. 1999. Oyster beds <strong>and</strong> Sabellaria reefs. In the Wadden Sea. Quality St<strong>at</strong>us<br />
Report.<br />
NERI, 2006. N<strong>at</strong>ional Environmental Research Institute. MADS d<strong>at</strong>abase.<br />
http://www.dmu.dk/V<strong>and</strong>/Havmilj%C3%B8/MADS/V<strong>and</strong>kemi/<br />
Neal, K.J. & E. Wilson, 2005. Cancer pagurus. Edible crab. Marine Life Inform<strong>at</strong>ion<br />
Network: Biology <strong>and</strong> Sensitivity Key Inform<strong>at</strong>ion Sub-programme [on-line]. Plymouth:<br />
Marine Biological Associ<strong>at</strong>ion of the United Kingdom. [cited 03/02/2006].<br />
Available from: <br />
Doc. No. 2572-03-005 rev. 4
<strong>Horns</strong> <strong>Rev</strong>. <strong>Benthic</strong> communities Page 88<br />
Nielsen, R., D. Schories, W. Härdtle, K. Reise & W.J Wolff 1996. Red List of Marine<br />
Macroalgae of the Wadden Sea. Helgoländer Meeresunters. 50 Suppl., 39–42.<br />
Petersen, G.H., 1977. The Density, Biomass <strong>and</strong> Origin of the Bivalves of the Central<br />
North Sea. Meddr. Danm. Fisk.- og Havunders. N.S Vol. 7: 221–273.<br />
Petersen, G.H., P.B. Madsen, K.T. Jensen, K.H. van Bernem, J. Harms, W. Heiber, I.<br />
Kröncke, H. Michaelis, E. Rachor, K. Reise, R. Dekker, G.J.M. Visser & W.J.<br />
Wolff, 1996. Red List of Macrofaunal <strong>Benthic</strong> Invertebr<strong>at</strong>es of the Wadden Sea.<br />
Helgoländer Meeresunters. 50 Suppl., 69–76.<br />
Petersen, I.K., I. Clausager <strong>and</strong> T.K. Christensen, 2004. Bird numbers <strong>and</strong> distribution in<br />
the <strong>Horns</strong> <strong>Rev</strong> offshore wind farm area. Annual St<strong>at</strong>us Report 2003. Report commissioned<br />
by Elsam Engineering A/S 2003: 1-36.<br />
Piersma, T. <strong>and</strong> K. Camphuysen, 2001. Wh<strong>at</strong> can peak mortalities of eiders tell us about<br />
the st<strong>at</strong>e of the Dutch Wadden Sea ecosystem? Wadden Sea Newsletter 2001-1: 42-<br />
45.<br />
Rambøll, 1999. Elsam Havmøller. Havmøllers indvirkning på råstofressourceområderne<br />
på <strong>Horns</strong> <strong>Rev</strong> <strong>Rev</strong>. November 1999.<br />
Remmert, H., 1963. Telm<strong>at</strong>ogeton remanei n.sp., eine neue marine Chironomide aus der<br />
Kieler Förde. Zool. Anz. 171: 165-178.<br />
Sab<strong>at</strong>ini, M., 2004. Spisula solida. A surf clam. Marine Life Inform<strong>at</strong>ion Network: Biology<br />
<strong>and</strong> Sensitivity Key Inform<strong>at</strong>ion Sub-programme. Plymouth: Marine Biological<br />
Associ<strong>at</strong>ion of the United Kingdom. Available from:<br />
<br />
Saier, B., 2001. Direct <strong>and</strong> indirect effects of seastars Asterias rubens on mussel beds<br />
(Mytilus edulis) in the Wadden Sea. Journal of Sea Research 46: 29-42.<br />
Salzwedel, H., E. Rachor & D. Gerdes, 1985. <strong>Benthic</strong> macrofauna communities in the<br />
German Bight. Veröff. Inst. Meeresforsch. Bremerh. 20: 199–267.<br />
Tish, N. 2003. Community level effects of the amphipod Jassa marmor<strong>at</strong>a. Marine Labor<strong>at</strong>ory,<br />
Cornell University, www.sml.cornell.edu<br />
Tyler-Walters, H., 2002. Flustra foliacea <strong>and</strong> other hydroid/bryozoan turf species on<br />
slightly scoured circalittoral rock or mixed substr<strong>at</strong>a. Marine Life Inform<strong>at</strong>ion Network:<br />
Biology <strong>and</strong> Sensitivity Key Inform<strong>at</strong>ion Sub-programme [on-line]. Plymouth:<br />
Marine Biological Associ<strong>at</strong>ion of the United Kingdom. [cited 25/02/2005]. Available<br />
from: <br />
Ursin, E., 1960. A Quantit<strong>at</strong>ive investig<strong>at</strong>ion of the Echinoderm Fauna of the central<br />
North Sea. Meddr. Danm. Fisk.- og Havunders. N.S Vol. 2 nr. 24: 1–204.<br />
Doc. No. 2572-03-005 rev. 4
<strong>Horns</strong> <strong>Rev</strong>. <strong>Benthic</strong> communities Page 89<br />
Vanosmael, C., K.A. Willems, D. Claeys, M. Vincx & C. Heip, 1982. Macrobenthos of a<br />
sublittoral s<strong>and</strong>bank in the southern Bight of the North Sea. J. Mar. Biol. Ass. U.K. 62:<br />
521-534<br />
White, N., 2004. Balanus cren<strong>at</strong>us. An acorn barnacle. Marine Life Inform<strong>at</strong>ion Network:<br />
Biology <strong>and</strong> Sensitivity Key Inform<strong>at</strong>ion Sub-programme [on-line]. Plymouth: Marine<br />
Biological Associ<strong>at</strong>ion of the United Kingdom. [cited 03/02/2006]. Available<br />
from: <br />
Willis, K.J., E.J. Cook, M. Lozano-Fern<strong>and</strong>ez <strong>and</strong> I. Takeuchi, 2004. First record of the<br />
alien caprellid amphipod, Caprella mutica, for the UK. J.Mar.Biol.Ass. U.K. 84:<br />
1027-1028.<br />
Worm, B.; H.K. Lotze; H. Hillebr<strong>and</strong> <strong>and</strong> U. Sommer. 2002. <strong>Con</strong>sumer versus resource<br />
control of species diversity <strong>and</strong> ecosystem functioning. N<strong>at</strong>ure vol. 417: 848-851.<br />
Doc. No. 2572-03-005 rev. 4
<strong>Horns</strong> <strong>Rev</strong>. <strong>Benthic</strong> communities Page 90<br />
.<br />
8. Appendixes<br />
8.1. Appendix 1. Coordin<strong>at</strong>es of the wind farm <strong>and</strong> list of Positions<br />
Table A.1.1. Co-ordin<strong>at</strong>es of the outermost wind turbines <strong>and</strong> the transformer st<strong>at</strong>ion. Point positions are shown<br />
in Figure 1.3.<br />
Co-ordin<strong>at</strong>es in system UTM32/WGS84<br />
Point Easting (x) Northing (y)<br />
P1 423.974 6.151.447<br />
P2 429.014 6.151.447<br />
P3 429.492 6.147.556<br />
P4 424.452 6.147.556<br />
T 428.946 6.152.003<br />
Table A1.2. Positions of sampling loc<strong>at</strong>ions for infauna surveys in 2001 to 2004.<br />
Loc<strong>at</strong>ion "WGS84_MIN_Y" WGS84_MIN_X"<br />
2001<br />
2003 2004<br />
June September September September<br />
Depth (app. m) Depth (app. m) Depth (app. m) Depth (app. m)<br />
M26_005 07°49.220' 55°28.717' 7.8 7.8 8.4<br />
M26_025 07°49.227' 55°28.727' 7.9 7.8 8.6<br />
M26_100 07°49.251' 55°28.765' 8.3 7.8 8.4<br />
M51_005 07°50.447' 55°30.227' 10 8.9 8.1<br />
M51_025 07°50.454' 55°30.237' 10 8.9 9<br />
M51_100 07°50.478' 55°30.275' 9.7 8.9 8.6<br />
M55_005 07°50.742' 55°29.031' 10.5 10.5 11.1 10,0<br />
M55_025 07°50.748' 55°29.041' 10.2 10.2 11.1 9.2<br />
M55_100 07°50.772' 55°29.079' 10.6 10.6 11.1 9.5<br />
M58_005 07°50.962' 55°28.134' 7.9 7.9 7.8 8.2<br />
M58_025 07°50.969' 55°28.144' 8.1 8.1 7.8 8.6<br />
M58_100 07°50.993' 55°28.182' 8.5 8.5 7.8 8.5<br />
M73_005 07°51.658' 55°29.639' 9.3 8.5 7.9<br />
M73_025 07°51.665' 55°29.649' 9.3 8.5 7.8<br />
M73_100 07°51.689' 55°29.687' 9.2 8.5 8.1<br />
M95_005 07°52.868' 55°29.051' 9.1 9.1 8.7 8.2<br />
M95_025 07°52.874' 55°29.061' 9.2 9.2 8.8 9.2<br />
M95_100 07°52.899' 55°29.099' 8.9 8.9 8.8 8.7<br />
R1 07°46.640' 55°30.070' 10.3 9.4<br />
R7 07°47.320' 55°29.480' 8.8 8.2<br />
R35 07°53.080' 55°27.730' 7.6 8.7<br />
R36 07°53.030' 55°30.130' 6.6 6.1<br />
R37 07°53.170' 55°29.530' 6.6 6.2<br />
R40 07°53.610' 55°27.740' 8.3 9.2<br />
RF1 07°43.252' 55°31.162' 11<br />
RF2 07°43.568' 55°30.698' 10.5<br />
RF3 07°43.943' 55°31.241' 10<br />
RF4 07°43.963' 55°31.767' 8<br />
RF5 07°44.604' 55°31.202' 9<br />
Doc. No. 2572-03-005 rev. 4
<strong>Horns</strong> <strong>Rev</strong>. <strong>Benthic</strong> communities Page 91<br />
.<br />
Table A1.3. Positions of sampling loc<strong>at</strong>ions for infauna survey in 2005.<br />
Loc<strong>at</strong>ion WGS84_MIN_Y WGS84_MIN_X" W<strong>at</strong>er depth (m)<br />
1 07°41.082' 55°32.382' 11.2<br />
2 07°41.965' 55°32.578' 9<br />
3 07°41.511' 55°32.215' 10.2<br />
4 07°41.520' 55°31.885' 12<br />
5 07°41.959' 55°32.133' 10.9<br />
6 07°42.351' 55°32.335' 10.4<br />
7 07°42.810' 55°32.204' 10.2<br />
8 07°43.259' 55°32.282' 10.5<br />
9 07°42.770' 55°31.852' 11.3<br />
10 07°43.264' 55°32.017' 11<br />
11 07°43.324' 55°31.653' 11<br />
12 07°43.712' 55°31.389' 9.8<br />
13 07°44.657' 55°31.759' 8.2<br />
14 07°44.578' 55°31.471' 10<br />
15 07°43.941' 55°30.812' 11.1<br />
16 07°45.466' 55°31.389' 10.5<br />
17 07°44.589' 55°30.644' 10.8<br />
18 07°44.589' 55°30.396' 11.9<br />
19 07°45.028' 55°30.644' 10.8<br />
20 07°45.752' 55°31.200' 11.2<br />
21 07°45.905' 55°30.396' 10<br />
22 07°45.466' 55°30.148' 10.1<br />
23 07°45.878' 55°30.098' 9.4<br />
24 07°45.392' 55°29.822' 9.5<br />
25 07°46.072' 55°29.894' 9.2<br />
RF4 07°43.963' 55°31.767' 11.2<br />
RF3 07°43.943' 55°31.241' 10<br />
RF5 07°44.604' 55°31.202' 10.9<br />
DIFR 64 07°45.000' 55°31.000' 10.9<br />
DIFR 67 07°45.532' 55°31.000' 10.5<br />
DIFR 70 07°46.063' 55°31.000' 11.3<br />
DIFR 71 07°46.063' 55°30.701' 11<br />
DIFR 66 07°45.000' 55°30.402' 10.6<br />
M51_100 07°50.478' 55°30.275' 9.6<br />
M73_100 07°51.689' 55°29.687' 9.1<br />
M55_100 07°50.772' 55°29.079' 10.5<br />
M95_100 07°52.899' 55°29.099' 9.1<br />
M26_100 07°49.251' 55°28.765' 8.3<br />
M58_100 07°50.993' 55°28.182' 8.3<br />
R1 07°46.640' 55°30.070' 9.6<br />
R7 07°47.320' 55°29.480' 9.3<br />
R35 07°53.080' 55°27.730' 8.7<br />
R36 07°53.030' 55°30.130' 7.2<br />
R37 07°53.170' 55°29.530' 7.1<br />
R40 07°53.610' 55°27.740' 9.2<br />
TableA1.4. Turbine positions for hard substr<strong>at</strong>e surveys on scour protections *. Additional sampling of monopiles<br />
marked with **.<br />
Loc<strong>at</strong>ion "WGS84_MIN_Y" WGS84_MIN_X" Depth (app. m) Mono-pile in place Programme<br />
Turbine 33 55°29.609' 07°49.526' 11.0 15-Jul-02 *<br />
Turbine 55 55°29.022' 07°50.736' 10.0 30-Jul-02 **<br />
Turbine 58 55°28.124' 07°50.956' 8.0 02-Aug-02 **<br />
Turbine 91 55°30.237' 07°52.569' 6.0 19-Aug-02 *<br />
Turbine 92 55°29.938' 07°52.642' 6.0 19-Aug-02 *<br />
Turbine 95 55°29.041' 07°52.862' 9.0 22-Aug-02 **<br />
Doc. No. 2572-03-005 rev. 4
<strong>Horns</strong> <strong>Rev</strong>. <strong>Benthic</strong> communities Page 92<br />
.<br />
8.2. Appendix 2. Species Lists<br />
Doc. No. 2572-03-005 rev. 4
<strong>Horns</strong> <strong>Rev</strong>. <strong>Benthic</strong> communities Page 93<br />
.<br />
8.2.1. Appendix 2.1. Infauna 1999-2005<br />
Complete list of species <strong>Horns</strong> <strong>Rev</strong> Infauna 1999-2005<br />
Group Species Author 1999 2001 2003 2004 2005 Common Danish name Common name<br />
HYDROZOA Polypdyr Hydroids<br />
Tubularia indivisa x<br />
Hydractinia echin<strong>at</strong>a Fleming x x x<br />
Campanulariidae indet. x x x<br />
SCYPHOZOA Gopler Medusae<br />
Beroe cucumis Fabricius x<br />
ANTHOZOA Søanemoner Sea anemones<br />
Actiniaria indet. x x<br />
NEMERTINI Slimbændler Ribbon worms<br />
Nemertini indet. x x x x x<br />
NEMATOMORPHA Hårorme<br />
Nem<strong>at</strong>omorpha indet. x<br />
NEMATODA<br />
Nem<strong>at</strong>oda indet. x x x x x Rundorme Nem<strong>at</strong>odes<br />
POLYCHAETA<br />
Polychaeta indet. x Havbørsteorme Bristleworms<br />
Pholoe sp. x<br />
Pisione remota (Southern) x x x x x<br />
Eteone foliosa Qu<strong>at</strong>refages x<br />
Eulalia viridis (L.) x x<br />
Nephtys caeca (Fabricius) x x x<br />
Nephtys hombergii Savigny x<br />
Nephtys longosetosa Ørsted x x<br />
Nephtys sp. x x x<br />
Glycera alba (O.F. Müller) x x x<br />
Goniadella bobretzkii (Annenkova) x x x x x<br />
Dorvilleidae indet. x<br />
Protodorvillea kefersteini (McIntosh) x x<br />
Scoloplos armiger O.F. Müller x x x<br />
Orbinia sertul<strong>at</strong>a (Savigny) x x x x x<br />
Spionidae indet. x x<br />
Spio filicornis (O.F. Müller) x x x x x<br />
Aonides paucibranchi<strong>at</strong>a Southern x x x x<br />
Scolelepis bonnieri Mesnil x x x<br />
Magelona mirabilis (Johnston) x<br />
Cirr<strong>at</strong>ulidae indet. x<br />
Euzonus flabelligerus (Ziegelmeier) x x<br />
Travisia forbesii Johnston x x x x x<br />
Ophelia borealis Qu<strong>at</strong>refages x x x x x<br />
Polygordius appendicul<strong>at</strong>us Fraipont x x x<br />
Polygordius sp. x<br />
Notomastus l<strong>at</strong>ericeus Sars x<br />
Heteromastus filiformis Claparede x<br />
Arenicola marina (L.) x S<strong>and</strong>orm Blow lug<br />
Terebellidae indet. x<br />
Lanice conchilega (Pallas) x<br />
HYDRACARINA V<strong>and</strong>mider Mites<br />
Halacaridae indet. x x<br />
COPEPODA V<strong>and</strong>lopper Copepods<br />
Copepoda indet. x x<br />
Cyclopoida indet. x<br />
Harpacticoida indet. x x x x x<br />
Harpacticus sp. x<br />
CUMACEA Kommakrebs Cumaceans<br />
Diastylis sp. x<br />
Pseudocuma longicornis B<strong>at</strong>e x x<br />
TANAIDACEA<br />
Tanaidacea indet. x<br />
CIRRIPEDIA Rurer Barnacles<br />
Balanus sp. x<br />
DECAPODA Tibenede krebsdyr Shrimps, Crabs & Lobsters<br />
Crangon crangon L. x x x x x Hestereje Brown shrimp<br />
Carcinus maenas L. x Str<strong>and</strong>krabbe Common shore crab<br />
Liocarcinus pusillus (Leach) x Svømmekrabbe Harbour crab<br />
Pagurus bernhardus L. x x x Eremitkrebs Hermit crap<br />
MYSIDACEA Mysider Opossum shrimps<br />
Mysidacea indet. x x<br />
Gastrosaccus spinifer Göes x x x<br />
Praunus flexuosus (O.F.Müller) x<br />
AMPHIPODA Tanglopper S<strong>and</strong> hoppers<br />
B<strong>at</strong>hyporeia guilliamsoniana B<strong>at</strong>e x x<br />
B<strong>at</strong>hyporeia sp. x x<br />
Haustorius arenarius Slabber x x x<br />
Eurysteus nitida (Stimpson) x x<br />
Metopidae indet. x<br />
Metopa sp. x<br />
Stenothoe sp. x<br />
Oedicerotidae indet. x<br />
Perioculodes longimanus B<strong>at</strong>e & Westwood x<br />
Pontocr<strong>at</strong>us altamarinus B<strong>at</strong>e & Westwood x x<br />
Pontocr<strong>at</strong>es arenarius B<strong>at</strong>e x x x x x<br />
Pontocr<strong>at</strong>es sp. x<br />
Westwoodilla caecula B<strong>at</strong>e x x<br />
Megaleuropus agilis Hoek x<br />
Jassa marmor<strong>at</strong>a Holmes x x<br />
Atylus swammerdami Milne-Edwards x x<br />
Caprella linearis L. x<br />
Caprella sp. x<br />
GASTROPODA Snegle Snails<br />
Hydrobia ulvae Montagu x x<br />
Crepidula fornic<strong>at</strong>a (L.) x Tøffelsnegl Slipper lilmpet<br />
Polinices polianus (delle Chiaje) x x x x x<br />
BIVALVIA Muslinger Mussels<br />
Bivalvia indet. x x<br />
Mytilus edulis L. x x x Blåmusling Common mussel<br />
Goodallia triangularis (Montagu x x x x x<br />
Spisula elliptica (Brown) x x<br />
Spisula solida (L.) x x x x Tykskallet trugmusling Thick trough shell<br />
Angulus tenuis (Da Costa) x x<br />
Fabulina fabula (Gmelin) x<br />
Arctica isl<strong>and</strong>ica (L.) x x<br />
Chamelea gallina (L.) x<br />
Thracia phaseolina (Lamarck) x x x x Papirmusling<br />
Ensis americanus (Gould in Binney) x x Amerikansk knivmusling Razor shell<br />
BRYOZOA Mosdyr Bryozoans<br />
Bryozoa indet. x<br />
Electra pilosa (L.) x x<br />
ECHINODERMATA Pighude Echinoderms<br />
Asterias rubens L. x x Alm. Søstjerne Common starfish<br />
Ophiura albida Forbes x x<br />
Ophiura ophiura x<br />
Echinocyamus pusillus O.F. Müller x x<br />
Echinocardium cord<strong>at</strong>um (Pennant) x<br />
ASCIDIACEA Søpunge Sea squirts<br />
Ascidia indet. x<br />
CHAETOGHNATHA Pilorme Arrow worms<br />
Sagitta sp. x<br />
CORDATA Trævlemunde Cephalocord<strong>at</strong>a<br />
Branchiostoma lanceol<strong>at</strong>um (Pallas) x x x x x<br />
Doc. No. 2572-03-005 rev. 4
<strong>Horns</strong> <strong>Rev</strong>. <strong>Benthic</strong> communities Page 94<br />
.<br />
8.2.2. Appendix2.2. Algae<br />
Complete list of species. <strong>Horns</strong> <strong>Rev</strong> 2003-2005<br />
2003 2004 2005<br />
Common Names<br />
Group Taxon<br />
Red algae<br />
Author Mar. Sept. Mar. Sept. Mar. Sept. Danish English<br />
Porphyra umbilicalis (Roth) x x Rød purpurhinde Purple laver<br />
Hildenbr<strong>and</strong>ia rubra (Sommerfelt) Meneghini x x x x Hav-hildenbr<strong>and</strong>ia Balanus-Hildenbr<strong>and</strong>ia-mucosa<br />
Hildenbr<strong>and</strong>iales indet. 1 x Rødskorper, kødede<br />
Hildenbr<strong>and</strong>iales indet. 2 x Rødkødskorp, tyk<br />
Corallina officinalis L. x Koralalge Coral moss<br />
Coccotylus trunc<strong>at</strong>us Phallas x x x Kile-rødblad<br />
Phyllophora pseudoceranoides (S.G. Gmelin) x Fliget rødblad<br />
Polysiphonia fibrillosa (Dillwyn) x x Violet ledtang<br />
Callithamnion corymbosum Lyngbye x x x x Tæt rødsky<br />
Brown algae<br />
Pilayella littoralis Kjellman x x x x x Duntang<br />
Ectocarpus sp. x x x v<strong>at</strong>alge<br />
Petalonia fascia (O.F. Müller) x x x x x x Alm. båndtang Sea petals<br />
Petalonia zosterifolia (Reinke) Kuntze x Græsbladet båndtang<br />
Ralfsia verrucosa Areschoug x Vortet ralfsiaskorpe<br />
Ralfsia sp. x<br />
Desmarestia acule<strong>at</strong>a L. x x x Alm. kællingehår L<strong>and</strong>lady's wig<br />
Green algae<br />
Blidingia minima Kützing x Lille krusrørhinde<br />
Chaetomorpha linum (O.F. Müller) x x Krølhårstang<br />
Ulva (Enteromorpha) cl<strong>at</strong>hr<strong>at</strong>a (Roth) x Fin rørhinde<br />
Ulva (Enteromorpha) intestinalis L. x Tarm-rørhinde Gut-weed<br />
Ulva lactuca L. x x x x x Søsal<strong>at</strong> Green laver<br />
c Ulva (Enteromorpha) linza L. x Bred rørhinde<br />
Ulva (Enteromorpha) prolifera (O.F. Müller) x Centralgrenet rørhinde<br />
Ulva (Enteromorpha) sp. x x x x x x Rørhinde<br />
Urospora penicilliformis Areschoug x Grøn frynsealge<br />
Cladophora sp. x x x V<strong>and</strong>hår Slobán<br />
8.2.3. Appendix 2.3. Fish<br />
Complete list of species. <strong>Horns</strong> <strong>Rev</strong> 2003-2005<br />
2003 2004 2005<br />
Common Names<br />
Group Taxon<br />
Actinopterygii<br />
Author Mar. Sept. Test Mar. Sept. Test Mar. Sept. Test Danish English<br />
Spr<strong>at</strong>tus spr<strong>at</strong>tus L. x Brislinig European spr<strong>at</strong><br />
Gadus morhua L. x x x x x Alm. Torsk Atlantic cod<br />
Trisopterus luscus L. x x x x x Skægtorsk Bib (Pouting )<br />
Merlangius merlangus L. x x x Hvilling Whiting<br />
Pollachius virens L. x x x x Sej Pollock (Saithe )<br />
Syngn<strong>at</strong>hus typhle L. x Almindelig tangnål Broad-nosed pipefish<br />
Myoxocephalus scorpius L. x x x x x x x x Alm. Ulk Shorthorn sculpin<br />
Agonus c<strong>at</strong>aphractus L. x x x x x Panserulk Hooknose<br />
Taurulus bubaris Euphrasen x x x Langtornet ulk Longspined bullhead<br />
Trachurus trachurus L. x x Hestemakrel Horse mackerel<br />
Mullus surmuletus L. x Stribet mulle Striped red mullet<br />
Labrus bergylta Ascanius x Berggylte Ballan wrasse<br />
Symphodus melops L. x Savgylte Corkwing wrasse<br />
Ctenolabrus rupestris L. x x x x x Havkaruds Goldsinny-wrasse<br />
Cyclopteus lumpus L. x Stenbider Lumpsucker<br />
Zoarces viviparus L. x x x Ålekvabbe Viviparous blenny<br />
Ammodytes tobianus L. x x x x x Kysttobis Small s<strong>and</strong>eel<br />
Pholis gunnellus L. x x x x x Tangspræl Rock gunnel<br />
Callionymus lyra L. x x Fløjfisk Dragonet<br />
Pom<strong>at</strong>oschistus minutus Pallas x x x x S<strong>and</strong>kutling S<strong>and</strong> goby<br />
Pom<strong>at</strong>oschistus pictus Malm x Spættet kutling Painted goby<br />
Scomber scombrus L. x Alm. Makrel Atlantic mackerel<br />
Doc. No. 2572-03-005 rev. 4
<strong>Horns</strong> <strong>Rev</strong>. <strong>Benthic</strong> communities Page 95<br />
.<br />
8.2.4. Appendix 2.4. Hard bottom substr<strong>at</strong>e. Benthos<br />
Complete List of species. <strong>Horns</strong> <strong>Rev</strong> 2003-2005<br />
2003 2004 2005<br />
Common names<br />
Group Taxon Author Samples Transects Samples Transects Samples Transects Danish English<br />
Mar. Sept. Mar. Sept. Mar. Sept. Mar. Sept. Mar. Sept. Mar. Sept.<br />
PORIFERA<br />
Halichondria panicea Pallas x x x x x Brødkrummesvamp Breadcrumb sponge<br />
Porifera indet.<br />
HYDROZOA<br />
x x<br />
Hydrozoa indet. x x x x x x x<br />
Tubulariidae indet. x<br />
Tubularia indivisa (x) x x x x x x x x x x x Stor rørpolyp O<strong>at</strong>en pipes hydroid<br />
Thec<strong>at</strong>a indet. x<br />
Hydractinia echin<strong>at</strong>a Fleming x x x Pindsvinepolyp<br />
Campanulariidae indet. x x x x x x x x Cyprespolyp<br />
Sertularia cupressina<br />
ANTHOZOA<br />
(L.) x x x x x Havcypres White weed<br />
Anthozoa indet. x<br />
Alcyonium digit<strong>at</strong>um L. x x x x x x x x Dødningehånd Dead man's fingers<br />
Actiniaria indet. x x x x x x x x x x x x<br />
Actinaridae indet. x<br />
Urticina feline L. x x Søgeorgine Dahlia anemone<br />
Metridium senile L. x x x x x x Sønellike Plumose anemone<br />
Sargartia elegans (Dalyell) x x<br />
Sargartiogeton lacer<strong>at</strong>us<br />
NEMERTINI<br />
(Dalyell) x x Knopfodet søanemone<br />
Nemertini indet.<br />
NEMATODA<br />
x x x x x x x x x<br />
Nem<strong>at</strong>oda indet.<br />
POLYCHAETA<br />
x x x x x<br />
Lepidonotus squam<strong>at</strong>us (L.) x x<br />
Harmothoe imbric<strong>at</strong>a (L.) x x x x x<br />
Harmothoe impar (Johnston) x x x x x x<br />
Phyllodocidea indet. x x x x x<br />
Phyllodoce groenl<strong>and</strong>ica Ørsted x x x x x x<br />
Eulalia viridis (L.) x x x x x x<br />
Hesionidae indet. x<br />
Ophiodromus flexuosus (Delle Chiaje) x x<br />
Syllidae indet. x x x x<br />
Nereididae indet. x<br />
Nereis pelagica L x x x<br />
Neanthes virens (Sars) x x<br />
Polydora cili<strong>at</strong>a Johnston x x x x<br />
Polydora cornuta Bosc x<br />
Cirr<strong>at</strong>ulidae indet. x<br />
Chaetopterus norvegicus Sars x x x<br />
Capitella capit<strong>at</strong>a (Fabricius) x x x<br />
Arenicola marina (L.) x S<strong>and</strong>orm Lugworm<br />
Terebellidae indet. x<br />
Lanice conchilega (Pallas) x x x x x x x x x S<strong>and</strong> mason<br />
Sabellaria spinulosa Leukart x Ross worm<br />
Sabellaria sp. x<br />
Pom<strong>at</strong>oceros triqueter<br />
PYCNOGONIDAE<br />
(L.) x x x x x x x x x x x x Kalkrørsorm Keelworm<br />
Phoxichilidium femor<strong>at</strong>um<br />
COPEPODA<br />
(R<strong>at</strong>hke) x<br />
Copepoda indet. x<br />
Harpacticoida indet.<br />
CIRRIPEDIA<br />
x<br />
Verruca stroemia O.F. Müller x x x x x x Skæv rur<br />
Balanus balanus L. x x x x x x x x x x Stor rur<br />
Balanus cren<strong>at</strong>us Bruguiere x x x x x x x x x x x x Kølet rur<br />
Balanus sp.<br />
DECAPODA<br />
x x<br />
Caridea indet. x<br />
Crangon crangon (L.) x Alm. Hestereje Brown shrimp<br />
Corystes cassivelaunus Pennant x x Maskekrabbe Masked crab<br />
Cancer pagurus L. x x x x x x x x x x x x Taskekrabbe Edible crab<br />
Carcinus maenas L. x x x x x x Str<strong>and</strong>krabbe Common shore crab<br />
Liocarcinus depur<strong>at</strong>or (L.) x x x x x x x x Svømmekrabbe Harbour crab<br />
Macropodia rostr<strong>at</strong>a (L.) x Stankelbenskrabbe Long legged spider crab<br />
Pilumnus hirtellus (L.) x Bristly crab<br />
Pisidia longicornis (L.) x x x Porcelænskrabbe Long clawed porcelain crab<br />
Pagurus bernhardus<br />
AMPHIPODA<br />
L. x x x x x x Eremitkrebs Hermit crab<br />
Corophium crassicorne Bruzelius x x<br />
Aoridae indet. x<br />
Stenothoe marina B<strong>at</strong>e x<br />
Stenothoe sp. x<br />
Jassa marmor<strong>at</strong>a Holmes x x x x x x x x x x x x<br />
Atylus swammerdami Milne-Edwards x x x<br />
Caprella linearis L. x x x x x x x x x x x x<br />
Hyperia galba<br />
CHIRONOMIDAE<br />
Montagu x<br />
Chironomidae indet. x<br />
Telm<strong>at</strong>ogeton japonicus<br />
GASTROPODA<br />
Tokunaga x x x x x x x x x x x x<br />
Gastropoda indet. x x<br />
Rissoidae indet. x x x x x x<br />
Crepidula fornic<strong>at</strong>a (L.) x x x x x x x x x x x x Tøffelsnegl Slipper limpet<br />
Polinices polianus (delle Chiaje) x x Lille boresnegl Alder's necklace shell<br />
Polinices sp. x<br />
Epitonium cl<strong>at</strong>hrus (L.) x Alm. Vindeltrappesnegl Common wentletrap<br />
Buccinum und<strong>at</strong>um L. x x x x x Alm. Konk Common whelk<br />
Hinia pygmaea (Lamarck) x x Lille dværgkonk Netted dog whelk<br />
Nudibranchia indet. x x x x x x x x x<br />
Onchidoris muric<strong>at</strong>a (Møller) x x x x x x x x x x x Hvid doride<br />
Polycera quadriline<strong>at</strong>a (Møller) x x x x x x x x Stribet nøgensnegl<br />
Facelina bostoniensis (Couthouy) x x x x x<br />
Aeolidacea indet. x<br />
Aeolidia papillosa Order: NUDIBRANCHIA x x x x x x x x Stor trådsnegl Grey sea slug<br />
Doc. No. 2572-03-005 rev. 4
<strong>Horns</strong> <strong>Rev</strong>. <strong>Benthic</strong> communities Page 96<br />
.<br />
Complete List of species. <strong>Horns</strong> <strong>Rev</strong> 2003-2005<br />
2003 2004 2005<br />
Common names<br />
Group Taxon Author Samples Transects Samples Transects Samples Transects<br />
Danish English<br />
Mar. Sept. Mar. Sept. Mar. Sept. Mar. Sept. Mar. Sept. Mar. Sept.<br />
BIVALVIA<br />
Bivalvia indet. x<br />
Mytilus edulis L. x x x x x x x x x x x x Blåmusling Common mussel<br />
Modiolarca tumida (Hanley) x Opsvulmet blåmusling Marbled crenella<br />
Ostrea edulis L. x x x Europæisk østers N<strong>at</strong>ive oysters<br />
Tridonta borealis Schumacher x Stor astartemusling<br />
Heteranomia squamula (L.) x x x x x Lille sadelmusling<br />
Angulus tenuis (Da Costa) x x Alm. tallerkenmusling Thin tellin<br />
Fabulina fabula (Gmelin) x Stribet tallerkenmusling Bean-like tellin<br />
Moerella donacina (L.) x x<br />
Moerella pygmaea Lovén x x<br />
Goodallia triangularis (Montagu x<br />
Venerupis senegalensis (Gmelin) x<br />
Spisula solida (L.) x Tykskallet trugmusling Thick trough shell<br />
Donax vitt<strong>at</strong>us (da Costa) x Kilemusling<br />
Hi<strong>at</strong>ella arctica (L.) x x x x x Hulemusling Wrinkled rock borer<br />
Thracia phaseolina (Lamarck) x x x x Papirmusling<br />
Phaxas pellucidus (Pennant) x Lille knivmusling<br />
Ensis americanus (Gould) x x Amerikansk knivmusling Razor shell<br />
Polyplacophora indet.<br />
BRYOZOA<br />
x<br />
Bryozoa indet. x x x x x x x x<br />
Electra pilosa (L.) x x x x x x x x x x Pigget hindemosdyr<br />
Flustra foliacea (L.) x Bredt bladmosdyr Hornwrack<br />
Alcyonidium sp.<br />
ECHINODERMATA<br />
Lamouroux x x x x x x x<br />
Asterias rubens L. x x x x x x x x x x x x Alm. Søstjerne Common starfish<br />
Ophiura albida Forbes x x x x<br />
Strongylocentrotus droebachiensis (O.F. Müller) x x x x x x x x Grønt søpindsvin Northern sea urchin<br />
Echinocardium cord<strong>at</strong>um<br />
ASCIDIACEA<br />
(Pennant) x Sømus Sea pot<strong>at</strong>o<br />
Tunic<strong>at</strong>a indet. x<br />
Doc. No. 2572-03-005 rev. 4
<strong>Horns</strong> <strong>Rev</strong>. <strong>Benthic</strong> communities Page 97<br />
.<br />
Doc. No. 2572-03-005 rev. 4
<strong>Horns</strong> <strong>Rev</strong>. <strong>Benthic</strong> communities Page 98<br />
.<br />
8.3. Appendix 3. Infauna<br />
8.3.1. Appendix 3.1. Infauna mean abundance 1999-2004<br />
Abundance - 4 years: Year<br />
2001<br />
Campaign<br />
Autumn<br />
Wind Farm area<br />
2003<br />
Campaign<br />
Autumn<br />
Abundance, number/m² Mean Rel<strong>at</strong>ive % Mean Rel<strong>at</strong>ive % Mean Rel<strong>at</strong>ive % Mean Rel<strong>at</strong>ive % Mean Rel<strong>at</strong>ive % Mean Rel<strong>at</strong>ive %<br />
HYDROZOA Hydractinia echin<strong>at</strong>a<br />
225,84 12,1% 2,26 ,2% . . 13,55 ,5% 6,78 ,6% . .<br />
Campanulariidae indet.<br />
. . 4,52 ,4% 4,52 ,3% . . . . . .<br />
Tubularia indivisa<br />
. . 2,26 ,2% . . . . . . . .<br />
ANTHOZOA Actiniaria indet.<br />
. . 2,26 ,2% 2,26 ,2% . . . . . .<br />
GOPLER<br />
Beroe cucumis<br />
. . . . . . 13,55 ,5% . . . .<br />
NEMERTINI Nemertini indet.<br />
27,10 1,4% 4,52 ,4% 9,03 ,6% 40,65 1,6% 13,55 1,2% 6,78 ,8%<br />
NEMATODA Nem<strong>at</strong>oda indet.<br />
121,95 6,5% 4,52 ,4% 6,78 ,5% 40,65 1,6% . . . .<br />
POLYCHAETA Protodorvillea kefersteini<br />
. . . . . . 440,38 17,0% . . . .<br />
Pisione remota<br />
411,02 22,0% 22,58 2,0% 85,82 5,8% 691,06 26,7% 13,55 1,2% 6,78 ,8%<br />
Goniadella bobretzkii<br />
189,70 10,1% 146,79 12,9% 65,49 4,5% 338,75 13,1% 149,05 12,7% 33,88 4,2%<br />
Travisia forbesii<br />
. . 9,03 ,8% 94,85 6,5% 155,83 6,0% 20,33 1,7% 20,33 2,5%<br />
Ophelia borealis<br />
72,27 3,9% 11,29 1,0% 9,03 ,6% 149,05 5,8% 13,55 1,2% . .<br />
Spio filicornis<br />
90,33 4,8% 20,33 1,8% 27,10 1,8% 27,10 1,0% 40,65 3,5% 13,55 1,7%<br />
Orbinia sertul<strong>at</strong>a<br />
. . 9,03 ,8% 15,81 1,1% 101,63 3,9% 13,55 1,2% 6,78 ,8%<br />
Nephtys hombergii<br />
. . . . . . 20,33 ,8% . . . .<br />
Nephtys longosetosa<br />
4,52 ,2% . . . . 33,88 1,3% . . . .<br />
Scolelepis bonnieri<br />
36,13 1,9% . . 2,26 ,2% 6,78 ,3% . . . .<br />
Nephtys sp,<br />
. . 15,81 1,4% . . 6,78 ,3% 13,55 1,2% . .<br />
Eulalia viridis<br />
9,03 ,5% . . . . . . . . . .<br />
Spionidae indet.<br />
. . . . 9,03 ,6% . . . . . .<br />
Polygordius appendicul<strong>at</strong>us<br />
. . 13,55 1,2% 6,78 ,5% . . 6,78 ,6% . .<br />
Nephtys caeca<br />
. . 4,52 ,4% 6,78 ,5% . . 13,55 1,2% . .<br />
Pholoe sp.<br />
. . . . . . 6,78 ,3% . . . .<br />
Magelona mirabilis<br />
. . . . . . 6,78 ,3% . . . .<br />
Euzonus flabelligerus<br />
. . . . . . . . 6,78 ,6% 6,78 ,8%<br />
Lanice conchilega<br />
. . . . . . . . 6,78 ,6% . .<br />
Polychaeta indet.<br />
4,52 ,2% . . . . . . . . . .<br />
Arenicola marina<br />
. . 4,52 ,4% . . . . . . . .<br />
Scoloplos armiger<br />
4,52 ,2% . . 2,26 ,2% . . . . . .<br />
Glycera alba<br />
. . . . 2,26 ,2% . . . . . .<br />
Aonides paucibranchi<strong>at</strong>a<br />
. . . . 2,26 ,2% . . . . . .<br />
Glycera sp.<br />
. . . . . . . . . . . .<br />
Polygordius sp.<br />
. . . . . . . . . . . .<br />
HYDROCARINA Halacaridae indet,<br />
. . 2,26 ,2% . . . . . . . .<br />
CRUSTACEA Balanus sp.<br />
135,50 7,2% . . . . . . . . . .<br />
Metopidae indet.<br />
. . . . . . 40,65 1,6% . . . .<br />
Cyclopoida indet.<br />
36,13 1,9% . . . . . . . . . .<br />
Jassa marmor<strong>at</strong>a<br />
. . 40,65 3,6% 40,65 2,8% . . . . 20,33 2,5%<br />
Haustorius arenarius<br />
4,52 ,2% 2,26 ,2% . . 47,43 1,8% . . . .<br />
Westwoodilla caecula<br />
18,07 1,0% . . . . . . . . . .<br />
Pontocr<strong>at</strong>es arenarius<br />
4,52 ,2% 6,78 ,6% 6,78 ,5% 47,43 1,8% 20,33 1,7% 6,78 ,8%<br />
Gastrosaccus spinifer<br />
13,55 ,7% . . 24,84 1,7% . . . . 6,78 ,8%<br />
Crangon crangon<br />
. . . . 2,26 ,2% 13,55 ,5% 6,78 ,6% 13,55 1,7%<br />
B<strong>at</strong>hyporeia sp.<br />
. . . . 9,03 ,6% . . . . . .<br />
Eurysteus nitida<br />
4,52 ,2% . . . . 13,55 ,5% . . . .<br />
Pontocr<strong>at</strong>es sp.<br />
9,03 ,5% . . . . . . . . . .<br />
Caprella linearis<br />
. . 9,03 ,8% . . . . . . . .<br />
Harpacticoida indet.<br />
4,52 ,2% 11,29 1,0% 4,52 ,3% 13,55 ,5% . . . .<br />
Carcinus maenas<br />
. . . . . . 6,78 ,3% . . . .<br />
Pagurus bernhardus<br />
4,52 ,2% 2,26 ,2% . . 13,55 ,5% 6,78 ,6% . .<br />
B<strong>at</strong>hyporeia guilliamsoniana<br />
4,52 ,2% . . 9,03 ,6% . . . . . .<br />
Oedicerotidae indet.<br />
. . . . . . 6,78 ,3% . . . .<br />
Mysidacea indet.<br />
9,03 ,5% . . 2,26 ,2% . . . . . .<br />
Atylus swammerdami<br />
9,03 ,5% . . 2,26 ,2% . . . . . .<br />
Diastylis sp.<br />
4,52 ,2% . . . . . . . . . .<br />
Pseudocuma longicornis<br />
4,52 ,2% . . . . . . . . . .<br />
Metopa sp.<br />
4,52 ,2% . . . . . . . . . .<br />
Stenothoe sp.<br />
4,52 ,2% . . . . . . . . . .<br />
Liocarcinus pusillus<br />
. . 2,26 ,2% . . . . . . . .<br />
GASTROPODA Polinices polianus<br />
9,03 ,5% 11,29 1,0% 6,78 ,5% 6,78 ,3% 6,78 ,6% 6,78 ,8%<br />
Hydrobia ulvae<br />
. . . . 6,78 ,5% . . . . 6,78 ,8%<br />
Crepidula fornic<strong>at</strong>a<br />
. . 2,26 ,2% . . . . . . . .<br />
BIVALVIA Goodallia triangularis<br />
203,25 10,9% 663,96 58,3% 862,69 58,7% 237,13 9,2% 630,08 53,8% 616,53 75,8%<br />
Ensis ensis<br />
. . . . . . . . 60,98 5,2% . .<br />
Thracia phaseolina<br />
45,17 2,4% 36,13 3,2% 58,72 4,0% . . 33,88 2,9% 20,33 2,5%<br />
Arctica isl<strong>and</strong>ica<br />
31,62 1,7% . . . . . . . . . .<br />
Spisula solida<br />
36,13 1,9% 20,33 1,8% 13,55 ,9% 33,88 1,3% 27,10 2,3% 13,55 1,7%<br />
Mytilus edulis<br />
49,68 2,7% 6,78 ,6% 29,36 2,0% . . 13,55 1,2% 6,78 ,8%<br />
Bivalvia indet,<br />
4,52 ,2% . . . . . . 13,55 1,2% . .<br />
Fabulina fabula<br />
. . . . . . 6,78 ,3% . . . .<br />
Angulus tenuis<br />
. . 2,26 ,2% . . . . . . . .<br />
Chamelea gallina<br />
. . . . 2,26 ,2% . . . . . .<br />
Spisula elliptica<br />
. . ,00 ,0% . . . . . . . .<br />
BRYOZOA Electra pilosa<br />
4,52 ,2% . . 9,03 ,6% . . . . . .<br />
Bryozoa indet,<br />
. . 2,26 ,2% . . . . . . . .<br />
ECHINODERMATA Ophiura ophiura<br />
. . . . . . . . 6,78 ,6% . .<br />
Asterias rubens<br />
. . 6,78 ,6% 2,26 ,2% . . . . . .<br />
Echinocyamus pusillus<br />
. . 4,52 ,4% 4,52 ,3% . . . . . .<br />
Ophiura albida<br />
. . . . 2,26 ,2% . . . . . .<br />
Echinocardium cord<strong>at</strong>um<br />
. . . . 2,26 ,2% . . . . . .<br />
CHAETOGHNATHA Sagitta sp.<br />
4,52 ,2% . . . . . . . . . .<br />
CHORDATA Branchiostoma lanceol<strong>at</strong>um<br />
9,03 ,5% 27,10 2,4% 15,81 1,1% 6,78 ,3% 27,10 2,3% . .<br />
2004<br />
Campaign<br />
Autumn<br />
Sampling area<br />
1999<br />
Campaign<br />
Spring<br />
Reference area<br />
2003<br />
Campaign<br />
Autumn<br />
2004<br />
Campaign<br />
Autumn<br />
Doc. No. 2572-03-005 rev. 4
<strong>Horns</strong> <strong>Rev</strong>. <strong>Benthic</strong> communities Page 99<br />
.<br />
8.3.2. Appendix 3.2. Infauna mean abundance 1999-2005 (spring)<br />
CS Study area = Extended reference area<br />
Abundance - Spring: Year/Area<br />
1999<br />
2001<br />
2005<br />
Total<br />
Spring<br />
Reference<br />
Wind Turbine Area<br />
Wind Turbine Area<br />
Reference<br />
CS Study Area<br />
Wind Turbine Area<br />
Abundance, number/m² Mean Col Sum % Mean Col Sum % Mean Col Sum % Mean Col Sum % Mean Col Sum % Mean Col Sum % Mean Col Sum %<br />
Goodallia triangularis BIVALVIA<br />
54.20 10.1% 199.56 31.8% 153.57 16.4% 758.81 61.5% 197.09 26.8% 474.25 40.7% 1837.48 35.1%<br />
Pisione remota<br />
POLYCHAETA<br />
74.53 13.9% 206.95 32.9% 176.15 18.8% 108.40 8.8% 169.99 23.2% 203.25 17.4% 939.27 18.0%<br />
Goniadella bobretzkii POLYCHAETA<br />
81.30 15.2% 51.74 8.2% 128.73 13.8% 67.75 5.5% 51.74 7.0% 108.40 9.3% 489.65 9.4%<br />
Travisia forbesii<br />
POLYCHAETA<br />
40.65 7.6% 14.78 2.4% . . 54.20 4.4% 9.85 1.3% 81.30 7.0% 200.79 3.8%<br />
Thracia phaseolina BIVALVIA<br />
. . . . 58.72 6.3% . . 41.88 5.7% 54.20 4.7% 154.80 3.0%<br />
Spio filicornis<br />
POLYCHAETA<br />
6.78 1.3% 14.78 2.4% 94.85 10.1% 13.55 1.1% . . 13.55 1.2% 143.51 2.7%<br />
Ensis americanus<br />
BIVALVIA<br />
. . . . . . 40.65 3.3% 101.01 13.8% . . 141.66 2.7%<br />
Ophelia borealis<br />
POLYCHAETA<br />
54.20 10.1% 7.39 1.2% 47.43 5.1% 13.55 1.1% 12.32 1.7% . . 134.89 2.6%<br />
Polygordius appendicul<strong>at</strong>us POLYCHAETA<br />
. . . . . . 27.10 2.2% 34.49 4.7% 67.75 5.8% 129.34 2.5%<br />
Nemertini indet.<br />
NEMERTINI<br />
6.78 1.3% . . 15.81 1.7% 13.55 1.1% 4.93 .7% 81.30 7.0% 122.36 2.3%<br />
Nephtys sp.<br />
POLYCHAETA<br />
. . . . 13.55 1.4% 67.75 5.5% 17.25 2.3% . . 98.55 1.9%<br />
Orbinia sertul<strong>at</strong>a<br />
POLYCHAETA<br />
40.65 7.6% 7.39 1.2% 24.84 2.7% . . . . 13.55 1.2% 86.43 1.7%<br />
Pontocr<strong>at</strong>es arenarius CRUSTACEA<br />
20.33 3.8% 7.39 1.2% . . 13.55 1.1% 2.46 .3% 27.10 2.3% 70.83 1.4%<br />
Spisula solida<br />
BIVALVIA<br />
13.55 2.5% 7.39 1.2% 31.62 3.4% . . 2.46 .3% . . 55.02 1.1%<br />
Nem<strong>at</strong>oda indet.<br />
NEMATODA<br />
6.78 1.3% 14.78 2.4% 13.55 1.4% . . 7.39 1.0% . . 42.50 .8%<br />
Metopidae indet.<br />
CRUSTACEA<br />
40.65 7.6% . . . . . . . . . . 40.65 .8%<br />
B<strong>at</strong>hyporeia sp.<br />
CRUSTACEA<br />
. . . . 38.39 4.1% . . . . . . 38.39 .7%<br />
Nephtys hombergii<br />
POLYCHAETA<br />
6.78 1.3% 29.56 4.7% . . . . . . . . 36.34 .7%<br />
Haustorius arenarius CRUSTACEA<br />
27.10 5.1% 7.39 1.2% . . . . . . . . 34.49 .7%<br />
Polinices polianus<br />
GASTROPODA<br />
. . . . 4.52 .5% 27.10 2.2% 2.46 .3% . . 34.08 .7%<br />
Pontocr<strong>at</strong>es altamarinus CRUSTACEA<br />
. . . . 31.62 3.4% . . . . . . 31.62 .6%<br />
Nephtys longosetosa POLYCHAETA<br />
13.55 2.5% 14.78 2.4% 2.26 .2% . . . . . . 30.59 .6%<br />
Aonides paucibranchi<strong>at</strong>a POLYCHAETA<br />
. . . . . . . . 29.56 4.0% . . 29.56 .6%<br />
Copepoda indet.<br />
CRUSTACEA<br />
. . . . 9.03 1.0% . . 4.93 .7% 13.55 1.2% 27.51 .5%<br />
Gastrosaccus spinifer CRUSTACEA<br />
. . . . 9.03 1.0% 13.55 1.1% 2.46 .3% . . 25.05 .5%<br />
Harpacticoida indet. CRUSTACEA<br />
. . 14.78 2.4% 6.78 .7% . . 2.46 .3% . . 24.02 .5%<br />
Branchiostoma lanceol<strong>at</strong>um CHORDATA<br />
. . . . . . . . 9.85 1.3% 13.55 1.2% 23.40 .4%<br />
Scoloplos armiger<br />
POLYCHAETA<br />
. . . . . . 13.55 1.1% 4.93 .7% . . 18.48 .4%<br />
Mytilus edulis<br />
BIVALVIA<br />
. . . . 18.07 1.9% . . . . . . 18.07 .3%<br />
Hydractinia echin<strong>at</strong>a HYDROZOA<br />
13.55 2.5% . . . . . . . . . . 13.55 .3%<br />
Notomastus l<strong>at</strong>ericeus POLYCHAETA<br />
. . . . . . . . . . 13.55 1.2% 13.55 .3%<br />
Pagurus bernhardus CRUSTACEA<br />
13.55 2.5% . . . . . . . . . . 13.55 .3%<br />
Eurysteus nitida<br />
CRUSTACEA<br />
13.55 2.5% . . . . . . . . . . 13.55 .3%<br />
Glycera alba<br />
POLYCHAETA<br />
. . . . 6.78 .7% . . 4.93 .7% . . 11.70 .2%<br />
Hydrobia ulvae<br />
GASTROPODA<br />
. . . . 11.29 1.2% . . . . . . 11.29 .2%<br />
Protodorvillea kefersteini POLYCHAETA<br />
. . 7.39 1.2% . . . . 2.46 .3% . . 9.85 .2%<br />
Tanaidacea indet.<br />
CRUSTACEA<br />
. . 7.39 1.2% . . . . . . . . 7.39 .1%<br />
Praunus flexuosus<br />
CRUSTACEA<br />
. . 7.39 1.2% . . . . . . . . 7.39 .1%<br />
Angulus tenuis<br />
BIVALVIA<br />
. . 7.39 1.2% . . . . . . . . 7.39 .1%<br />
Oedicerotidae indet. CRUSTACEA<br />
6.78 1.3% . . . . . . . . . . 6.78 .1%<br />
B<strong>at</strong>hyporeia guilliamsoniana CRUSTACEA<br />
. . . . 6.78 .7% . . . . . . 6.78 .1%<br />
Electra pilosa<br />
BRYOZOA<br />
. . . . 6.78 .7% . . . . . . 6.78 .1%<br />
Dorvilleidae indet.<br />
POLYCHAETA<br />
. . . . . . . . 4.93 .7% . . 4.93 .1%<br />
Pseudocuma longicornis CRUSTACEA<br />
. . . . . . . . 4.93 .7% . . 4.93 .1%<br />
Heteromastus filiformis POLYCHAETA<br />
. . . . 4.52 .5% . . . . . . 4.52 .1%<br />
Megaluropus agilis<br />
CRUSTACEA<br />
. . . . 4.52 .5% . . . . . . 4.52 .1%<br />
Cirr<strong>at</strong>ulidae indet.<br />
POLYCHAETA<br />
. . . . . . . . 2.46 .3% . . 2.46 .0%<br />
Crangon crangon<br />
CRUSTACEA<br />
. . . . . . . . 2.46 .3% . . 2.46 .0%<br />
Ophiura albida<br />
ECHINODERMATA<br />
. . . . . . . . 2.46 .3% . . 2.46 .0%<br />
Campanulariidae indet. HYDROZOA<br />
. . . . 2.26 .2% . . . . . . 2.26 .0%<br />
Actiniaria indet.<br />
ANTHOZOA<br />
. . . . 2.26 .2% . . . . . . 2.26 .0%<br />
Halacaridae indet,<br />
HYDROCARINA<br />
. . . . 2.26 .2% . . . . . . 2.26 .0%<br />
Perioculodes longimanus CRUSTACEA<br />
. . . . 2.26 .2% . . . . . . 2.26 .0%<br />
Atylus sp.<br />
CRUSTACEA<br />
. . . . 2.26 .2% . . . . . . 2.26 .0%<br />
Caprella sp.<br />
CRUSTACEA<br />
. . . . 2.26 .2% . . . . . . 2.26 .0%<br />
Ascidiacea indet.<br />
ASCIDIACEA<br />
. . . . 2.26 .2% . . . . . . 2.26 .0%<br />
Empty sample<br />
.00<br />
. . . . . . . . .00 .0% . . .00 .0%<br />
Doc. No. 2572-03-005 rev. 4
<strong>Horns</strong> <strong>Rev</strong>. <strong>Benthic</strong> communities Page 100<br />
.<br />
8.3.3. Appendix 3.3. Infauna mean biomass WW. 1999-2004<br />
Biomass - 4 years: Year<br />
2001<br />
Campaign<br />
Autumn<br />
Wind Farm area<br />
2003<br />
Campaign<br />
Autumn<br />
Biomass, wet weight g/m² Mean Rel<strong>at</strong>ive % Mean Rel<strong>at</strong>ive % Mean Rel<strong>at</strong>ive % Mean Rel<strong>at</strong>ive % Mean Rel<strong>at</strong>ive % Mean Rel<strong>at</strong>ive %<br />
HYDROZOA Hydractinia echin<strong>at</strong>a<br />
,000 ,0% ,064 ,0% . . 1,331 ,6% ,001 ,0% . .<br />
Campanulariidae indet.<br />
. . ,026 ,0% ,240 1,0% . . . . . .<br />
Tubularia indivisa<br />
. . ,022 ,0% . . . . . . . .<br />
ANTHOZOA Actiniaria indet.<br />
. . 22,482 12,1% 1,448 6,2% . . . . . .<br />
GOPLER<br />
Beroe cucumis<br />
. . . . . . ,265 ,1% . . . .<br />
NEMERTINI Nemertini indet.<br />
,038 ,0% ,002 ,0% ,013 ,1% ,078 ,0% ,019 ,0% ,001 ,0%<br />
NEMATODA Nem<strong>at</strong>oda indet.<br />
,007 ,0% ,003 ,0% ,003 ,0% ,003 ,0% . . . .<br />
POLYCHAETA Ophelia borealis<br />
7,405 2,5% ,299 ,2% ,054 ,2% 27,560 13,0% 6,654 1,9% . .<br />
Nephtys longosetosa<br />
,940 ,3% . . . . 10,184 4,8% . . . .<br />
Travisia forbesii<br />
. . ,725 ,4% 4,876 20,9% 8,249 3,9% ,259 ,1% 4,048 3,7%<br />
Orbinia sertul<strong>at</strong>a<br />
. . 1,834 1,0% 2,367 10,1% 9,194 4,4% ,614 ,2% ,879 ,8%<br />
Nephtys hombergii<br />
. . . . . . ,428 ,2% . . . .<br />
Lanice conchilega<br />
. . . . . . . . ,387 ,1% . .<br />
Protodorvillea kefersteini<br />
. . . . . . ,322 ,2% . . . .<br />
Polychaeta indet.<br />
,298 ,1% . . . . . . . . . .<br />
Scoloplos armiger<br />
,449 ,1% . . ,084 ,4% . . . . . .<br />
Nephtys caeca<br />
. . ,266 ,1% ,330 1,4% . . ,158 ,0% . .<br />
Scolelepis bonnieri<br />
,068 ,0% . . ,116 ,5% ,476 ,2% . . . .<br />
Arenicola marina<br />
. . ,218 ,1% . . . . . . . .<br />
Goniadella bobretzkii<br />
,184 ,1% ,555 ,3% ,049 ,2% ,245 ,1% ,068 ,0% ,014 ,0%<br />
Nephtys sp,<br />
. . ,204 ,1% . . ,046 ,0% ,215 ,1% . .<br />
Magelona mirabilis<br />
. . . . . . ,137 ,1% . . . .<br />
Spio filicornis<br />
,208 ,1% ,068 ,0% ,051 ,2% ,234 ,1% ,051 ,0% ,009 ,0%<br />
Pisione remota<br />
,035 ,0% ,078 ,0% ,018 ,1% ,174 ,1% ,003 ,0% ,001 ,0%<br />
Spionidae indet.<br />
. . . . ,039 ,2% . . . . . .<br />
Euzonus flabelligerus<br />
. . . . . . . . ,050 ,0% ,027 ,0%<br />
Aonides paucibranchi<strong>at</strong>a<br />
. . . . ,007 ,0% . . . . . .<br />
Polygordius appendicul<strong>at</strong>us<br />
. . ,007 ,0% ,003 ,0% . . ,005 ,0% . .<br />
Glycera alba<br />
. . . . ,003 ,0% . . . . . .<br />
Pholoe sp.<br />
. . . . . . ,001 ,0% . . . .<br />
Eulalia viridis<br />
,001 ,0% . . . . . . . . . .<br />
Glycera sp.<br />
. . . . . . . . . . . .<br />
Polygordius sp.<br />
. . . . . . . . . . . .<br />
HYDROCARINA Halacaridae indet,<br />
. . ,000 ,0% . . . . . . . .<br />
CRUSTACEA Pagurus bernhardus<br />
4,503 1,5% 66,644 35,9% . . 76,295 36,1% 13,311 3,7% . .<br />
Balanus sp.<br />
37,229 12,4% . . . . . . . . . .<br />
Carcinus maenas<br />
. . . . . . 28,392 13,4% . . . .<br />
Crangon crangon<br />
. . . . ,554 2,4% 24,765 11,7% 1,165 ,3% 3,548 3,3%<br />
Haustorius arenarius<br />
,003 ,0% ,482 ,3% . . 5,044 2,4% . . . .<br />
Gastrosaccus spinifer<br />
2,363 ,8% . . ,175 ,7% . . . . ,014 ,0%<br />
Liocarcinus pusillus<br />
. . ,177 ,1% . . . . . . . .<br />
Mysidacea indet.<br />
,089 ,0% . . ,028 ,1% . . . . . .<br />
B<strong>at</strong>hyporeia guilliamsoniana<br />
,003 ,0% . . ,054 ,2% . . . . . .<br />
Jassa marmor<strong>at</strong>a<br />
. . ,016 ,0% ,052 ,2% . . . . ,013 ,0%<br />
Pontocr<strong>at</strong>es arenarius<br />
,004 ,0% ,035 ,0% ,006 ,0% ,079 ,0% ,030 ,0% ,005 ,0%<br />
B<strong>at</strong>hyporeia sp.<br />
. . . . ,017 ,1% . . . . . .<br />
Caprella linearis<br />
. . ,017 ,0% . . . . . . . .<br />
Harpacticoida indet.<br />
,000 ,0% ,012 ,0% ,002 ,0% ,001 ,0% . . . .<br />
Eurysteus nitida<br />
,000 ,0% . . . . ,007 ,0% . . . .<br />
Atylus swammerdami<br />
,007 ,0% . . ,000 ,0% . . . . . .<br />
Metopa sp.<br />
,003 ,0% . . . . . . . . . .<br />
Oedicerotidae indet.<br />
. . . . . . ,003 ,0% . . . .<br />
Westwoodilla caecula<br />
,002 ,0% . . . . . . . . . .<br />
Metopidae indet.<br />
. . . . . . ,001 ,0% . . . .<br />
Cyclopoida indet.<br />
,001 ,0% . . . . . . . . . .<br />
Diastylis sp.<br />
,000 ,0% . . . . . . . . . .<br />
Pseudocuma longicornis<br />
,000 ,0% . . . . . . . . . .<br />
Stenothoe sp.<br />
,000 ,0% . . . . . . . . . .<br />
Pontocr<strong>at</strong>es sp.<br />
,000 ,0% . . . . . . . . . .<br />
GASTROPODA Polinices polianus<br />
3,210 1,1% 7,881 4,2% 1,047 4,5% ,035 ,0% 2,376 ,7% ,162 ,1%<br />
Crepidula fornic<strong>at</strong>a<br />
. . ,069 ,0% . . . . . . . .<br />
Hydrobia ulvae<br />
. . . . ,008 ,0% . . . . ,029 ,0%<br />
BIVALVIA Ensis ensis<br />
. . . . . . . . 240,718 67,1% . .<br />
Spisula solida<br />
231,883 77,4% 62,580 33,7% ,787 3,4% 15,413 7,3% 77,699 21,7% 97,245 89,3%<br />
Thracia phaseolina<br />
10,004 3,3% 7,203 3,9% 7,466 31,9% . . 9,458 2,6% 1,121 1,0%<br />
Goodallia triangularis<br />
,542 ,2% 1,504 ,8% 2,169 9,3% ,904 ,4% 1,794 ,5% 1,749 1,6%<br />
Fabulina fabula<br />
. . . . . . 1,022 ,5% . . . .<br />
Bivalvia indet,<br />
,001 ,0% . . . . . . ,438 ,1% . .<br />
Arctica isl<strong>and</strong>ica<br />
,055 ,0% . . . . . . . . . .<br />
Spisula elliptica<br />
. . ,030 ,0% . . . . . . . .<br />
Chamelea gallina<br />
. . . . ,012 ,1% . . . . . .<br />
Angulus tenuis<br />
. . ,009 ,0% . . . . . . . .<br />
Mytilus edulis<br />
,015 ,0% ,003 ,0% ,003 ,0% . . ,008 ,0% ,001 ,0%<br />
BRYOZOA Electra pilosa<br />
,049 ,0% . . ,524 2,2% . . . . . .<br />
Bryozoa indet,<br />
. . ,018 ,0% . . . . . . . .<br />
ECHINODERMATA Asterias rubens<br />
. . 10,974 5,9% ,453 1,9% . . . . . .<br />
Ophiura ophiura<br />
. . . . . . . . 3,169 ,9% . .<br />
Echinocardium cord<strong>at</strong>um<br />
. . . . ,195 ,8% . . . . . .<br />
Echinocyamus pusillus<br />
. . ,259 ,1% ,063 ,3% . . . . . .<br />
Ophiura albida<br />
. . . . ,001 ,0% . . . . . .<br />
CHAETOGHNATHA Sagitta sp.<br />
,000 ,0% . . . . . . . . . .<br />
CHORDATA Branchiostoma lanceol<strong>at</strong>um<br />
,080 ,0% ,712 ,4% ,063 ,3% ,348 ,2% ,078 ,0% . .<br />
2004<br />
Campaign<br />
Autumn<br />
Sampling area<br />
1999<br />
Campaign<br />
Spring<br />
Reference area<br />
2003<br />
Campaign<br />
Autumn<br />
2004<br />
Campaign<br />
Autumn<br />
Doc. No. 2572-03-005 rev. 4
<strong>Horns</strong> <strong>Rev</strong>. <strong>Benthic</strong> communities Page 101<br />
.<br />
8.3.4. Appendix 3.4. Infauna mean biomass WW 1999-2005 (Spring)<br />
CS Study area = Extended reference area<br />
Biomass - Spring: Year/Area<br />
1999<br />
2001<br />
2005<br />
Total<br />
Spring<br />
Reference<br />
Wind Turbine Area<br />
Wind Turbine Area<br />
Reference<br />
CS Study Area<br />
Wind Turbine Area<br />
Biomass, wet weight g/m² Mean Col Sum % Mean Col Sum % Mean Col Sum % Mean Col Sum % Mean Col Sum % Mean Col Sum % Mean Col Sum %<br />
Ensis americanus<br />
BIVALVIA<br />
. . . . . . 314.450 90.4% 525.247 97.6% . . 839.697 77.1%<br />
Pagurus bernhardus CRUSTACEA<br />
76.295 73.0% . . . . . . . . . . 76.295 7.0%<br />
Spisula solida<br />
BIVALVIA<br />
1.299 1.2% 2.231 17.7% 42.109 64.7% . . .007 .0% . . 45.647 4.2%<br />
Ophelia borealis<br />
POLYCHAETA<br />
15.006 14.4% .035 .3% 6.505 10.0% .409 .1% 4.985 .9% . . 26.941 2.5%<br />
Polinices polianus<br />
GASTROPODA<br />
. . . . 1.761 2.7% 15.752 4.5% .821 .2% . . 18.335 1.7%<br />
Travisia forbesii<br />
POLYCHAETA<br />
.791 .8% .028 .2% . . 7.110 2.0% .549 .1% 9.367 43.8% 17.846 1.6%<br />
Orbinia sertul<strong>at</strong>a<br />
POLYCHAETA<br />
4.794 4.6% 1.463 11.6% 2.788 4.3% . . . . 4.707 22.0% 13.753 1.3%<br />
Thracia phaseolina BIVALVIA<br />
. . . . 7.687 11.8% . . .635 .1% 4.108 19.2% 12.431 1.1%<br />
Nephtys longosetosa POLYCHAETA<br />
1.285 1.2% 4.303 34.2% 2.208 3.4% . . . . . . 7.796 .7%<br />
Scoloplos armiger<br />
POLYCHAETA<br />
. . . . . . 6.942 2.0% .224 .0% . . 7.166 .7%<br />
Goodallia triangularis BIVALVIA<br />
.204 .2% .698 5.5% .400 .6% 2.004 .6% .471 .1% 1.321 6.2% 5.098 .5%<br />
Haustorius arenarius CRUSTACEA<br />
2.995 2.9% .898 7.1% . . . . . . . . 3.893 .4%<br />
Crangon crangon<br />
CRUSTACEA<br />
. . . . . . . . 3.805 .7% . . 3.805 .3%<br />
Branchiostoma lanceol<strong>at</strong>um CHORDATA<br />
. . . . . . . . .807 .1% 1.089 5.1% 1.897 .2%<br />
Nephtys sp.<br />
POLYCHAETA<br />
. . . . .507 .8% .947 .3% .321 .1% . . 1.776 .2%<br />
Nephtys hombergii POLYCHAETA<br />
.346 .3% 1.273 10.1% . . . . . . . . 1.619 .1%<br />
Hydractinia echin<strong>at</strong>a HYDROZOA<br />
1.331 1.3% . . . . . . . . . . 1.331 .1%<br />
Angulus tenuis<br />
BIVALVIA<br />
. . 1.111 8.8% . . . . . . . . 1.111 .1%<br />
Spio filicornis<br />
POLYCHAETA<br />
.087 .1% .110 .9% .312 .5% .022 .0% . . .140 .7% .670 .1%<br />
Gastrosaccus spinifer CRUSTACEA<br />
. . . . .304 .5% .149 .0% .012 .0% . . .464 .0%<br />
Notomastus l<strong>at</strong>ericeus POLYCHAETA<br />
. . . . . . . . . . .438 2.0% .438 .0%<br />
Praunus flexuosus<br />
CRUSTACEA<br />
. . .361 2.9% . . . . . . . . .361 .0%<br />
Goniadella bobretzkii POLYCHAETA<br />
.071 .1% .052 .4% .075 .1% .037 .0% .040 .0% .077 .4% .353 .0%<br />
Pisione remota<br />
POLYCHAETA<br />
.008 .0% .017 .1% .025 .0% .066 .0% .146 .0% .054 .3% .317 .0%<br />
Nemertini indet.<br />
NEMERTINI<br />
.003 .0% . . .051 .1% .030 .0% .004 .0% .033 .2% .121 .0%<br />
B<strong>at</strong>hyporeia sp.<br />
CRUSTACEA<br />
. . . . .093 .1% . . . . . . .093 .0%<br />
Pontocr<strong>at</strong>es arenarius CRUSTACEA<br />
.025 .0% .004 .0% . . .024 .0% .007 .0% .020 .1% .081 .0%<br />
Pontocr<strong>at</strong>es altamarinus CRUSTACEA<br />
. . . . .064 .1% . . . . . . .064 .0%<br />
Glycera alba<br />
POLYCHAETA<br />
. . . . .019 .0% . . .033 .0% . . .052 .0%<br />
Aonides paucibranchi<strong>at</strong>a POLYCHAETA<br />
. . . . . . . . .048 .0% . . .048 .0%<br />
Polygordius appendicul<strong>at</strong>us POLYCHAETA<br />
. . . . . . .007 .0% .032 .0% .005 .0% .044 .0%<br />
Caprella sp.<br />
CRUSTACEA<br />
. . . . .043 .1% . . . . . . .043 .0%<br />
B<strong>at</strong>hyporeia guilliamsoniana CRUSTACEA<br />
. . . . .034 .1% . . . . . . .034 .0%<br />
Harpacticoida indet. CRUSTACEA<br />
. . .001 .0% .011 .0% . . .011 .0% . . .023 .0%<br />
Hydrobia ulvae<br />
GASTROPODA<br />
. . . . .021 .0% . . . . . . .021 .0%<br />
Dorvilleidae indet.<br />
POLYCHAETA<br />
. . . . . . . . .014 .0% . . .014 .0%<br />
Atylus sp.<br />
CRUSTACEA<br />
. . . . .012 .0% . . . . . . .012 .0%<br />
Electra pilosa<br />
BRYOZOA<br />
. . . . .012 .0% . . . . . . .012 .0%<br />
Copepoda indet.<br />
CRUSTACEA<br />
. . . . .001 .0% . . .006 .0% .005 .0% .012 .0%<br />
Nem<strong>at</strong>oda indet.<br />
NEMATODA<br />
.001 .0% .001 .0% .001 .0% . . .006 .0% . . .010 .0%<br />
Ascidiacea indet.<br />
ASCIDIACEA<br />
. . . . .009 .0% . . . . . . .009 .0%<br />
Mytilus edulis<br />
BIVALVIA<br />
. . . . .008 .0% . . . . . . .008 .0%<br />
Heteromastus filiformis POLYCHAETA<br />
. . . . .008 .0% . . . . . . .008 .0%<br />
Eurysteus nitida<br />
CRUSTACEA<br />
.007 .0% . . . . . . . . . . .007 .0%<br />
Megaluropus agilis CRUSTACEA<br />
. . . . .004 .0% . . . . . . .004 .0%<br />
Actiniaria indet.<br />
ANTHOZOA<br />
. . . . .004 .0% . . . . . . .004 .0%<br />
Ophiura albida<br />
ECHINODERMATA<br />
. . . . . . . . .003 .0% . . .003 .0%<br />
Oedicerotidae indet. CRUSTACEA<br />
.003 .0% . . . . . . . . . . .003 .0%<br />
Protodorvillea kefersteini POLYCHAETA<br />
. . .001 .0% . . . . .001 .0% . . .003 .0%<br />
Metopidae indet.<br />
CRUSTACEA<br />
.001 .0% . . . . . . . . . . .001 .0%<br />
Perioculodes longimanus CRUSTACEA<br />
. . . . .001 .0% . . . . . . .001 .0%<br />
Tanaidacea indet.<br />
CRUSTACEA<br />
. . .001 .0% . . . . . . . . .001 .0%<br />
Halacaridae indet,<br />
HYDROCARINA<br />
. . . . .001 .0% . . . . . . .001 .0%<br />
Pseudocuma longicornis CRUSTACEA<br />
. . . . . . . . .000 .0% . . .000 .0%<br />
Campanulariidae indet. HYDROZOA<br />
. . . . .000 .0% . . . . . . .000 .0%<br />
Cirr<strong>at</strong>ulidae indet.<br />
POLYCHAETA<br />
. . . . . . . . .000 .0% . . .000 .0%<br />
Empty sample<br />
.00<br />
. . . . . . . . .000 .0% . . .000 .0%<br />
Doc. No. 2572-03-005 rev. 4
<strong>Horns</strong> <strong>Rev</strong>. <strong>Benthic</strong> communities Page 102<br />
.<br />
8.3.5. Appendix 3.4. Infauna mean biomass DW 1999-2005 (Spring)<br />
CS Study area = Extended reference area<br />
Biomass - Spring: Year/Area<br />
1999<br />
2001<br />
2005<br />
Total<br />
Spring<br />
Reference<br />
Wind Turbine Area<br />
Wind Turbine Area<br />
Reference<br />
CS Study Area<br />
Wind Turbine Area<br />
Biomass, dry weight g/m² Mean Col Sum % Mean Col Sum % Mean Col Sum % Mean Col Sum % Mean Col Sum % Mean Col Sum % Mean Col Sum %<br />
Ensis americanus<br />
BIVALVIA<br />
. . . . . . 150.980 85.7% 407.850 99.1% . . 558.830 93.1%<br />
Polinices polianus<br />
GASTROPODA<br />
. . . . .000 . 14.686 8.3% .773 .2% . . 15.459 2.6%<br />
Travisia forbesii<br />
POLYCHAETA<br />
.000 . .000 .0% . . 4.141 2.4% .264 .1% 5.297 42.5% 9.702 1.6%<br />
Scoloplos armiger<br />
POLYCHAETA<br />
. . . . . . 4.308 2.4% .051 .0% . . 4.358 .7%<br />
Thracia phaseolina BIVALVIA<br />
. . . . .000 . . . .412 .1% 2.864 23.0% 3.276 .5%<br />
Goodallia triangularis BIVALVIA<br />
.000 . .000 .0% .000 . 1.576 .9% .353 .1% 1.056 8.5% 2.985 .5%<br />
Orbinia sertul<strong>at</strong>a<br />
POLYCHAETA<br />
.000 . .000 .0% .000 . . . . . 2.645 21.2% 2.645 .4%<br />
Ophelia borealis<br />
POLYCHAETA<br />
.000 . .000 .0% .000 . .145 .1% 1.029 .3% . . 1.174 .2%<br />
Crangon crangon<br />
CRUSTACEA<br />
. . . . . . . . .697 .2% . . .697 .1%<br />
Branchiostoma lanceol<strong>at</strong>um CHORDATA<br />
. . . . . . . . .183 .0% .312 2.5% .494 .1%<br />
Nephtys sp.<br />
POLYCHAETA<br />
. . . . .000 . .199 .1% .052 .0% . . .251 .0%<br />
Notomastus l<strong>at</strong>ericeus POLYCHAETA<br />
. . . . . . . . . . .215 1.7% .215 .0%<br />
Pisione remota<br />
POLYCHAETA<br />
.000 . .000 .0% .000 . .030 .0% .009 .0% .008 .1% .047 .0%<br />
Nephtys hombergii POLYCHAETA<br />
.000 . .035 100.0% . . . . . . . . .035 .0%<br />
Spio filicornis<br />
POLYCHAETA<br />
.000 . .000 .0% .000 . .004 .0% . . .031 .3% .035 .0%<br />
Goniadella bobretzkii POLYCHAETA<br />
.000 . .000 .0% .000 . .012 .0% .004 .0% .012 .1% .029 .0%<br />
Nemertini indet.<br />
NEMERTINI<br />
.000 . . . .000 . .008 .0% .001 .0% .016 .1% .025 .0%<br />
Gastrosaccus spinifer CRUSTACEA<br />
. . . . .000 . .019 .0% .001 .0% . . .020 .0%<br />
Aonides paucibranchi<strong>at</strong>a POLYCHAETA<br />
. . . . . . . . .008 .0% . . .008 .0%<br />
Spisula solida<br />
BIVALVIA<br />
.000 . .000 .0% .000 . . . .005 .0% . . .005 .0%<br />
Glycera alba<br />
POLYCHAETA<br />
. . . . .000 . . . .005 .0% . . .005 .0%<br />
Copepoda indet.<br />
CRUSTACEA<br />
. . . . .000 . . . .001 .0% .003 .0% .004 .0%<br />
Pontocr<strong>at</strong>es arenarius CRUSTACEA<br />
.000 . .000 .0% . . .000 .0% .000 .0% .003 .0% .003 .0%<br />
Polygordius appendicul<strong>at</strong>us POLYCHAETA<br />
. . . . . . .000 .0% .001 .0% .000 .0% .001 .0%<br />
Ophiura albida<br />
ECHINODERMATA<br />
. . . . . . . . .001 .0% . . .001 .0%<br />
Dorvilleidae indet.<br />
POLYCHAETA<br />
. . . . . . . . .001 .0% . . .001 .0%<br />
Cirr<strong>at</strong>ulidae indet.<br />
POLYCHAETA<br />
. . . . . . . . .000 .0% . . .000 .0%<br />
Empty sample<br />
.00<br />
. . . . . . . . .000 .0% . . .000 .0%<br />
Hydractinia echin<strong>at</strong>a HYDROZOA<br />
.000 . . . . . . . . . . . .000 .0%<br />
Campanulariidae indet. HYDROZOA<br />
. . . . .000 . . . . . . . .000 .0%<br />
Actiniaria indet.<br />
ANTHOZOA<br />
. . . . .000 . . . . . . . .000 .0%<br />
Nem<strong>at</strong>oda indet.<br />
NEMATODA<br />
.000 . .000 .0% .000 . . . .000 .0% . . .000 .0%<br />
Nephtys longosetosa POLYCHAETA<br />
.000 . .000 .0% .000 . . . . . . . .000 .0%<br />
Protodorvillea kefersteini POLYCHAETA<br />
. . .000 .0% . . . . .000 .0% . . .000 .0%<br />
Heteromastus filiformis POLYCHAETA<br />
. . . . .000 . . . . . . . .000 .0%<br />
Halacaridae indet,<br />
HYDROCARINA<br />
. . . . .000 . . . . . . . .000 .0%<br />
Harpacticoida indet. CRUSTACEA<br />
. . .000 .0% .000 . . . .000 .0% . . .000 .0%<br />
Pseudocuma longicornis CRUSTACEA<br />
. . . . . . . . .000 .0% . . .000 .0%<br />
Tanaidacea indet.<br />
CRUSTACEA<br />
. . .000 .0% . . . . . . . . .000 .0%<br />
Pagurus bernhardus CRUSTACEA<br />
.000 . . . . . . . . . . . .000 .0%<br />
Praunus flexuosus<br />
CRUSTACEA<br />
. . .000 .0% . . . . . . . . .000 .0%<br />
B<strong>at</strong>hyporeia guilliamsoniana CRUSTACEA<br />
. . . . .000 . . . . . . . .000 .0%<br />
B<strong>at</strong>hyporeia sp.<br />
CRUSTACEA<br />
. . . . .000 . . . . . . . .000 .0%<br />
Haustorius arenarius CRUSTACEA<br />
.000 . .000 .0% . . . . . . . . .000 .0%<br />
Eurysteus nitida<br />
CRUSTACEA<br />
.000 . . . . . . . . . . . .000 .0%<br />
Metopidae indet.<br />
CRUSTACEA<br />
.000 . . . . . . . . . . . .000 .0%<br />
Oedicerotidae indet. CRUSTACEA<br />
.000 . . . . . . . . . . . .000 .0%<br />
Perioculodes longimanus CRUSTACEA<br />
. . . . .000 . . . . . . . .000 .0%<br />
Pontocr<strong>at</strong>es altamarinus CRUSTACEA<br />
. . . . .000 . . . . . . . .000 .0%<br />
Megaluropus agilis CRUSTACEA<br />
. . . . .000 . . . . . . . .000 .0%<br />
Atylus sp.<br />
CRUSTACEA<br />
. . . . .000 . . . . . . . .000 .0%<br />
Caprella sp.<br />
CRUSTACEA<br />
. . . . .000 . . . . . . . .000 .0%<br />
Hydrobia ulvae<br />
GASTROPODA<br />
. . . . .000 . . . . . . . .000 .0%<br />
Mytilus edulis<br />
BIVALVIA<br />
. . . . .000 . . . . . . . .000 .0%<br />
Angulus tenuis<br />
BIVALVIA<br />
. . .000 .0% . . . . . . . . .000 .0%<br />
Electra pilosa<br />
BRYOZOA<br />
. . . . .000 . . . . . . . .000 .0%<br />
Ascidiacea indet.<br />
ASCIDIACEA<br />
. . . . .000 . . . . . . . .000 .0%<br />
Doc. No. 2572-03-005 rev. 4
Doc. No. 2572-03-005 rev. 4<br />
8.4. Appendix 4. Hard bottom substr<strong>at</strong>e<br />
8.4.1. Appendix 4.1. Rel<strong>at</strong>ive coverage. Monopiles<br />
Mean Rel<strong>at</strong>ive coverage<br />
Turbine tower<br />
Depth<br />
Red Callithamnion corymbosum<br />
Algae Hildenbr<strong>and</strong>ia rubra<br />
Brown<br />
Algae<br />
Polysiphonia fibrillosa<br />
Porphyra umbilicalis<br />
Ectocarpus sp.<br />
Petalonia fascia<br />
Petalonia zosterifolia<br />
Pilayella littoralis<br />
Ralfsia verrucosa<br />
Green Blidingia minima<br />
Algae Chaetomorpha linum<br />
Cladophora sp.<br />
Enteromorpha cl<strong>at</strong>hr<strong>at</strong>a<br />
Enteromorpha sp.<br />
Ulva lactuca<br />
Urospora penicilliformis<br />
Benthos Actiniaria indet.<br />
Aeolidia pappilosa<br />
Alcyonidium sp.<br />
Alcyonium digit<strong>at</strong>um<br />
Asterias rubens<br />
Balanus balanus<br />
Balanus cren<strong>at</strong>us<br />
Balanus sp.<br />
Bryozoa indet.<br />
Buccinum und<strong>at</strong>um<br />
Campanulariidae indet.<br />
Cancer pagurus<br />
Caprella linearis<br />
Carcinus maenas<br />
Crepidula fornic<strong>at</strong>a<br />
Electra pilosa<br />
Facelina bostoniensis<br />
Flabellina line<strong>at</strong>a<br />
Halichondria panicea<br />
Hydrozoa indet.<br />
Jassa marmor<strong>at</strong>a<br />
Liocarcinus depur<strong>at</strong>or<br />
Metridium senile<br />
Mytilus edulis<br />
Nemertini Indet.<br />
Nudibranchia indet.<br />
Onchidoris muric<strong>at</strong>a<br />
Ostrea edulis<br />
Phyllodocidae indet.<br />
Polycera quadriline<strong>at</strong>a<br />
Pom<strong>at</strong>oceros triqueter<br />
Sagartia elegans<br />
Sagartiogeton lacer<strong>at</strong>us<br />
Sertularia cupressina<br />
Strongylocentrotus droebachien<br />
Telm<strong>at</strong>ogeton japonicus<br />
Telm<strong>at</strong>ogeton sp.<br />
Tubularia indivisa<br />
Urticina feline<br />
2003<br />
Spring<br />
Autumn<br />
Depth interval<br />
Depth interval<br />
0 - 2 m 2 - 4 m 4 - 6 m 6 - 8 m 8 - 10 m 0 - 2 m 2 - 4 m 4 - 6 m 6 - 8 m 8 - 10 m<br />
2004<br />
Spring<br />
Autumn<br />
Depth interval<br />
Depth interval<br />
0 - 2 m 2 - 4 m 4 - 6 m 6 - 8 m 8 - 10 m 0 - 2 m 2 - 4 m 4 - 6 m 6 - 8 m 8 - 10 m<br />
Spring<br />
Depth interval<br />
0 - 2 m 2 - 4 m 4 - 6 m 6 - 8 m 8 - 10 m<br />
. . . . . .08 .08 . . . . . . . . . . . . . . . . .<br />
. . . . . . . . . . . . . . . .50 . . . . . . . .<br />
. . . . . . . . . . . . . . . . . . . . 4.58 1.25 . .<br />
. . . . . . . . . . . . . . . . . . . . .83 . . .<br />
. . . . . 1.13 . . . . 2.92 . . . . . . . . . . . . .<br />
3.79 . . . . .42 .00 . . . 3.00 . . . . 2.25 .08 .00 . . 5.58 6.75 .25 .<br />
. . . . . . . . . . .33 . . . . . . . . . . . . .<br />
16.46 9.08 6.58 . . . . . . . . . .08 . . . . . . . 15.83 3.92 .08 .<br />
. . . . . 1.13 . . . . . . . . . . . . . . . . . .<br />
. . . . . 2.25 . . . . . . . . . . . . . . . . . .<br />
. . . . . . . . . . . . . . . . . . . . .42 . . .<br />
. . . . . .08 . . . . . . . . . . . . . . . . . .<br />
. . . . . . . . . . . . . . . . . . . . .83 .08 . .<br />
3.00 .00 . . . 6.58 1.13 .08 . . 2.92 .00 .00 . . 14.46 3.71 4.50 .14 . 5.58 2.50 . .<br />
. . . . . 14.04 3.29 . . . .08 1.13 .08 . . .17 4.58 1.46 . . 1.00 .67 .17 .<br />
.08 . . . . . . . . . . . . . . . . . . . . . . .<br />
.17 .33 .50 3.75 10.38 3.29 7.17 11.42 10.90 13.50 .00 1.38 3.71 2.44 3.88 .25 .50 3.00 2.79 4.13 . . . .<br />
. . . . . . . . . . . .00 .00 . .00 . . . . . . .08 .08 .<br />
. . . . . . . . . . . .17 .08 .13 .75 . . . . . . . . .<br />
. . . . . . . . . . . . . . . . . . .00 . . . . .<br />
1.54 2.75 5.00 4.13 .75 1.63 8.29 15.50 8.50 10.38 .25 1.79 1.00 2.56 3.88 .33 .75 1.00 2.79 1.25 .25 4.00 5.58 6.00 10.<br />
. . . . . . . . . . 7.17 .50 . . . 4.83 . .08 . . 6.75 .92 .50 .29<br />
39.67 24.63 18.29 11.19 3.63 1.29 . . . . . . . . . . . . . . . . . .14<br />
. . . . . 5.79 . . . . . . . . . . . . . . . . . .<br />
. . . . . . 1.21 2.33 .20 .75 . . . . . 9.00 29.50 22.38 13.21 10.63 . . . .<br />
. . . . . . . . . . . . . .00 . . . . . . . . . .<br />
. . . . . . . . . . . . . . . . . . . . . . . .<br />
. . . . . .17 1.29 9.79 .30 .50 . . . . .00 .00 .00 .00 .00 .00 . . .08 .<br />
1.88 11.33 8.21 8.69 7.25 2.33 5.46 5.46 1.45 . 1.29 6.21 3.88 7.00 1.25 6.04 20.54 16.46 13.50 13.75 .92 4.67 3.50 4.14<br />
. . . . . . . . . . . . . . . . . .00 .00 . . . . .<br />
. . . .00 .00 .08 3.88 6.04 5.60 4.13 .08 .00 1.29 .13 .26 .25 .58 4.92 8.00 13.50 .92 3.33 5.67 5.71 7.<br />
. . . . . . . . . . . . . . . . . . . . . . . .<br />
. . . . . . . . . . . . . . . . . . . . . . . .14<br />
. . . . . . . . . . . . . . . .17 .42 .33 .14 .01 . . . .<br />
. . . . . . . . . . . . . . . . . . . . . . . .<br />
.08 .08 .17 .13 . . 1.13 1.13 .00 . .58 11.25 13.42 13.50 13.50 1.54 5.00 9.33 16.79 10.63 . 1.00 5.42 4.14 7.<br />
50.08 43.75 33.50 30.06 31.50 30.46 44.08 42.17 19.45 19.50 29.58 58.33 50.00 46.88 56.25 41.92 52.25 60.42 55.36 71.88 3.33 22.58 36.67 37.14 23.<br />
.00 . . . . . . .00 . .25 . . . . . . . . . . . . . .<br />
. . . . . .08 4.83 13.42 10.90 13.50 .25 1.79 1.79 .88 .75 .25 .58 1.71 2.79 1.25 .42 1.25 2.58 2.57 4.<br />
.17 .17 .17 .13 . 19.17 6.25 .08 . 3.38 21.33 6.42 .00 .25 . 12.67 6.33 . . . 22.92 15.42 .50 .<br />
. . . . . . .08 . .00 . .08 . . . . . . . . . . . . .<br />
. . .00 .00 . . . . . . . .00 . . . . .00 . . . . . . .<br />
. . . . . . . . . . . .00 .08 .00 . . . . . . .92 2.58 1.42 .86<br />
. . . . . . . . . . . . .00 .13 .26 . . . . . . . . .<br />
. . .00 .13 . . . . . . . . . . . . . . . . . . . .<br />
. . . . . . . . . . . . . . . .17 1.71 .50 .43 .25 . . .08 .<br />
. . . .50 .75 . .17 .33 1.75 1.00 . .17 .34 .50 .50 . . .17 .14 .50 . . .08 .86<br />
. . . . . . . . . . . . . . . . . . . . . .17 .67 .86<br />
. . . . . . . . . . . . . . . . . . . . .42 1.75 4.00 4.57 5.<br />
. . . . . . . . . . . . . . . . . . . . . . . .<br />
. .00 .17 .13 . . . . . . . . . . . . . . . . . . . .<br />
. . . . . . . . . . .92 . . . . .75 . .08 . . . . . .<br />
. . . . . .17 . . . . . . . . . . . . . . . . . .<br />
. . . . . 5.88 19.42 18.46 17.05 19.50 . .00 .08 .13 . 11.00 11.17 10.29 13.21 16.88 . 2.17 3.58 3.00 3.<br />
. . . . . . . . . . . . . . . . . . . . . . . .<br />
<strong>Horns</strong> <strong>Rev</strong>. <strong>Benthic</strong> communities Page 103<br />
.
Doc. No. 2572-03-005 rev. 4<br />
Appendix 4.2. Rel<strong>at</strong>ive coverage. Scour protections<br />
2003<br />
Mean Rel<strong>at</strong>ive coverage<br />
Scour protection<br />
Distance from tower<br />
Red Algae Callithamnion corymbosum<br />
Brown Pilayella littoralis<br />
Algae Ralfsia sp.<br />
Fish<br />
Benthos<br />
Agonus c<strong>at</strong>aphractus<br />
Pholis gunellus<br />
Actiniaria indet.<br />
Aeolidacea indet.<br />
Asterias rubens<br />
Balanus cren<strong>at</strong>us<br />
Buccinum und<strong>at</strong>um<br />
Buccinum und<strong>at</strong>um (æg)<br />
Cancer pagurus<br />
Caprella linearis<br />
Carcinus maenas<br />
Crepidula fornic<strong>at</strong>a<br />
Echinocardium cord<strong>at</strong>um<br />
Electra pilosa<br />
Gastropoda indet.<br />
Hydrozoa indet.<br />
Jassa marmor<strong>at</strong>a<br />
Lanice conchilega<br />
Nudibranchia indet.<br />
Nudibranchia indet. (æg).<br />
Onchidoris muric<strong>at</strong>a<br />
Onchidoris muric<strong>at</strong>a (æg)<br />
Pagurus bernhardus<br />
Phyllodocidae indet.<br />
Pom<strong>at</strong>oceros triqueter<br />
Strongylocentrotus droebachien<br />
0 - 2 m 2 - 4 m 4 - 6 m 6 - 8 m<br />
2003<br />
Spring<br />
Distance interval<br />
8 - 10 m 10 - 12 m 12 - 14 m 14 -16 m 16 - 18 m<br />
. . . .00 . . . . .<br />
1.29 1.29 4.33 1.29 .25 .08 .00 . .<br />
1.13 1.13 3.13 1.13 . . . . .<br />
. . . . .00 . . . .<br />
. . . . . .08 .09 . .<br />
9.08 8.21 9.25 7.08 4.83 .25 .09 .00 .<br />
. . . .00 . . . . .<br />
7.25 5.00 6.04 8.29 8.13 10.13 8.95 5.17 37.50<br />
10.75 7.71 7.71 6.67 4.50 .08 .09 . .<br />
.00 .00 .00 .00 . . .09 . .<br />
. . . . .00 . . . .<br />
.00 . . .08 . . .00 . .<br />
1.13 .00 . . . . . . .<br />
. . . . .08 . .09 . .<br />
.08 .08 .08 .00 . . . . .<br />
. . . . . . .00 . .<br />
. . . . . .08 .09 . .<br />
. . . . .00 . . . .<br />
.17 1.29 1.29 .25 .17 5.21 1.23 . .<br />
23.50 28.63 25.50 23.42 11.08 .08 .09 . .<br />
.00 . . . . 3.21 1.32 . .<br />
.00 .00 .00 .00 .08 . . . .<br />
.00 .08 .00 .00 .00 . . . .<br />
. . .00 .00 .00 . . . .<br />
.00 .08 .08 .08 .08 .00 . . .<br />
.00 . . .00 .17 .59 .27 . .<br />
.00 .17 .08 .08 .17 1.21 1.32 4.50 .<br />
.33 .42 .50 .42 .25 .08 . . .<br />
. . . . . .00 . . .<br />
Mean Rel<strong>at</strong>ive coverage<br />
Scour protection<br />
Distance from tower<br />
Red Coccotylus trunc<strong>at</strong>us<br />
Algae Corallina officinalis<br />
Rødkødskorp, tyk<br />
Rødskorper, kødede<br />
Brown Desmarestia acule<strong>at</strong>a<br />
Algae Petalonia fascia<br />
Green Enteromorpha sp.<br />
Algae Ulva lactuca<br />
Benthos Actiniaria indet.<br />
Asterias rubens<br />
Balanus cren<strong>at</strong>us<br />
Balanus sp.<br />
Bryozoa indet.<br />
Cancer pagurus<br />
Caprella linearis<br />
Carcinus maenas<br />
Crepidula fornic<strong>at</strong>a<br />
Hydrozoa indet.<br />
Jassa marmor<strong>at</strong>a<br />
Lanice conchilega<br />
Liocarcinus depur<strong>at</strong>or<br />
Metridium senile<br />
Mytilus edulis<br />
Nudibranchia indet.<br />
Pagurus bernhardus<br />
Pom<strong>at</strong>oceros triqueter<br />
Tubularia indivisa<br />
2003<br />
Autumn<br />
Distance interval<br />
0 - 2 m 2 - 4 m 4 - 6 m 6 - 8 m 8 - 10 m 10 - 12 m 12 - 14 m 14 -16 m<br />
. . .08 .00 . . . .<br />
. . . . . .08 . .<br />
. . 1.13 1.13 1.13 1.13 1.23 .<br />
1.13 1.13 1.13 1.13 . .08 .18 .<br />
. . . . .00 . . .<br />
. .17 .08 . . . . .<br />
1.13 2.33 3.54 3.54 5.38 3.54 2.73 .<br />
.00 1.38 1.46 1.29 1.13 .17 .09 .<br />
16.46 20.54 18.54 16.46 11.25 9.17 8.77 7.25<br />
14.46 11.42 12.46 12.46 11.42 12.46 6.59 6.75<br />
. . . .08 .17 .08 .18 .<br />
.08 .08 . . . .17 .09 .<br />
.33 1.46 .25 1.38 .42 3.63 3.95 .<br />
7.25 5.17 5.17 6.21 9.33 10.38 4.05 .50<br />
3.38 3.46 3.46 3.46 3.38 2.25 2.45 .<br />
. . . .08 .08 .08 .27 .00<br />
.42 1.29 1.38 1.21 .08 .08 .09 .<br />
2.42 3.71 3.63 5.96 5.96 7.08 6.68 .50<br />
37.83 51.21 47.13 46.25 35.04 24.63 14.09 6.75<br />
. . . . 1.21 2.58 8.77 6.75<br />
. 1.21 .00 .08 .25 .25 .36 .50<br />
7.17 4.13 6.21 6.04 2.75 1.54 .36 .50<br />
2.33 .00 . . . . . .<br />
.08 .08 .08 .08 .08 .08 .09 .<br />
. . . .00 .08 .17 1.68 6.75<br />
.50 .50 .50 .50 .42 .42 .27 .<br />
11.42 16.38 6.21 10.13 9.00 4.83 1.41 .50<br />
<strong>Horns</strong> <strong>Rev</strong>. <strong>Benthic</strong> communities Page 104<br />
.
Doc. No. 2572-03-005 rev. 4<br />
2004<br />
Mean Rel<strong>at</strong>ive coverage<br />
Scour protection<br />
Distance from tower<br />
Red Algae Callithamnion corymbosum<br />
Brown<br />
Algae<br />
Green<br />
Algae<br />
Benthos<br />
Hildenbr<strong>and</strong>ia rubra<br />
Ectocarpus sp.<br />
Pilayella littoralis<br />
Enteromorpha sp.<br />
Ulva lactuca<br />
Actiniaria indet.<br />
Aeolidia pappilosa<br />
Alcyonidium sp.<br />
Alcyonium digit<strong>at</strong>um<br />
Asterias rubens<br />
Balanus cren<strong>at</strong>us<br />
Buccinum und<strong>at</strong>um<br />
Buccinum und<strong>at</strong>um (æg)<br />
Cancer pagurus<br />
Caprella linearis<br />
Carcinus maenas<br />
Crangon crangon<br />
Crepidula fornic<strong>at</strong>a<br />
Flustra foliacea<br />
Halichondria panicea<br />
Hydrozoa indet.<br />
Jassa marmor<strong>at</strong>a<br />
Lanice conchilega<br />
Liocarcinus depur<strong>at</strong>or<br />
Macropodia rostr<strong>at</strong>a<br />
Metridium senile<br />
Mytilus edulis<br />
Nudibranchia indet. (æg).<br />
Onchidoris muric<strong>at</strong>a<br />
Pagurus bernhardus<br />
Phyllodocidae indet.<br />
Phyllodocidae indet. (æg)<br />
Polycera quadriline<strong>at</strong>a<br />
Pom<strong>at</strong>oceros triqueter<br />
Spisula solida<br />
Tubularia indivisa<br />
0 - 2 m 2 - 4 m 4 - 6 m<br />
2004<br />
Spring<br />
Distance interval<br />
6 - 8 m 8 - 10 m 10 - 12 m 12 - 14 m<br />
.08 .17 .17 .17 .08 .08 .<br />
.17 .17 .08 . . . .<br />
. .08 . . . . .<br />
. .08 . . . . .08<br />
.17 .08 .08 .17 .17 . .<br />
. . . .00 . . .<br />
8.29 11.33 10.38 9.25 11.25 6.84 2.67<br />
. . . . . .00 .<br />
1.46 .25 .17 .17 .08 .17 .<br />
.09 .25 .33 .33 .25 .17 .00<br />
8.29 9.33 6.13 9.33 7.25 6.21 8.29<br />
.00 . . .00 . . .00<br />
. . . . .00 .00 .00<br />
. . . . . . .00<br />
.00 .00 .00 .00 .00 .00 .00<br />
. . . .08 .08 . .<br />
. . . . . .00 .00<br />
. . . . .00 . .<br />
.09 .08 . .08 .08 .00 .<br />
. . . . .00 . .<br />
. .00 .08 . .00 . .<br />
13.50 12.46 10.38 13.50 12.46 15.08 7.96<br />
26.46 33.58 35.67 41.83 35.75 10.58 2.42<br />
. . . . . .08 .25<br />
. . . . . .00 .00<br />
. . .00 . .00 . .00<br />
2.83 1.88 1.88 1.88 1.71 1.29 1.21<br />
.34 .08 .08 .00 . .00 .00<br />
. . . . . .00 .<br />
.00 .00 .00 .00 . .00 .<br />
. . . . . .00 .00<br />
. . . . .00 .00 .08<br />
. . .08 .08 .08 .08 .08<br />
. .00 .00 . . .00 .<br />
2.92 .84 .84 .75 .67 .50 .42<br />
. . . . . .08 .08<br />
. .00 .17 .08 . . .<br />
Mean Rel<strong>at</strong>ive coverage<br />
Scour protection<br />
Distance from tower<br />
Red Algae Callithamnion corymbosum<br />
Brown Ectocarpus sp.<br />
Algae Pilayella littoralis<br />
Green<br />
Algae<br />
Benthos<br />
Enteromorpha sp.<br />
Ulva lactuca<br />
Actiniaria indet.<br />
Alcyonium digit<strong>at</strong>um<br />
Asterias rubens<br />
Balanus cren<strong>at</strong>us<br />
Bryozoa indet.<br />
Buccinum und<strong>at</strong>um<br />
Cancer pagurus<br />
Caprella linearis<br />
Carcinus maenas<br />
Crepidula fornic<strong>at</strong>a<br />
Flabellina line<strong>at</strong>a<br />
Hydrozoa indet.<br />
Jassa marmor<strong>at</strong>a<br />
Lanice conchilega<br />
Liocarcinus depur<strong>at</strong>or<br />
Metridium senile<br />
Mytilus edulis<br />
Pagurus bernhardus<br />
Polycera quadriline<strong>at</strong>a<br />
Polyplacophora indet.<br />
Pom<strong>at</strong>oceros triqueter<br />
Tubularia indivisa<br />
0 - 2 m 2 - 4 m 4 - 6 m<br />
2004<br />
Autumn<br />
Distance interval<br />
6 - 8 m 8 - 10 m 10 - 12 m 12 - 14 m<br />
.08 .08 .08 .08 .08 .08 .<br />
. . . . . . .09<br />
. . . . . . .00<br />
6.58 15.88 21.17 20.13 14.83 7.71 9.45<br />
. . .08 . . . .<br />
10.38 14.38 13.42 18.46 19.50 11.25 9.82<br />
.33 .33 .33 1.29 2.33 .17 .<br />
7.25 7.25 6.21 7.25 7.25 6.21 5.55<br />
1.13 . . . . . .<br />
1.46 2.50 4.58 2.42 1.38 .17 .27<br />
. . . . . .00 .<br />
.08 .17 .00 .09 .00 .00 .09<br />
1.29 2.42 1.29 .25 1.29 .17 .<br />
. . . . . . .09<br />
.08 .00 .00 .08 . . .09<br />
.00 .00 .00 . .00 . .<br />
19.50 8.21 6.21 4.13 6.21 8.29 15.59<br />
58.33 62.50 62.50 60.42 56.33 35.58 19.59<br />
. . . . . .25 2.91<br />
. . . . . . .00<br />
3.88 .75 1.63 2.92 5.00 2.75 2.64<br />
.00 . . . . . .<br />
. . . . . .00 .18<br />
. .00 .00 .00 .00 .00 .09<br />
.00 . . . . . .<br />
.58 .50 .50 .50 .50 1.46 .36<br />
4.83 2.83 2.83 1.63 1.54 1.29 .00<br />
<strong>Horns</strong> <strong>Rev</strong>. <strong>Benthic</strong> communities Page 105<br />
.
Doc. No. 2572-03-005 rev. 4<br />
2005<br />
Mean Rel<strong>at</strong>ive coverage<br />
Scour protection<br />
Distance from tower<br />
Red Algae Polysiphonia fibrillosa<br />
Green Chaetomorpha linum<br />
Algae Ulva lactuca<br />
Benthos<br />
Aeolidia pappilosa<br />
Alcyonium digit<strong>at</strong>um<br />
Asterias rubens<br />
Balanus cren<strong>at</strong>us<br />
Buccinum und<strong>at</strong>um<br />
Cancer pagurus<br />
Caprella linearis<br />
Crepidula fornic<strong>at</strong>a<br />
Facelina bostoniensis<br />
Hydrozoa indet.<br />
Jassa marmor<strong>at</strong>a<br />
Lanice conchilega<br />
Metridium senile<br />
Mytilus edulis<br />
Onchidoris muric<strong>at</strong>a<br />
Pagurus bernhardus<br />
Polycera quadriline<strong>at</strong>a<br />
Pom<strong>at</strong>oceros triqueter<br />
Sagartia elegans<br />
Sagartiogeton lacer<strong>at</strong>us<br />
Sertularia cupressina<br />
Tubularia indivisa<br />
Urticina feline<br />
0 - 2 m 2 - 4 m 4 - 6 m<br />
2005<br />
Spring<br />
Distance interval<br />
6 - 8 m 8 - 10 m 10 - 12 m 12 - 14 m<br />
1.42 3.83 6.08 5.92 2.67 1.33 .17<br />
. . .17 .08 . . .<br />
.08 .17 .33 .33 . . .<br />
. . . . . .08 .<br />
1.67 2.17 .83 2.08 1.33 1.50 .67<br />
14.17 13.75 12.92 14.17 15.83 15.58 9.58<br />
. . .08 .08 .08 .17 .<br />
. . . . .17 .08 .08<br />
.67 .75 1.25 .83 .50 .33 .42<br />
.17 .25 .25 .17 .17 . .<br />
.25 .17 .58 .33 .25 .33 .08<br />
.08 .25 .08 . . . .<br />
9.83 4.50 5.67 4.83 5.92 2.42 1.17<br />
52.50 60.83 64.58 60.42 51.25 32.50 11.33<br />
. . . . . .42 .<br />
5.08 3.67 3.50 3.33 4.67 4.42 2.67<br />
.17 .17 . .08 .08 . .<br />
.17 .08 .42 .42 . .17 .<br />
.08 . . .17 .25 .58 .50<br />
.08 . . . . .08 .<br />
2.08 1.25 1.25 1.25 1.92 1.17 .58<br />
1.67 2.08 2.42 3.08 2.17 1.17 .58<br />
8.08 9.17 9.67 10.00 7.50 6.83 4.17<br />
.17 .42 .08 .33 .67 .17 .08<br />
5.25 3.25 3.00 3.42 2.75 1.00 .83<br />
. . . . . .08 .08<br />
Mean Rel<strong>at</strong>ive coverage<br />
Scour protection<br />
Distance from tower<br />
Red Algae Coccotylus trunc<strong>at</strong>us<br />
Polysiphonia fibrillosa<br />
Brown Algae Desmarestia acule<strong>at</strong>a<br />
Green Algae Chaetomorpha linum<br />
Enteromorpha sp.<br />
Ulva lactuca<br />
Benthos Actiniaria indet.<br />
Aeolidia pappilosa<br />
Alcyonidium sp.<br />
Alcyonium digit<strong>at</strong>um<br />
Asterias rubens<br />
Balanus cren<strong>at</strong>us<br />
Buccinum und<strong>at</strong>um<br />
Campanulariidae indet.<br />
Cancer pagurus<br />
Caprella linearis<br />
Carcinus maenas<br />
Crepidula fornic<strong>at</strong>a<br />
Electra pilosa<br />
Ensis americanus<br />
Facelina bostoniensis<br />
Jassa marmor<strong>at</strong>a<br />
Lanice conchilega<br />
Liocarcinus depur<strong>at</strong>or<br />
Metridium senile<br />
Mytilus edulis<br />
Onchidoris muric<strong>at</strong>a<br />
Pagurus bernhardus<br />
Pom<strong>at</strong>oceros triqueter<br />
Sagartia elegans<br />
Sagartiogeton lacer<strong>at</strong>us<br />
Sertularia cupressina<br />
Tubularia indivisa<br />
0 - 2 m 2 - 4 m 4 - 6 m<br />
2005<br />
Autumn<br />
Distance interval<br />
6 - 8 m 8 - 10 m 10 - 12 m 12 - 14 m<br />
. . . . .08 . .<br />
.08 . .83 .83 .25 . .<br />
. . . . .17 .17 .33<br />
. .25 .17 .50 .50 .08 .<br />
1.08 2.25 2.75 2.17 2.75 1.83 .75<br />
1.25 3.50 6.08 5.00 2.58 .92 .17<br />
. . . . .17 .42 .<br />
. . .08 . .08 .08 .<br />
. . .08 .17 . . .<br />
3.33 4.33 6.50 8.17 6.42 2.17 2.67<br />
16.67 10.00 8.75 11.25 11.83 15.42 8.08<br />
. . .08 .08 .25 .08 .08<br />
.17 . . . . . .<br />
26.25 21.25 13.33 10.00 6.08 4.58 1.83<br />
4.67 4.08 3.17 5.17 5.42 3.42 2.92<br />
2.25 2.25 2.92 1.75 2.17 1.83 .58<br />
. . . . .33 .17 .25<br />
.92 .83 1.42 1.00 .67 .25 .<br />
3.08 2.33 1.83 2.92 1.92 3.42 2.25<br />
. . . . .17 . 1.67<br />
2.83 2.00 3.08 2.08 1.08 2.00 1.58<br />
51.67 60.42 63.75 68.33 62.08 49.17 30.42<br />
. . . .42 3.00 3.33 4.33<br />
.17 . . .08 .75 .50 .58<br />
22.50 20.00 17.17 16.75 16.08 13.33 6.00<br />
.58 .08 .08 . . . .08<br />
. . . . .08 . .<br />
. . . .08 .17 .25 .50<br />
.67 .83 .58 .58 .58 .75 .58<br />
.83 1.25 1.33 1.67 1.08 1.00 1.00<br />
5.92 10.83 11.75 11.92 13.25 10.50 10.83<br />
.50 .83 2.00 1.92 2.42 2.75 2.08<br />
11.83 11.17 13.00 12.50 8.25 6.42 10.83<br />
<strong>Horns</strong> <strong>Rev</strong>. <strong>Benthic</strong> communities Page 106<br />
.
Doc. No. 2572-03-005 rev. 4<br />
8.4.2. Appendix 4.3. Mean abundance. Monopiles 2003-2005<br />
2003-Spring<br />
HYDROZOA Tubulariidae indet.<br />
Campanulariidae indet.<br />
ANTHOZOA Anthozoa indet.<br />
Actiniaria indet.<br />
NEMERTINI Nemertini indet.<br />
POLYCHAETA Harmothoe impar<br />
Phyllodoce groenl<strong>and</strong>ica<br />
Eulalia viridis<br />
Capitella capit<strong>at</strong>a<br />
Pom<strong>at</strong>oceros triqueter<br />
CRUSTACEA Verruca stroemia<br />
Balanus balanus<br />
Balanus cren<strong>at</strong>us<br />
Cancer pagurus<br />
Aoridae indet.<br />
Jassa marmor<strong>at</strong>a<br />
Caprella linearis<br />
GASTROPODA Rissoidae indet.<br />
Crepidula fornic<strong>at</strong>a<br />
Nudibranchia indet.<br />
Onchidoris muric<strong>at</strong>a<br />
BIVALVIA Mytilus edulis<br />
BRYOZOA Bryozoa indet.<br />
Electra pilosa<br />
ECHINODERMATA Asterias rubens<br />
Strongylocentrotus<br />
droebachiensis<br />
Total<br />
NNE 02<br />
no./m² Kol Sum %<br />
NNE 04<br />
no./m² Kol Sum %<br />
NNE 06<br />
no./m² Kol Sum %<br />
NNE 08<br />
no./m² Kol Sum %<br />
NNE Bottom<br />
no./m² Kol Sum %<br />
Transect<br />
Turbine tower, vertical<br />
SSW 02<br />
no./m² Kol Sum %<br />
SSW 04<br />
no./m² Kol Sum %<br />
SSW 06<br />
no./m² Kol Sum %<br />
SSW 08<br />
no./m² Kol Sum %<br />
SSW Bottom<br />
no./m² Kol Sum %<br />
. . . . . . . . . . 4.2 .0% . . . . . . . .<br />
. . . . . . . . . . 4.2 .0% . . . . . . 4.2 .0%<br />
. . 12.5 .0% . . . . . . . . . . . . . . 12.5 .0%<br />
. . . . . . . . 41.7 .0% 8.3 .0% 4.2 .0% . . . . 4.2 .0%<br />
58.3 .1% 25.0 .0% 29.2 .0% 6.3 .0% . . 33.3 .0% 45.8 .0% 100.0 .1% . . 8.3 .0%<br />
29.2 .0% 41.7 .0% 12.5 .0% . . 33.3 .0% 16.7 .0% 37.5 .0% 8.3 .0% . . 20.8 .0%<br />
25.0 .0% 16.7 .0% 8.3 .0% . . 8.3 .0% 20.8 .0% 20.8 .0% . . . . 8.3 .0%<br />
4.2 .0% 8.3 .0% . . . . . . . . . . . . . . 12.5 .0%<br />
8.3 .0% 20.8 .0% 8.3 .0% . . . . . . 4.2 .0% 4.2 .0% . . . .<br />
8.3 .0% . . 8.3 .0% . . 20.8 .0% 16.7 .0% 16.7 .0% . . . . 20.8 .0%<br />
4.2 .0% . . 4.2 .0% . . 12.5 .0% 8.3 .0% . . 4.2 .0% . . 16.7 .0%<br />
. . . . 854.2 .5% 2400.0 4.8% . . . . . . 612.5 .6% 2550.0 3.3% . .<br />
4554.2 5.5% 13558.3 10.0% 18162.5 11.3% . . 404.2 .3% 2062.5 1.4% 5362.5 3.5% 9683.3 9.3% . . 904.2 1.1%<br />
20.8 .0% 4.2 .0% 4.2 .0% 12.5 .0% . . 16.7 .0% 4.2 .0% 12.5 .0% . . . .<br />
. . . . . . . . . . . . . . 4.2 .0% . . . .<br />
71487.5 86.0% 111400.0 82.5% 128737.5 80.4% 45218.8 89.9% 111533.3 93.7% 134025.0 93.8% 133079.2 86.7% 87537.5 83.7% 46137.5 60.3% 72283.3 84.6%<br />
1945.8 2.3% 2441.7 1.8% 1854.2 1.2% 1068.8 2.1% 1975.0 1.7% 1079.2 .8% 1208.3 .8% 750.0 .7% 100.0 .1% 375.0 .4%<br />
8.3 .0% . . . . . . . . . . . . . . . . 4.2 .0%<br />
12.5 .0% 8.3 .0% . . . . 29.2 .0% 16.7 .0% 20.8 .0% . . . . . .<br />
. . 4.2 .0% . . . . 4.2 .0% . . 8.3 .0% . . . . 4.2 .0%<br />
. . . . . . . . . . . . . . . . . . 4.2 .0%<br />
4900.0 5.9% 7383.3 5.5% 10370.8 6.5% 1568.8 3.1% 4937.5 4.1% 5600.0 3.9% 13591.7 8.9% 5895.8 5.6% 27787.5 36.3% 11675.0 13.7%<br />
. . . . . . . . 4.2 .0% . . . . . . . . . .<br />
25.0 .0% 20.8 .0% 25.0 .0% 25.0 .0% 25.0 .0% 25.0 .0% 25.0 .0% 20.8 .0% . . 25.0 .0%<br />
. . 8.3 .0% 8.3 .0% 25.0 .0% 33.3 .0% 20.8 .0% . . . . . . 37.5 .0%<br />
. . . . . . . . . . . . 4.2 .0% . . . . . .<br />
83091.7 100.0% 134954.2 100.0% 160087.5 100.0% 50325.0 100.0% 119062.5 100.0% 142958.3 100.0% 153433.3 100.0% 104633.3 100.0% 76575.0 100.0% 85420.8 100.0%<br />
<strong>Horns</strong> <strong>Rev</strong>. <strong>Benthic</strong> communities Page 107<br />
.
Doc. No. 2572-03-005 rev. 4<br />
2003-Autumn<br />
HYDROZOA Tubularia indivisa<br />
Campanulariidae indet.<br />
ANTHOZOA Actiniaria indet.<br />
NEMERTINI Nemertini indet.<br />
NEMATODA Nem<strong>at</strong>oda indet.<br />
POLYCHAETA Harmothoe imbric<strong>at</strong>a<br />
Harmothoe impar<br />
Phyllodoce groenl<strong>and</strong>ica<br />
Eulalia viridis<br />
Nereididae indet.<br />
Nereis pelagica<br />
Neanthes virens<br />
Capitella capit<strong>at</strong>a<br />
Pom<strong>at</strong>oceros triqueter<br />
PYCNOGONIDA Phoxichilidium femor<strong>at</strong>um<br />
CRUSTACEA Verruca stroemia<br />
Balanus balanus<br />
Balanus cren<strong>at</strong>us<br />
Caridea indet.<br />
Corystes cassivelaunus<br />
Cancer pagurus<br />
Corophium crassicorne<br />
Jassa marmor<strong>at</strong>a<br />
Caprella linearis<br />
CHIRONOMIDAE Telm<strong>at</strong>ogeton japonicus<br />
GASTROPODA Rissoidae indet.<br />
Crepidula fornic<strong>at</strong>a<br />
Nudibranchia indet.<br />
Onchidoris muric<strong>at</strong>a<br />
BIVALVIA Mytilus edulis<br />
Ostrea edulis<br />
Heteranomia squamula<br />
Moerella pygmaea<br />
Venerupis senegalensis<br />
Hi<strong>at</strong>ella arctica<br />
BRYOZOA Bryozoa indet.<br />
Electra pilosa<br />
ECHINODERMATA Asterias rubens<br />
Strongylocentrotus<br />
droebachiensis<br />
Total<br />
NNE 02<br />
no./m² Kol Sum %<br />
NNE 04<br />
no./m² Kol Sum %<br />
NNE 06<br />
no./m² Kol Sum %<br />
NNE 08<br />
no./m² Kol Sum %<br />
NNE Bottom<br />
no./m² Kol Sum %<br />
Transect<br />
Turbine tower, vertical<br />
SSW 02<br />
no./m² Kol Sum %<br />
SSW 04<br />
no./m² Kol Sum %<br />
SSW 06<br />
no./m² Kol Sum %<br />
SSW 08<br />
no./m² Kol Sum %<br />
SSW Bottom<br />
no./m² Kol Sum %<br />
25.0 .0% 25.0 .0% 25.0 .0% . . 25.0 .0% 25.0 .0% 25.0 .0% 25.0 .0% 12.5 .0% 25.0 .0%<br />
16.7 .0% 20.8 .0% 8.3 .0% . . 20.8 .0% 16.7 .0% 20.8 .0% 8.3 .0% 8.3 .0% 16.7 .0%<br />
79.2 .0% 58.3 .0% 120.8 .0% . . 4.2 .0% 70.8 .0% 66.7 .0% 33.3 .0% 4.2 .0% 16.7 .0%<br />
4.2 .0% . . 79.2 .0% 129.2 .0% 4.2 .0% 8.3 .0% 8.3 .0% 41.7 .0% 62.5 .0% 8.3 .0%<br />
. . 4.2 .0% . . . . . . 12.5 .0% . . 4.2 .0% . . . .<br />
. . . . 12.5 .0% . . . . . . . . 25.0 .0% . . . .<br />
. . . . 20.8 .0% . . . . . . . . 25.0 .0% 12.5 .0% . .<br />
. . 20.8 .0% 62.5 .0% 4.2 .0% 4.2 .0% 8.3 .0% 25.0 .0% 37.5 .0% 58.3 .0% 16.7 .0%<br />
16.7 .0% . . . . . . 4.2 .0% 12.5 .0% 4.2 .0% 33.3 .0% 4.2 .0% 8.3 .0%<br />
. . . . 4.2 .0% 12.5 .0% . . . . . . 20.8 .0% . . . .<br />
. . . . . . . . . . . . 4.2 .0% . . 12.5 .0% . .<br />
. . . . 29.2 .0% 16.7 .0% . . . . . . 4.2 .0% 16.7 .0% . .<br />
. . . . 8.3 .0% . . . . . . 4.2 .0% . . . . 4.2 .0%<br />
137.5 .1% 66.7 .0% 20.8 .0% . . 104.2 .0% 75.0 .0% 170.8 .1% 104.2 .0% 12.5 .0% 166.7 .2%<br />
. . . . . . . . . . . . 4.2 .0% . . . . . .<br />
. . . . 4.2 .0% . . . . 4.2 .0% 8.3 .0% . . . . 12.5 .0%<br />
. . . . 25.0 .0% 1650.0 .6% . . . . . . 8.3 .0% 487.5 .2% . .<br />
29.2 .0% 33.3 .0% . . . . 4.2 .0% 66.7 .0% 45.8 .0% 29.2 .0% . . 20.8 .0%<br />
. . . . . . . . 4.2 .0% . . . . . . . . . .<br />
. . . . . . . . . . . . . . . . . . 4.2 .0%<br />
991.7 .6% 29.2 .0% 125.0 .0% 54.2 .0% 12.5 .0% 25.0 .0% 33.3 .0% 137.5 .0% 37.5 .0% 12.5 .0%<br />
. . . . 4.2 .0% . . . . . . . . . . . . . .<br />
153554.2 90.3% 153620.8 93.3% 329191.7 86.8% 251100.0 96.0% 183141.7 86.7% 170766.7 93.9% 150637.5 91.6% 377758.3 87.2% 216533.3 92.8% 96725.0 92.3%<br />
14829.2 8.7% 10400.0 6.3% 42516.7 11.2% 150.0 .1% 27658.3 13.1% 10200.0 5.6% 13016.7 7.9% 52375.0 12.1% 7179.2 3.1% 7358.3 7.0%<br />
. . 16.7 .0% 8.3 .0% 283.3 .1% 4.2 .0% 12.5 .0% . . . . 75.0 .0% . .<br />
12.5 .0% 8.3 .0% 29.2 .0% 4.2 .0% 20.8 .0% 12.5 .0% 12.5 .0% 145.8 .0% 100.0 .0% 20.8 .0%<br />
16.7 .0% 25.0 .0% 12.5 .0% . . 8.3 .0% 33.3 .0% 25.0 .0% 12.5 .0% 4.2 .0% 16.7 .0%<br />
25.0 .0% 8.3 .0% 12.5 .0% . . 29.2 .0% 4.2 .0% 4.2 .0% . . . . 16.7 .0%<br />
. . . . 8.3 .0% . . 16.7 .0% . . 12.5 .0% 4.2 .0% . . 4.2 .0%<br />
245.8 .1% 216.7 .1% 6916.7 1.8% 8137.5 3.1% 91.7 .0% 375.0 .2% 329.2 .2% 2450.0 .6% 8716.7 3.7% 66.7 .1%<br />
. . . . . . . . . . . . . . 4.2 .0% . . . .<br />
. . 12.5 .0% 12.5 .0% . . . . . . 4.2 .0% . . . . . .<br />
. . . . . . . . . . . . . . 4.2 .0% . . . .<br />
. . . . . . . . . . . . . . 4.2 .0% . . . .<br />
8.3 .0% 8.3 .0% . . . . . . . . 12.5 .0% 12.5 .0% 8.3 .0% . .<br />
12.5 .0% 4.2 .0% . . . . 4.2 .0% . . 12.5 .0% . . . . . .<br />
25.0 .0% 25.0 .0% 25.0 .0% 12.5 .0% 25.0 .0% 20.8 .0% 25.0 .0% 25.0 .0% 16.7 .0% 25.0 .0%<br />
79.2 .0% 41.7 .0% 37.5 .0% . . 141.7 .1% 41.7 .0% 12.5 .0% 37.5 .0% 16.7 .0% 220.8 .2%<br />
. . 4.2 .0% . . . . . . . . . . 8.3 .0% . . 4.2 .0%<br />
170108.3 100.0% 164650.0 100.0% 379320.8 100.0% 261554.2 100.0% 211329.2 100.0% 181791.7 100.0% 164525.0 100.0% 433379.2 100.0% 233379.2 100.0% 104770.8 100.0%<br />
<strong>Horns</strong> <strong>Rev</strong>. <strong>Benthic</strong> communities Page 108<br />
.
Doc. No. 2572-03-005 rev. 4<br />
2004-Spring<br />
HYDROZOA Tubularia indivisa<br />
Campanulariidae indet.<br />
ANTHOZOA Actiniaria indet.<br />
NEMERTINI Nemertini indet.<br />
NEMATODA Nem<strong>at</strong>oda indet.<br />
POLYCHAETA Harmothoe imbric<strong>at</strong>a<br />
Harmothoe impar<br />
Phyllodoce groenl<strong>and</strong>ica<br />
Eulalia viridis<br />
Syllidae indet.<br />
Nereis pelagica<br />
Neanthes virens<br />
Pom<strong>at</strong>oceros triqueter<br />
CRUSTACEA Verruca stroemia<br />
Balanus balanus<br />
Balanus cren<strong>at</strong>us<br />
Brachyura indet.<br />
Cancer pagurus<br />
Pisidia longicornis<br />
Jassa marmor<strong>at</strong>a<br />
Caprella linearis<br />
CHIRONOMIDAE Chironomidae indet.<br />
Telm<strong>at</strong>ogeton japonicus<br />
GASTROPODA Rissoidae indet.<br />
Crepidula fornic<strong>at</strong>a<br />
Nudibranchia indet.<br />
Onchidoris muric<strong>at</strong>a<br />
Polycera quadriline<strong>at</strong>a<br />
Aeolidia papillosa<br />
BIVALVIA<br />
Mytilus edulis<br />
Ostrea edulis<br />
Heteranomia squamula<br />
Hi<strong>at</strong>ella arctica<br />
BRYOZOA Electra pilosa<br />
Alcyonidium sp.<br />
ECHINODERMATA Asterias rubens<br />
Strongylocentrotus<br />
droebachiensis<br />
Total<br />
NNE 02<br />
no./m² Kol Sum %<br />
NNE 04<br />
no./m² Kol Sum %<br />
NNE 06<br />
no./m² Kol Sum %<br />
NNE 08<br />
no./m² Kol Sum %<br />
NNE Bottom<br />
no./m² Kol Sum %<br />
Transect<br />
Turbine tower, vertical<br />
SSW 02<br />
no./m² Kol Sum %<br />
SSW 04<br />
no./m² Kol Sum %<br />
SSW 06<br />
no./m² Kol Sum %<br />
SSW 08<br />
no./m² Kol Sum %<br />
SSW Bottom<br />
no./m² Kol Sum %<br />
. . . . . . . . . . . . 4.2 .0% . . . . 8.3 .0%<br />
. . 4.2 .0% . . . . 4.2 .0% . . 4.2 .0% . . . . . .<br />
8.3 .0% 8.3 .0% 29.2 .0% . . 8.3 .0% 12.5 .0% 20.8 .0% 29.2 .0% . . 4.2 .0%<br />
12.5 .0% 25.0 .0% 112.5 .0% 25.0 .0% 12.5 .0% 29.2 .0% 8.3 .0% 41.7 .0% 20.8 .0% 12.5 .0%<br />
. . . . . . . . . . 4.2 .0% . . . . . . . .<br />
. . . . . . . . . . . . . . 4.2 .0% . . . .<br />
8.3 .0% 12.5 .0% 58.3 .0% 29.2 .1% 8.3 .0% 25.0 .0% 8.3 .0% 25.0 .0% 20.8 .0% . .<br />
. . 8.3 .0% 4.2 .0% 12.5 .0% . . 4.2 .0% 4.2 .0% . . 4.2 .0% . .<br />
4.2 .0% . . 8.3 .0% 4.2 .0% . . 4.2 .0% 4.2 .0% . . 4.2 .0% 8.3 .0%<br />
. . . . . . . . . . 4.2 .0% . . . . . . 4.2 .0%<br />
. . . . 16.7 .0% . . . . . . . . . . . . . .<br />
. . . . . . 4.2 .0% . . . . . . . . . . . .<br />
58.3 .0% 58.3 .0% 4.2 .0% . . 112.5 .1% 175.0 .1% 125.0 .0% 12.5 .0% . . 45.8 .0%<br />
. . . . 4.2 .0% . . . . . . 4.2 .0% . . . . . .<br />
. . . . . . 250.0 .4% . . . . . . 4.2 .0% 62.5 .1% . .<br />
37.5 .0% 416.7 .2% 112.5 .0% . . 20.8 .0% 166.7 .1% 716.7 .3% 70.8 .0% . . 12.5 .0%<br />
. . . . 4.2 .0% . . . . . . . . . . . . . .<br />
4.2 .0% 8.3 .0% 45.8 .0% . . . . . . 4.2 .0% 58.3 .0% 20.8 .0% . .<br />
. . . . 12.5 .0% . . . . . . . . . . . . . .<br />
191441.7 93.6% 215075.0 97.7% 221529.2 86.6% 50375.0 87.3% 98529.2 94.9% 204037.5 89.5% 260800.0 98.1% 253762.5 98.3% 69912.5 93.4% 118666.7 87.6%<br />
12579.2 6.1% 3550.0 1.6% 30600.0 12.0% 320.8 .6% 4829.2 4.7% 22775.0 10.0% 2766.7 1.0% 1687.5 .7% 83.3 .1% 16533.3 12.2%<br />
. . . . . . 4.2 .0% . . . . . . . . 4.2 .0% . .<br />
. . . . . . 1154.2 2.0% . . . . . . . . 1516.7 2.0% . .<br />
. . . . . . 4.2 .0% 4.2 .0% 8.3 .0% . . . . 4.2 .0% . .<br />
33.3 .0% 16.7 .0% . . . . 4.2 .0% 25.0 .0% 62.5 .0% 12.5 .0% . . 4.2 .0%<br />
29.2 .0% 45.8 .0% 4.2 .0% . . . . . . 4.2 .0% 8.3 .0% . . 4.2 .0%<br />
33.3 .0% 29.2 .0% 4.2 .0% . . 4.2 .0% 12.5 .0% 4.2 .0% . . . . . .<br />
45.8 .0% 37.5 .0% 29.2 .0% . . 12.5 .0% 95.8 .0% 41.7 .0% 4.2 .0% . . 8.3 .0%<br />
75.0 .0% 104.2 .0% 37.5 .0% . . 20.8 .0% 116.7 .1% 258.3 .1% 141.7 .1% . . . .<br />
183.3 .1% 729.2 .3% 3058.3 1.2% 5537.5 9.6% 145.8 .1% 525.0 .2% 887.5 .3% 2270.8 .9% 3208.3 4.3% 91.7 .1%<br />
. . . . 4.2 .0% . . . . . . . . . . . . . .<br />
4.2 .0% 16.7 .0% . . . . . . . . 12.5 .0% . . . . . .<br />
8.3 .0% . . 12.5 .0% 4.2 .0% . . 8.3 .0% 4.2 .0% 8.3 .0% 4.2 .0% . .<br />
25.0 .0% 25.0 .0% 20.8 .0% 4.2 .0% 25.0 .0% 25.0 .0% 25.0 .0% 16.7 .0% 8.3 .0% 20.8 .0%<br />
12.5 .0% 12.5 .0% 8.3 .0% . . 16.7 .0% 16.7 .0% . . . . . . 12.5 .0%<br />
25.0 .0% 20.8 .0% . . . . 29.2 .0% 8.3 .0% 4.2 .0% . . . . 41.7 .0%<br />
. . . . 4.2 .0% . . . . . . . . 8.3 .0% . . . .<br />
204629.2 100.0% 220204.2 100.0% 255725.0 100.0% 57729.2 100.0% 103787.5 100.0% 228079.2 100.0% 265775.0 100.0% 258166.7 100.0% 74875.0 100.0% 135479.2 100.0%<br />
<strong>Horns</strong> <strong>Rev</strong>. <strong>Benthic</strong> communities Page 109<br />
.
Doc. No. 2572-03-005 rev. 4<br />
2004-Autumn<br />
HYDROZOA Tubularia indivisa<br />
Hydractinia echin<strong>at</strong>a<br />
Campanulariidae indet.<br />
ANTHOZOA Actiniaria indet.<br />
NEMERTINI Nemertini indet.<br />
NEMATODA Nem<strong>at</strong>oda indet.<br />
POLYCHAETA Harmothoe imbric<strong>at</strong>a<br />
Harmothoe impar<br />
Phyllodoce groenl<strong>and</strong>ica<br />
Eulalia viridis<br />
Ophiodromus flexuosus<br />
Nereis pelagica<br />
Cirr<strong>at</strong>ulidae indet.<br />
Terebellidae indet.<br />
Pom<strong>at</strong>oceros triqueter<br />
CRUSTACEA Verruca stroemia<br />
Balanus balanus<br />
Balanus cren<strong>at</strong>us<br />
Cancer pagurus<br />
Jassa marmor<strong>at</strong>a<br />
Caprella linearis<br />
CHIRONOMIDAE Telm<strong>at</strong>ogeton japonicus<br />
GASTROPODA Rissoidae indet.<br />
Crepidula fornic<strong>at</strong>a<br />
Hinia pygmaea<br />
Nudibranchia indet.<br />
Onchidoris muric<strong>at</strong>a<br />
Polycera quadriline<strong>at</strong>a<br />
Aeolidia papillosa<br />
BIVALVIA Mytilus edulis<br />
Modiolarca tumida<br />
Heteranomia squamula<br />
Thracia phaseolina<br />
BRYOZOA Bryozoa indet.<br />
Electra pilosa<br />
Alcyonidium sp.<br />
ECHINODERMATA Asterias rubens<br />
Ophiura albida<br />
Strongylocentrotus<br />
droebachiensis<br />
Total<br />
NNE 02<br />
no./m² Kol Sum %<br />
NNE 04<br />
no./m² Kol Sum %<br />
NNE 06<br />
no./m² Kol Sum %<br />
NNE 08<br />
no./m² Kol Sum %<br />
NNE 10<br />
no./m² Kol Sum %<br />
NNE Bottom<br />
no./m² Kol Sum %<br />
Transect<br />
Turbine tower, vertical<br />
SSW 02<br />
no./m² Kol Sum %<br />
SSW 04<br />
no./m² Kol Sum %<br />
SSW 06<br />
no./m² Kol Sum %<br />
SSW 08<br />
no./m² Kol Sum %<br />
SSW 10<br />
no./m² Kol Sum %<br />
4.2 .0% 12.5 .0% 20.8 .0% . . . . 12.5 .0% 20.8 .0% 8.3 .0% 4.2 .0% 4.2 .0% . . 12.5<br />
. . 4.2 .0% 8.3 .0% . . . . 8.3 .0% . . . . . . . . . . .<br />
8.3 .0% 12.5 .0% 4.2 .0% . . . . 8.3 .0% 4.2 .0% . . 8.3 .0% . . . . 8.3<br />
25.0 .0% 20.8 .0% 16.7 .0% 8.3 .0% . . 29.2 .0% 29.2 .0% 8.3 .0% 25.0 .0% . . . . 50.0<br />
. . . . . . 12.5 .0% . . . . . . . . 33.3 .0% 33.3 .0% . . .<br />
45.8 .0% 45.8 .0% 8.3 .0% . . . . 16.7 .0% 4.2 .0% 12.5 .0% 29.2 .0% . . . . 12.5<br />
. . . . . . . . . . . . . . . . 33.3 .0% . . . . .<br />
4.2 .0% 8.3 .0% 4.2 .0% . . . . 4.2 .0% 4.2 .0% . . 29.2 .0% . . . . .<br />
. . . . 4.2 .0% . . . . . . 4.2 .0% . . 8.3 .0% . . . . .<br />
150.0 .0% 108.3 .0% 91.7 .0% 54.2 .0% . . 141.7 .0% 70.8 .0% 108.3 .0% 120.8 .0% 20.8 .0% . . 112.5<br />
. . . . . . . . . . . . . . . . 4.2 .0% . . . . .<br />
. . . . . . 33.3 .0% . . . . . . . . . . 12.5 .0% . . .<br />
4.2 .0% . . . . 4.2 .0% . . . . . . 4.2 .0% . . 4.2 .0% . . 4.2<br />
. . . . . . . . . . 4.2 .0% . . . . . . . . . . .<br />
33.3 .0% 54.2 .0% 12.5 .0% . . . . 62.5 .0% 37.5 .0% 33.3 .0% 12.5 .0% . . . . 41.7<br />
4.2 .0% . . . . . . . . . . . . . . . . . . . . 4.2<br />
. . . . 20.8 .0% 266.7 .1% 450.0 5.3% . . 233.3 .1% . . 4.2 .0% 62.5 .0% 750.0 .2% 50.0<br />
50.0 .0% 20.8 .0% 33.3 .0% . . . . 12.5 .0% 83.3 .0% 112.5 .0% 41.7 .0% . . . . 8.3<br />
337.5 .0% 520.8 .1% 950.0 .2% 750.0 .2% . . 520.8 .1% 450.0 .1% 479.2 .1% 600.0 .1% 308.3 .1% . . 558.3<br />
664066.7 87.5% 320720.8 89.5% 566629.2 90.4% 273937.5 84.2% 6837.5 80.3% 409666.7 90.6% 300904.2 89.4% 336850.0 88.5% 450304.2 87.0% 360658.3 92.5% 301350.0 98.5% 208425.0 93<br />
93420.8 12.3% 36454.2 10.2% 57383.3 9.2% 18345.8 5.6% 25.0 .3% 40937.5 9.1% 33970.8 10.1% 42170.8 11.1% 62687.5 12.1% 16070.8 4.1% 25.0 .0% 12829.2<br />
112.5 .0% 45.8 .0% 4.2 .0% 462.5 .1% 1187.5 14.0% 179.2 .0% . . . . 4.2 .0% 816.7 .2% 3812.5 1.2% 4.2<br />
20.8 .0% 45.8 .0% 233.3 .0% 416.7 .1% . . 95.8 .0% 104.2 .0% 120.8 .0% 229.2 .0% 345.8 .1% . . 191.7<br />
16.7 .0% 20.8 .0% 4.2 .0% 16.7 .0% . . 25.0 .0% 37.5 .0% 41.7 .0% 20.8 .0% 8.3 .0% . . 16.7<br />
. . . . . . 4.2 .0% . . . . . . . . . . . . . . .<br />
. . . . . . . . . . . . . . 41.7 .0% . . . . . . .<br />
8.3 .0% 4.2 .0% 16.7 .0% . . . . 4.2 .0% 12.5 .0% 8.3 .0% . . . . . . 8.3<br />
83.3 .0% 75.0 .0% 104.2 .0% 8.3 .0% . . 29.2 .0% 45.8 .0% 50.0 .0% 50.0 .0% 8.3 .0% . . 37.5<br />
33.3 .0% 45.8 .0% 25.0 .0% 66.7 .0% . . 41.7 .0% 29.2 .0% 66.7 .0% 120.8 .0% 4.2 .0% . . .<br />
391.7 .1% 112.5 .0% 1154.2 .2% 30829.2 9.5% 12.5 .1% 120.8 .0% 300.0 .1% 350.0 .1% 3233.3 .6% 11570.8 3.0% . . 129.2<br />
. . . . . . 4.2 .0% . . 4.2 .0% . . . . . . 4.2 .0% . . .<br />
. . . . 4.2 .0% . . . . . . . . . . . . . . . . .<br />
. . . . . . 4.2 .0% . . . . . . . . . . . . . . .<br />
. . . . . . 4.2 .0% . . . . . . . . . . . . . . .<br />
20.8 .0% 20.8 .0% 25.0 .0% 8.3 .0% . . 20.8 .0% 25.0 .0% 20.8 .0% 25.0 .0% 12.5 .0% . . 25.0<br />
4.2 .0% 16.7 .0% 4.2 .0% . . . . 8.3 .0% 25.0 .0% 8.3 .0% 4.2 .0% 4.2 .0% . . 8.3<br />
175.0 .0% 50.0 .0% 45.8 .0% 16.7 .0% . . 133.3 .0% 70.8 .0% 91.7 .0% 120.8 .0% 12.5 .0% . . 133.3<br />
. . 12.5 .0% . . . . . . 4.2 .0% . . . . . . . . . . 4.2<br />
. . . . 8.3 .0% . . . . . . . . 8.3 .0% . . . . . . .<br />
SSW Bottom<br />
no./m² Kol Su<br />
759020.8 100.0% 358433.3 100.0% 626816.7 100.0% 325254.2 100.0% 8512.5 100.0% 452091.7 100.0% 336466.7 100.0% 380595.8 100.0% 517754.2 100.0% 389962.5 100.0% 305937.5 100.0% 222675.0 100<br />
<strong>Horns</strong> <strong>Rev</strong>. <strong>Benthic</strong> communities Page 110<br />
.
Doc. No. 2572-03-005 rev. 4<br />
2005-Spring<br />
HYDROZOA Tubularia indivisa<br />
Hydractinia echin<strong>at</strong>a<br />
Campanulariidae indet.<br />
ANTHOZOA Actiniaria indet.<br />
NEMERTINI Nemertini indet.<br />
NEMATODA Nem<strong>at</strong>oda indet.<br />
POLYCHAETA Lepidonotus squam<strong>at</strong>us<br />
Harmothoe imbric<strong>at</strong>a<br />
Harmothoe impar<br />
Eulalia viridis<br />
Hesionidae indet.<br />
Ophiodromus flexuosus<br />
Syllidae indet.<br />
Chaetopterus norvegicus<br />
Pom<strong>at</strong>oceros triqueter<br />
CRUSTACEA Verruca stroemia<br />
Balanus balanus<br />
Balanus cren<strong>at</strong>us<br />
Cancer pagurus<br />
Pisidia longicornis<br />
Jassa marmor<strong>at</strong>a<br />
Atylus swammerdami<br />
Caprella linearis<br />
CHIRONOMIDAE Telm<strong>at</strong>ogeton japonicus<br />
GASTROPODA Tectura testudinalis<br />
Rissoidae indet.<br />
Crepidula fornic<strong>at</strong>a<br />
Polinices polianus<br />
Onchidoris muric<strong>at</strong>a<br />
Polycera quadriline<strong>at</strong>a<br />
Facelina bostoniensis<br />
Aeolidia papillosa<br />
BIVALVIA Mytilus edulis<br />
Heteranomia squamula<br />
Hi<strong>at</strong>ella arctica<br />
BRYOZOA Bryozoa indet.<br />
Electra pilosa<br />
Alcyonidium sp.<br />
ECHINODERMATA Asterias rubens<br />
Strongylocentrotus<br />
droebachiensis<br />
Total<br />
NNE 02<br />
no./m² Kol Sum %<br />
NNE 04<br />
no./m² Kol Sum %<br />
NNE 06<br />
no./m² Kol Sum %<br />
NNE 08<br />
no./m² Kol Sum %<br />
NNE 10<br />
no./m² Kol Sum %<br />
NNE Bottom<br />
no./m² Kol Sum %<br />
Transect<br />
Turbine tower, vertical<br />
SSW 02<br />
no./m² Kol Sum %<br />
SSW 04<br />
no./m² Kol Sum %<br />
SSW 06<br />
no./m² Kol Sum %<br />
SSW 08<br />
no./m² Kol Sum %<br />
SSW 10<br />
no./m² Kol Sum %<br />
20.8 .0% 12.5 .0% 12.5 .0% . . . . 16.7 .0% 16.7 .0% 4.2 .0% 4.2 .0% . . . . 16.7<br />
4.2 .0% 4.2 .0% . . . . . . . . 4.2 .0% 4.2 .0% . . . . . . 4.2<br />
. . . . 8.3 .0% . . . . . . 4.2 .0% . . 4.2 .0% 4.2 .0% . . 8.3<br />
12.5 .0% 8.3 .0% 16.7 .0% . . . . 20.8 .0% 16.7 .0% 12.5 .0% 8.3 .0% . . . . 16.7<br />
. . 4.2 .0% 104.2 .1% . . . . . . . . . . 25.0 .0% . . . . .<br />
95.8 .1% 41.7 .1% 700.0 1.0% 12.5 .1% 12.5 .5% 262.5 .2% 66.7 .1% 225.0 .2% 333.3 .5% 25.0 .1% . . 12.5<br />
. . . . 8.3 .0% . . . . . . . . . . . . . . . . .<br />
. . . . 20.8 .0% . . . . . . . . . . 16.7 .0% . . . . .<br />
. . . . 4.2 .0% . . . . . . . . . . 20.8 .0% . . . . .<br />
79.2 .1% 62.5 .1% 112.5 .2% . . . . 120.8 .1% 79.2 .1% 87.5 .1% 37.5 .1% 4.2 .0% . . 37.5<br />
. . 4.2 .0% . . . . . . . . . . . . . . . . . . .<br />
8.3 .0% . . . . . . . . 4.2 .0% . . . . . . . . . . .<br />
. . . . 4.2 .0% . . . . . . . . . . . . . . . . .<br />
4.2 .0% . . . . . . . . . . . . . . . . . . . . .<br />
25.0 .0% 16.7 .0% 20.8 .0% . . . . 41.7 .0% 70.8 .1% 79.2 .1% 25.0 .0% . . . . 12.5<br />
. . 4.2 .0% . . . . . . 12.5 .0% . . 8.3 .0% 4.2 .0% 4.2 .0% . . .<br />
4.2 .0% 8.3 .0% 4.2 .0% . . . . . . . . 8.3 .0% . . 8.3 .0% . . .<br />
. . 12.5 .0% 4.2 .0% . . . . 4.2 .0% . . . . . . . . . . .<br />
20.8 .0% 12.5 .0% 191.7 .3% . . . . . . 12.5 .0% . . 104.2 .2% 12.5 .1% . . .<br />
. . . . 4.2 .0% . . . . . . . . . . 4.2 .0% . . . . .<br />
101370.8 76.9% 70237.5 88.4% 64583.3 87.7% 18741.7 94.6% 12.5 .5% 113141.7 98.0% 76270.8 81.8% 74800.0 80.5% 61345.8 90.8% 8537.5 42.9% 100.0 4.1% 31033.3 9<br />
. . . . . . . . . . 4.2 .0% . . . . . . . . . . .<br />
29929.2 22.7% 8529.2 10.7% 3750.0 5.1% 58.3 .3% . . 1612.5 1.4% 16429.2 17.6% 16987.5 18.3% 3195.8 4.7% 79.2 .4% . . 1079.2<br />
. . . . 8.3 .0% 791.7 4.0% 2475.0 99.0% 4.2 .0% . . . . 4.2 .0% 1037.5 5.2% 2350.0 95.9% .<br />
. . . . . . . . . . . . . . 4.2 .0% . . . . . . 4.2<br />
. . . . 104.2 .1% . . . . 8.3 .0% . . . . 29.2 .0% 20.8 .1% . . 8.3<br />
29.2 .0% 25.0 .0% 4.2 .0% 4.2 .0% . . . . 37.5 .0% 29.2 .0% 16.7 .0% . . . . 4.2<br />
. . . . . . 4.2 .0% . . . . . . . . . . . . . . .<br />
4.2 .0% 20.8 .0% 20.8 .0% . . . . 12.5 .0% 4.2 .0% . . 25.0 .0% . . . . 4.2<br />
. . . . 4.2 .0% . . . . . . . . 8.3 .0% . . . . . . .<br />
. . . . 4.2 .0% . . . . 4.2 .0% . . 20.8 .0% 8.3 .0% 4.2 .0% . . 4.2<br />
. . . . . . . . . . . . 8.3 .0% . . 4.2 .0% . . . . .<br />
166.7 .1% 437.5 .6% 3912.5 5.3% 187.5 .9% . . 129.2 .1% 220.8 .2% 545.8 .6% 2316.7 3.4% 10150.0 51.0% . . 37.5<br />
. . . . . . . . . . 4.2 .0% . . . . . . . . . . .<br />
. . . . 4.2 .0% . . . . . . . . . . . . . . . . .<br />
. . . . . . . . . . . . . . . . . . . . . . 4.2<br />
25.0 .0% 25.0 .0% 16.7 .0% 8.3 .0% . . 16.7 .0% 20.8 .0% 25.0 .0% 25.0 .0% 12.5 .1% . . 12.5<br />
20.8 .0% 12.5 .0% 16.7 .0% . . . . 4.2 .0% 25.0 .0% 16.7 .0% 8.3 .0% . . . . 12.5<br />
4.2 .0% 8.3 .0% 12.5 .0% 4.2 .0% . . 16.7 .0% 4.2 .0% 16.7 .0% 12.5 .0% . . . . 25.0<br />
. . . . . . . . . . . . . . . . 4.2 .0% . . . . .<br />
SSW Bottom<br />
no./m² Kol Su<br />
131825.0 100.0% 79487.5 100.0% 73658.3 100.0% 19812.5 100.0% 2500.0 100.0% 115441.7 100.0% 93291.7 100.0% 92883.3 100.0% 67583.3 100.0% 19900.0 100.0% 2450.0 100.0% 32337.5 10<br />
<strong>Horns</strong> <strong>Rev</strong>. <strong>Benthic</strong> communities Page 111<br />
.
Doc. No. 2572-03-005 rev. 4<br />
2005-Autumn<br />
PORIFERA Porifera indet.<br />
Halichondria panicea<br />
HYDROZOA Tubularia indivisa<br />
Hydractinia echin<strong>at</strong>a<br />
Campanulariidae indet.<br />
Sertularia cupressina<br />
ANTHOZOA Alcyonium digit<strong>at</strong>um<br />
Actiniaria indet.<br />
NEMERTINI Nemertini indet.<br />
NEMATODA Nem<strong>at</strong>oda indet.<br />
POLYCHAETA Lepidonotus squam<strong>at</strong>us<br />
Harmothoe imbric<strong>at</strong>a<br />
Harmothoe impar<br />
Phyllodoce groenl<strong>and</strong>ica<br />
Eulalia viridis<br />
Polydora cornuta<br />
Chaetopterus norvegicus<br />
Pom<strong>at</strong>oceros triqueter<br />
CRUSTACEA Harpacticoida indet.<br />
Verruca stroemia<br />
Balanus balanus<br />
Cancer pagurus<br />
Pilumnus hirtellus<br />
Pisidia longicornis<br />
Stenothoe sp.<br />
Jassa marmor<strong>at</strong>a<br />
Atylus swammerdami<br />
Caprella linearis<br />
CHIRONOMIDAE Telm<strong>at</strong>ogeton japonicus<br />
GASTROPODA Rissoidae indet.<br />
Crepidula fornic<strong>at</strong>a<br />
Polinices polianus<br />
Nudibranchia indet.<br />
Onchidoris muric<strong>at</strong>a<br />
Polycera quadriline<strong>at</strong>a<br />
Facelina bostoniensis<br />
Aeolidia papillosa<br />
BIVALVIA Mytilus edulis<br />
Tridonta borealis<br />
Angulus tenuis<br />
Fabulina fabula<br />
Moerella pygmaea<br />
Donax vitt<strong>at</strong>us<br />
Hi<strong>at</strong>ella arctica<br />
Phaxas pellucidus<br />
BRYOZOA Electra pilosa<br />
Alcyonidium sp.<br />
ECHINODERMATA Asterias rubens<br />
Strongylocentrotus<br />
droebachiensis<br />
Total<br />
NNE 02<br />
no./m² Kol Sum %<br />
NNE 04<br />
no./m² Kol Sum %<br />
NNE 06<br />
no./m² Kol Sum %<br />
NNE 08<br />
no./m² Kol Sum %<br />
NNE Bottom<br />
no./m² Kol Sum %<br />
Transect<br />
Turbine tower, vertical<br />
SSW 02<br />
no./m² Kol Sum %<br />
SSW 04<br />
no./m² Kol Sum %<br />
SSW 06<br />
no./m² Kol Sum %<br />
SSW 08<br />
no./m² Kol Sum %<br />
SSW Bottom<br />
no./m² Kol Sum %<br />
. . 4.2 .0% . . . . . . . . . . . . . . . .<br />
. . . . . . . . 4.2 .0% . . . . . . . . . .<br />
25.0 .0% 20.8 .0% 25.0 .0% 12.5 .0% 25.0 .0% 25.0 .0% 25.0 .0% 25.0 .0% 16.7 .0% 25.0 .0%<br />
4.2 .0% 8.3 .0% . . . . 8.3 .0% 4.2 .0% 4.2 .0% . . . . 4.2 .0%<br />
8.3 .0% 12.5 .0% 12.5 .0% . . 4.2 .0% 16.7 .0% 16.7 .0% . . . . 12.5 .0%<br />
. . . . . . . . 4.2 .0% . . . . . . . . . .<br />
. . . . . . . . . . . . . . . . . . 4.2 .0%<br />
45.8 .0% 91.7 .0% 25.0 .0% 29.2 .0% 50.0 .0% 104.2 .0% 37.5 .0% 116.7 .0% 70.8 .0% 83.3 .0%<br />
79.2 .0% 16.7 .0% 175.0 .0% 216.7 .1% 4.2 .0% 54.2 .0% 287.5 .1% 479.2 .1% 75.0 .0% 4.2 .0%<br />
125.0 .0% 958.3 .1% 2095.8 .3% 158.3 .0% 112.5 .0% 79.2 .0% 70.8 .0% 304.2 .0% 104.2 .0% 237.5 .1%<br />
. . . . . . . . . . . . . . 16.7 .0% . . . .<br />
. . . . . . . . . . . . . . 4.2 .0% . . . .<br />
20.8 .0% 4.2 .0% 70.8 .0% 25.0 .0% 12.5 .0% 4.2 .0% 8.3 .0% 20.8 .0% 4.2 .0% 12.5 .0%<br />
. . . . 4.2 .0% . . . . . . . . . . . . . .<br />
187.5 .1% 341.7 .0% 504.2 .1% 187.5 .0% 408.3 .1% 458.3 .1% 279.2 .1% 404.2 .1% 141.7 .1% 387.5 .1%<br />
. . . . . . . . . . 4.2 .0% . . . . . . . .<br />
. . . . . . . . . . 4.2 .0% . . 4.2 .0% . . 4.2 .0%<br />
12.5 .0% 4.2 .0% . . . . 62.5 .0% 37.5 .0% 8.3 .0% 4.2 .0% . . 20.8 .0%<br />
. . . . . . . . 4.2 .0% . . . . . . . . . .<br />
33.3 .0% 29.2 .0% 4.2 .0% . . 100.0 .0% 58.3 .0% 37.5 .0% 8.3 .0% . . 95.8 .0%<br />
191.7 .1% 104.2 .0% 375.0 .1% 450.0 .1% 62.5 .0% 91.7 .0% 137.5 .0% 87.5 .0% 4.2 .0% 50.0 .0%<br />
237.5 .1% 320.8 .0% 545.8 .1% 150.0 .0% 291.7 .0% 329.2 .1% 279.2 .1% 575.0 .1% 50.0 .0% 529.2 .2%<br />
. . . . 4.2 .0% . . . . . . . . 4.2 .0% . . . .<br />
. . 4.2 .0% 4.2 .0% . . 4.2 .0% . . . . . . . . . .<br />
. . . . . . . . . . 16.7 .0% . . . . . . 8.3 .0%<br />
240929.2 90.3% 664700.0 94.7% 576208.3 89.2% 411145.8 95.9% 598879.2 93.5% 400270.8 91.2% 526920.8 96.7% 583154.2 89.9% 182100.0 86.9% 272616.7 93.6%<br />
12.5 .0% 12.5 .0% 12.5 .0% . . 16.7 .0% 54.2 .0% 12.5 .0% 4.2 .0% . . 70.8 .0%<br />
23900.0 9.0% 34470.8 4.9% 60766.7 9.4% 175.0 .0% 39470.8 6.2% 36220.8 8.3% 15958.3 2.9% 60058.3 9.3% 8.3 .0% 15516.7 5.3%<br />
4.2 .0% . . . . 987.5 .2% 4.2 .0% 4.2 .0% 4.2 .0% 4.2 .0% 487.5 .2% . .<br />
12.5 .0% 4.2 .0% 8.3 .0% 33.3 .0% 50.0 .0% 25.0 .0% 4.2 .0% 16.7 .0% 20.8 .0% 100.0 .0%<br />
41.7 .0% 25.0 .0% 16.7 .0% . . 45.8 .0% 79.2 .0% 50.0 .0% 41.7 .0% 4.2 .0% 83.3 .0%<br />
. . 4.2 .0% . . . . . . . . . . . . . . . .<br />
. . . . . . . . 4.2 .0% . . . . . . . . . .<br />
. . . . . . . . . . . . . . 4.2 .0% . . 4.2 .0%<br />
54.2 .0% 75.0 .0% 116.7 .0% 4.2 .0% 50.0 .0% 29.2 .0% 41.7 .0% 158.3 .0% . . 50.0 .0%<br />
120.8 .0% 33.3 .0% 33.3 .0% . . 62.5 .0% 66.7 .0% 100.0 .0% 8.3 .0% 4.2 .0% 54.2 .0%<br />
. . . . . . . . . . 4.2 .0% 16.7 .0% 4.2 .0% . . . .<br />
650.0 .2% 695.8 .1% 4762.5 .7% 15120.8 3.5% 887.5 .1% 854.2 .2% 700.0 .1% 2845.8 .4% 26462.5 12.6% 1083.3 .4%<br />
. . . . . . . . . . 4.2 .0% . . . . . . . .<br />
. . . . . . . . . . 4.2 .0% . . . . . . . .<br />
. . . . . . . . . . 4.2 .0% . . . . . . . .<br />
. . . . . . . . . . . . . . 8.3 .0% . . 4.2 .0%<br />
. . . . . . 4.2 .0% . . . . . . . . . . . .<br />
. . 4.2 .0% 4.2 .0% 12.5 .0% 4.2 .0% 4.2 .0% 4.2 .0% 4.2 .0% 4.2 .0% . .<br />
. . . . . . . . . . 4.2 .0% . . . . . . . .<br />
25.0 .0% 20.8 .0% 20.8 .0% 12.5 .0% 25.0 .0% 25.0 .0% 20.8 .0% 25.0 .0% 16.7 .0% 25.0 .0%<br />
25.0 .0% 16.7 .0% 16.7 .0% 4.2 .0% 16.7 .0% 12.5 .0% . . 8.3 .0% . . 12.5 .0%<br />
8.3 .0% 4.2 .0% 41.7 .0% . . 37.5 .0% 25.0 .0% . . 16.7 .0% . . 20.8 .0%<br />
. . . . . . . . 8.3 .0% . . . . 4.2 .0% . . 8.3 .0%<br />
266754.2 100.0% 701987.5 100.0% 645854.2 100.0% 428729.2 100.0% 640720.8 100.0% 438979.2 100.0% 545025.0 100.0% 648420.8 100.0% 209575.0 100.0% 291129.2 100.0%<br />
<strong>Horns</strong> <strong>Rev</strong>. <strong>Benthic</strong> communities Page 112<br />
.
Doc. No. 2572-03-005 rev. 4<br />
8.4.3. Appendix 4.4. Mean abundance. Scour protections 2003-2005<br />
2003<br />
Spring<br />
HYDROZOA Hydrozoa indet.<br />
Thec<strong>at</strong>a indet.<br />
Campanulariidae indet.<br />
ANTHOZOA Anthozoa indet.<br />
Actiniaria indet.<br />
NEMERTINI Nemertini indet.<br />
POLYCHAETA Harmothoe impar<br />
Phyllodoce groenl<strong>and</strong>ica<br />
Eulalia viridis<br />
Chaetopterus norvegicus<br />
Pom<strong>at</strong>oceros triqueter<br />
CRUSTACEA Verruca stroemia<br />
Balanus cren<strong>at</strong>us<br />
Cancer pagurus<br />
Corophium crassicorne<br />
Jassa marmor<strong>at</strong>a<br />
Caprella linearis<br />
GASTROPODA Rissoidae indet.<br />
Crepidula fornic<strong>at</strong>a<br />
Nudibranchia indet.<br />
Onchidoris muric<strong>at</strong>a<br />
BIVALVIA Bivalvia indet.<br />
Mytilus edulis<br />
Heteranomia squamula<br />
Moerella pygmaea<br />
Thracia phaseolina<br />
BRYOZOA Bryozoa indet.<br />
Electra pilosa<br />
ECHINODERMATA Asterias rubens<br />
Ophiura albida<br />
Strongylocentrotus<br />
droebachiensis<br />
Total<br />
A 0.5 NNE<br />
no./m² Kol Sum %<br />
B 02 NNE<br />
no./m² Kol Sum %<br />
Transect<br />
Found<strong>at</strong>ions, horizontal<br />
C 05 NNE<br />
no./m² Kol Sum %<br />
D 05 SSW<br />
no./m² Kol Sum %<br />
. . 1.4 .0% . . . .<br />
. . . . 1.4 .0% . .<br />
. . 1.4 .0% 2.8 .0% . .<br />
5.6 .0% 56.9 .3% . . 5.6 .0%<br />
66.7 .4% 108.3 .5% 201.4 .6% 97.2 .2%<br />
2.8 .0% 1.4 .0% . . 1.4 .0%<br />
8.3 .0% 22.2 .1% 29.2 .1% 15.3 .0%<br />
2.8 .0% 18.1 .1% 62.5 .2% 45.8 .1%<br />
1.4 .0% 1.4 .0% 5.6 .0% . .<br />
. . 1.4 .0% 2.8 .0% . .<br />
1.4 .0% 6.9 .0% 5.6 .0% 2.8 .0%<br />
4.2 .0% 1.4 .0% . . 2.8 .0%<br />
325.0 1.8% 176.4 .8% 1940.3 6.1% 251.4 .6%<br />
1.4 .0% . . 4.2 .0% . .<br />
. . . . 2.8 .0% . .<br />
15551.4 85.9% 18606.9 83.0% 28136.1 88.5% 40273.6 93.7%<br />
543.1 3.0% 1643.1 7.3% 133.3 .4% 43.1 .1%<br />
1.4 .0% 9.7 .0% 36.1 .1% 2.8 .0%<br />
6.9 .0% 26.4 .1% 83.3 .3% 12.5 .0%<br />
. . . . 1.4 .0% 6.9 .0%<br />
5.6 .0% . . 1.4 .0% . .<br />
. . 1.4 .0% . . . .<br />
1479.2 8.2% 1627.8 7.3% 1023.6 3.2% 2191.7 5.1%<br />
. . 1.4 .0% 1.4 .0% . .<br />
8.3 .0% 18.1 .1% 48.6 .2% . .<br />
. . . . 2.8 .0% . .<br />
. . 1.4 .0% 1.4 .0% . .<br />
15.3 .1% 20.8 .1% 11.1 .0% 15.3 .0%<br />
65.3 .4% 61.1 .3% 45.8 .1% 26.4 .1%<br />
. . 1.4 .0% 4.2 .0% 1.4 .0%<br />
. . . . . . 1.4 .0%<br />
18095.8 100.0% 22416.7 100.0% 31788.9 100.0% 42997.2 100.0%<br />
Autumn<br />
PORIFERA Porifera indet.<br />
HYDROZOA Tubularia indivisa<br />
Campanulariidae indet.<br />
ANTHOZOA Actiniaria indet.<br />
NEMERTINI Nemertini indet.<br />
NEMATODA Nem<strong>at</strong>oda indet.<br />
POLYCHAETA Harmothoe impar<br />
Phyllodocidae indet.<br />
Phyllodoce groenl<strong>and</strong>ica<br />
Eulalia viridis<br />
Syllidae indet.<br />
Nereididae indet.<br />
Polydora cili<strong>at</strong>a<br />
Capitella capit<strong>at</strong>a<br />
Pom<strong>at</strong>oceros triqueter<br />
PYCNOGONIDA Phoxichilidium femor<strong>at</strong>um<br />
CRUSTACEA Verruca stroemia<br />
Balanus cren<strong>at</strong>us<br />
Cancer pagurus<br />
Stenothoe marina<br />
Jassa marmor<strong>at</strong>a<br />
Atylus swammerdami<br />
Caprella linearis<br />
Hyperia galba<br />
CHIRONOMIDAE Telm<strong>at</strong>ogeton japonicus<br />
GASTROPODA Rissoidae indet.<br />
Crepidula fornic<strong>at</strong>a<br />
Polinices sp.<br />
Nudibranchia indet.<br />
Onchidoris muric<strong>at</strong>a<br />
BIVALVIA Mytilus edulis<br />
Moerella pygmaea<br />
Hi<strong>at</strong>ella arctica<br />
BRYOZOA Bryozoa indet.<br />
Electra pilosa<br />
ECHINODERMATA Asterias rubens<br />
Strongylocentrotus<br />
droebachiensis<br />
Total<br />
A 0.5 NNE<br />
no./m² Kol Sum %<br />
B 02 NNE<br />
no./m² Kol Sum %<br />
Transect<br />
Found<strong>at</strong>ions, horizontal<br />
C 05 NNE<br />
no./m² Kol Sum %<br />
D 05 SSW<br />
no./m² Kol Sum %<br />
. . . . 1.4 .0% . .<br />
25.0 .1% 23.6 .1% 25.0 .1% 22.2 .1%<br />
16.7 .0% 15.3 .1% 18.1 .1% 13.9 .0%<br />
34.7 .1% 98.6 .4% 129.2 .4% 65.3 .2%<br />
1.4 .0% . . 1.4 .0% 1.4 .0%<br />
1.4 .0% 6.9 .0% 8.3 .0% 2.8 .0%<br />
. . . . 1.4 .0% . .<br />
. . 1.4 .0% . . . .<br />
18.1 .0% 16.7 .1% 11.1 .0% 11.1 .0%<br />
2.8 .0% 4.2 .0% . . . .<br />
. . . . . . 1.4 .0%<br />
1.4 .0% . . . . . .<br />
. . . . 2.8 .0% . .<br />
. . 1.4 .0% 1.4 .0% . .<br />
12.5 .0% 22.2 .1% 11.1 .0% 29.2 .1%<br />
1.4 .0% . . . . . .<br />
1.4 .0% 12.5 .0% 12.5 .0% 1.4 .0%<br />
9.7 .0% 8.3 .0% 8.3 .0% 16.7 .0%<br />
8.3 .0% 13.9 .1% 40.3 .1% 22.2 .1%<br />
1.4 .0% . . . . . .<br />
33765.3 89.8% 25275.0 91.7% 29565.3 95.3% 37587.5 92.9%<br />
. . 1.4 .0% . . . .<br />
3220.8 8.6% 1531.9 5.6% 805.6 2.6% 2179.2 5.4%<br />
1.4 .0% . . . . . .<br />
1.4 .0% . . . . . .<br />
190.3 .5% 190.3 .7% 123.6 .4% 143.1 .4%<br />
23.6 .1% 33.3 .1% 16.7 .1% 27.8 .1%<br />
. . . . 2.8 .0% . .<br />
4.2 .0% 11.1 .0% 12.5 .0% 29.2 .1%<br />
6.9 .0% 12.5 .0% 19.4 .1% 70.8 .2%<br />
84.7 .2% 194.4 .7% 93.1 .3% 125.0 .3%<br />
. . . . 1.4 .0% 1.4 .0%<br />
. . 1.4 .0% 2.8 .0% 5.6 .0%<br />
1.4 .0% 2.8 .0% 1.4 .0% . .<br />
20.8 .1% 19.4 .1% 22.2 .1% 22.2 .1%<br />
123.6 .3% 73.6 .3% 80.6 .3% 77.8 .2%<br />
1.4 .0% 1.4 .0% 1.4 .0% . .<br />
37581.9 100.0% 27573.6 100.0% 31020.8 100.0% 40456.9 100.0%<br />
<strong>Horns</strong> <strong>Rev</strong>. <strong>Benthic</strong> communities Page 113<br />
.
Doc. No. 2572-03-005 rev. 4<br />
2004<br />
Spring<br />
PORIFERA Halichondria panicea<br />
HYDROZOA Tubularia indivisa<br />
Campanulariidae indet.<br />
ANTHOZOA Alcyonium digit<strong>at</strong>um<br />
Actiniaria indet.<br />
NEMERTINI Nemertini indet.<br />
POLYCHAETA Phyllodoce groenl<strong>and</strong>ica<br />
Eulalia viridis<br />
Syllidae indet.<br />
Polydora cili<strong>at</strong>a<br />
Capitella capit<strong>at</strong>a<br />
Pom<strong>at</strong>oceros triqueter<br />
CRUSTACEA Verruca stroemia<br />
Balanus cren<strong>at</strong>us<br />
Corystes cassivelaunus<br />
Cancer pagurus<br />
Jassa marmor<strong>at</strong>a<br />
Caprella linearis<br />
GASTROPODA Rissoidae indet.<br />
Crepidula fornic<strong>at</strong>a<br />
Nudibranchia indet.<br />
Onchidoris muric<strong>at</strong>a<br />
Polycera quadriline<strong>at</strong>a<br />
Aeolidia papillosa<br />
BIVALVIA Mytilus edulis<br />
Goodallia triangularis<br />
Hi<strong>at</strong>ella arctica<br />
BRYOZOA Electra pilosa<br />
Alcyonidium sp.<br />
ECHINODERMATA Asterias rubens<br />
Total<br />
A 0.5 NNE<br />
no./m² Kol Sum %<br />
B 02 NNE<br />
no./m² Kol Sum %<br />
Transect<br />
Found<strong>at</strong>ions, horizontal<br />
C 05 NNE<br />
no./m² Kol Sum %<br />
D 05 SSW<br />
no./m² Kol Sum %<br />
. . 1.4 .0% 1.4 .0% . .<br />
6.9 .0% 1.4 .0% . . 4.2 .0%<br />
4.2 .0% 2.8 .0% 4.2 .0% 5.6 .0%<br />
. . 1.4 .0% 4.2 .0% . .<br />
25.0 .1% 59.7 .2% 108.3 .3% 56.9 .2%<br />
11.1 .0% 6.9 .0% 6.9 .0% 5.6 .0%<br />
1.4 .0% 6.9 .0% 8.3 .0% 5.6 .0%<br />
1.4 .0% . . 1.4 .0% . .<br />
. . 1.4 .0% 1.4 .0% . .<br />
. . 1.4 .0% . . . .<br />
1.4 .0% 2.8 .0% . . . .<br />
15.3 .0% 16.7 .0% 11.1 .0% 11.1 .0%<br />
. . . . 2.8 .0% 1.4 .0%<br />
2.8 .0% 5.6 .0% 8.3 .0% 6.9 .0%<br />
. . 1.4 .0% 1.4 .0% . .<br />
. . . . . . 1.4 .0%<br />
41859.7 96.0% 32056.9 95.2% 35236.1 97.3% 30263.9 98.0%<br />
1423.6 3.3% 943.1 2.8% 297.2 .8% 206.9 .7%<br />
19.4 .0% 108.3 .3% 95.8 .3% 11.1 .0%<br />
1.4 .0% 2.8 .0% 1.4 .0% 5.6 .0%<br />
19.4 .0% . . 1.4 .0% 11.1 .0%<br />
4.2 .0% 1.4 .0% 1.4 .0% . .<br />
5.6 .0% 25.0 .1% 50.0 .1% 31.9 .1%<br />
1.4 .0% 9.7 .0% 18.1 .0% 25.0 .1%<br />
111.1 .3% 336.1 1.0% 238.9 .7% 108.3 .4%<br />
1.4 .0% . . . . . .<br />
. . . . 1.4 .0% 2.8 .0%<br />
22.2 .1% 19.4 .1% 20.8 .1% 19.4 .1%<br />
2.8 .0% 1.4 .0% . . . .<br />
40.3 .1% 61.1 .2% 75.0 .2% 84.7 .3%<br />
43581.9 100.0% 33675.0 100.0% 36197.2 100.0% 30869.4 100.0%<br />
Autumn<br />
PORIFERA Porifera indet.<br />
HYDROZOA Tubularia indivisa<br />
Campanulariidae indet.<br />
Sertularia cupressina<br />
ANTHOZOA Alcyonium digit<strong>at</strong>um<br />
Actiniaria indet.<br />
NEMERTINI Nemertini indet.<br />
NEMATODA Nem<strong>at</strong>oda indet.<br />
POLYCHAETA Phyllodoce groenl<strong>and</strong>ica<br />
Eulalia viridis<br />
Nereis pelagica<br />
Polydora cili<strong>at</strong>a<br />
Cirr<strong>at</strong>ulidae indet.<br />
Terebellidae indet.<br />
Lanice conchilega<br />
Sabellaria sp.<br />
Pom<strong>at</strong>oceros triqueter<br />
CRUSTACEA Verruca stroemia<br />
Balanus cren<strong>at</strong>us<br />
Cancer pagurus<br />
Liocarcinus depur<strong>at</strong>or<br />
Jassa marmor<strong>at</strong>a<br />
Caprella linearis<br />
GASTROPODA Rissoidae indet.<br />
Crepidula fornic<strong>at</strong>a<br />
Hinia pygmaea<br />
Nudibranchia indet.<br />
Onchidoris muric<strong>at</strong>a<br />
Polycera quadriline<strong>at</strong>a<br />
Aeolidia papillosa<br />
BIVALVIA Mytilus edulis<br />
Angulus tenuis<br />
Moerella pygmaea<br />
Hi<strong>at</strong>ella arctica<br />
BRYOZOA Bryozoa indet.<br />
Electra pilosa<br />
Alcyonidium sp.<br />
ECHINODERMATA Asterias rubens<br />
Ophiura albida<br />
Strongylocentrotus<br />
droebachiensis<br />
Total<br />
A 0.5 NNE<br />
no./m² Kol Sum %<br />
B 02 NNE<br />
no./m² Kol Sum %<br />
Transect<br />
Found<strong>at</strong>ions, horizontal<br />
C 05 NNE<br />
no./m² Kol Sum %<br />
D 05 SSW<br />
no./m² Kol Sum %<br />
. . . . . . 1.4 .0%<br />
15.3 .0% 5.6 .0% 11.1 .0% 11.1 .0%<br />
4.2 .0% 4.2 .0% 5.6 .0% 2.8 .0%<br />
2.8 .0% . . . . 2.8 .0%<br />
2.8 .0% 4.2 .0% 4.2 .0% 5.6 .0%<br />
65.3 .1% 68.1 .1% 134.7 .2% 43.1 .0%<br />
. . . . . . 2.8 .0%<br />
13.9 .0% 13.9 .0% 36.1 .1% 8.3 .0%<br />
6.9 .0% 6.9 .0% 16.7 .0% 6.9 .0%<br />
27.8 .0% 12.5 .0% 30.6 .1% 36.1 .0%<br />
. . . . . . 1.4 .0%<br />
. . . . . . 1.4 .0%<br />
. . 1.4 .0% . . . .<br />
. . . . . . 2.8 .0%<br />
. . . . 1.4 .0% . .<br />
. . . . 1.4 .0% . .<br />
13.9 .0% 16.7 .0% 29.2 .0% 19.4 .0%<br />
5.6 .0% 12.5 .0% 22.2 .0% 23.6 .0%<br />
12.5 .0% 6.9 .0% 11.1 .0% 23.6 .0%<br />
222.2 .3% 208.3 .2% 170.8 .3% 218.1 .1%<br />
1.4 .0% . . . . . .<br />
86323.6 97.9% 106500.0 97.5% 57236.1 97.4% 141586.1 97.1%<br />
966.7 1.1% 1902.8 1.7% 573.6 1.0% 2915.3 2.0%<br />
93.1 .1% 129.2 .1% 102.8 .2% 281.9 .2%<br />
6.9 .0% 54.2 .0% 18.1 .0% 23.6 .0%<br />
4.2 .0% 5.6 .0% 19.4 .0% 13.9 .0%<br />
6.9 .0% . . . . 12.5 .0%<br />
2.8 .0% . . 1.4 .0% 2.8 .0%<br />
19.4 .0% . . 6.9 .0% 9.7 .0%<br />
8.3 .0% 5.6 .0% 2.8 .0% . .<br />
159.7 .2% 111.1 .1% 122.2 .2% 206.9 .1%<br />
1.4 .0% 5.6 .0% 1.4 .0% 2.8 .0%<br />
4.2 .0% . . . . . .<br />
. . 1.4 .0% . . . .<br />
. . . . 1.4 .0% . .<br />
22.2 .0% 15.3 .0% 19.4 .0% 23.6 .0%<br />
1.4 .0% 1.4 .0% 2.8 .0% . .<br />
163.9 .2% 113.9 .1% 148.6 .3% 211.1 .1%<br />
18.1 .0% 18.1 .0% 18.1 .0% 45.8 .0%<br />
5.6 .0% 1.4 .0% 4.2 .0% . .<br />
88202.8 100.0% 109226.4 100.0% 58754.2 100.0% 145747.2 100.0%<br />
<strong>Horns</strong> <strong>Rev</strong>. <strong>Benthic</strong> communities Page 114<br />
.
Doc. No. 2572-03-005 rev. 4<br />
2005<br />
Spring<br />
HYDROZOA Tubularia indivisa<br />
Hydractinia echin<strong>at</strong>a<br />
Campanulariidae indet.<br />
Sertularia cupressina<br />
ANTHOZOA Alcyonium digit<strong>at</strong>um<br />
Actiniaria indet.<br />
NEMERTINI Nemertini indet.<br />
NEMATODA Nem<strong>at</strong>oda indet.<br />
POLYCHAETA Harmothoe impar<br />
Phyllodoce groenl<strong>and</strong>ica<br />
Eulalia viridis<br />
Hesionidae indet.<br />
Ophiodromus flexuosus<br />
Polydora cili<strong>at</strong>a<br />
Pom<strong>at</strong>oceros triqueter<br />
CRUSTACEA Verruca stroemia<br />
Balanus balanus<br />
Balanus sp.<br />
Cancer pagurus<br />
Jassa marmor<strong>at</strong>a<br />
Caprella linearis<br />
CHIRONOMIDAE Telm<strong>at</strong>ogeton japonicus<br />
GASTROPODA Tectura testudinalis<br />
Rissoidae indet.<br />
Crepidula fornic<strong>at</strong>a<br />
Epitonium cl<strong>at</strong>hrus<br />
Onchidoris muric<strong>at</strong>a<br />
Polycera quadriline<strong>at</strong>a<br />
Facelina bostoniensis<br />
BIVALVIA Mytilus edulis<br />
Thracia phaseolina<br />
BRYOZOA Bryozoa indet.<br />
Electra pilosa<br />
Alcyonidium sp.<br />
ECHINODERMATA Asterias rubens<br />
Ophiura albida<br />
Total<br />
A 0.5 NNE<br />
no./m² Kol Sum %<br />
B 02 NNE<br />
no./m² Kol Sum %<br />
Transect<br />
Found<strong>at</strong>ions, horizontal<br />
C 05 NNE<br />
no./m² Kol Sum %<br />
D 05 SSW<br />
no./m² Kol Sum %<br />
13.9 .0% 16.7 .0% 12.5 .0% 11.1 .0%<br />
. . 1.4 .0% 1.4 .0% . .<br />
8.3 .0% 6.9 .0% 1.4 .0% 6.9 .0%<br />
. . 1.4 .0% . . . .<br />
1.4 .0% 2.8 .0% 2.8 .0% 2.8 .0%<br />
33.3 .1% 51.4 .1% 111.1 .2% 69.4 .1%<br />
. . . . . . 1.4 .0%<br />
50.0 .2% 55.6 .1% 56.9 .1% 233.3 .4%<br />
1.4 .0% . . 1.4 .0% 1.4 .0%<br />
. . . . 2.8 .0% 6.9 .0%<br />
30.6 .1% 13.9 .0% 29.2 .1% 33.3 .1%<br />
. . . . . . 1.4 .0%<br />
. . 5.6 .0% 1.4 .0% 4.2 .0%<br />
. . 1.4 .0% 1.4 .0% . .<br />
31.9 .1% 26.4 .0% 16.7 .0% 27.8 .0%<br />
19.4 .1% 26.4 .0% 26.4 .1% 37.5 .1%<br />
. . 4.2 .0% . . . .<br />
. . . . . . 1.4 .0%<br />
2.8 .0% 4.2 .0% 1.4 .0% . .<br />
32430.6 98.5% 53061.1 98.7% 51666.7 98.8% 57158.3 97.7%<br />
83.3 .3% 127.8 .2% 115.3 .2% 429.2 .7%<br />
2.8 .0% . . . . 2.8 .0%<br />
. . . . . . 1.4 .0%<br />
55.6 .2% 168.1 .3% 55.6 .1% 173.6 .3%<br />
2.8 .0% 1.4 .0% 1.4 .0% 11.1 .0%<br />
. . 1.4 .0% . . . .<br />
. . 2.8 .0% 1.4 .0% . .<br />
. . 2.8 .0% 4.2 .0% 8.3 .0%<br />
1.4 .0% 1.4 .0% 6.9 .0% 2.8 .0%<br />
94.4 .3% 122.2 .2% 125.0 .2% 188.9 .3%<br />
. . . . 1.4 .0% . .<br />
2.8 .0% . . . . . .<br />
20.8 .1% 18.1 .0% 19.4 .0% 20.8 .0%<br />
1.4 .0% 1.4 .0% 1.4 .0% . .<br />
20.8 .1% 25.0 .0% 52.8 .1% 59.7 .1%<br />
1.4 .0% . . . . . .<br />
32911.1 100.0% 53751.4 100.0% 52318.1 100.0% 58495.8 100.0%<br />
Autumn<br />
PORIFERA Porifera indet.<br />
HYDROZOA Tubularia indivisa<br />
Hydractinia echin<strong>at</strong>a<br />
Campanulariidae indet.<br />
Sertularia cupressina<br />
ANTHOZOA Alcyonium digit<strong>at</strong>um<br />
Actiniaria indet.<br />
Actinaridae indet.<br />
NEMERTINI Nemertini indet.<br />
NEMATODA Nem<strong>at</strong>oda indet.<br />
POLYCHAETA Harmothoe impar<br />
Phyllodoce groenl<strong>and</strong>ica<br />
Eulalia viridis<br />
Syllidae indet.<br />
Polydora cornuta<br />
Chaetopterus norvegicus<br />
Arenicola marina<br />
Lanice conchilega<br />
Sabellaria spinulosa<br />
Pom<strong>at</strong>oceros triqueter<br />
CRUSTACEA Copepoda indet.<br />
Verruca stroemia<br />
Balanus balanus<br />
Balanus cren<strong>at</strong>us<br />
Cancer pagurus<br />
Liocarcinus depur<strong>at</strong>or<br />
Pisidia longicornis<br />
Pagurus bernhardus<br />
Stenothoe sp.<br />
Jassa marmor<strong>at</strong>a<br />
Atylus swammerdami<br />
Caprella linearis<br />
CHIRONOMIDAE Telm<strong>at</strong>ogeton japonicus<br />
GASTROPODA Rissoidae indet.<br />
Crepidula fornic<strong>at</strong>a<br />
Polinices polianus<br />
Hinia pygmaea<br />
Onchidoris muric<strong>at</strong>a<br />
Polycera quadriline<strong>at</strong>a<br />
Facelina bostoniensis<br />
Aeolidia papillosa<br />
BIVALVIA Mytilus edulis<br />
Angulus tenuis<br />
Moerella pygmaea<br />
Hi<strong>at</strong>ella arctica<br />
Thracia phaseolina<br />
BRYOZOA Bryozoa indet.<br />
Electra pilosa<br />
Alcyonidium sp.<br />
ECHINODERMATA Asterias rubens<br />
Ophiura albida<br />
Strongylocentrotus<br />
droebachiensis<br />
ASCIDIACEA Tunic<strong>at</strong>a indet.<br />
Total<br />
A 0.5 NNE<br />
no./m² Kol Sum %<br />
B 02 NNE<br />
no./m² Kol Sum %<br />
Transect<br />
Found<strong>at</strong>ions, horizontal<br />
C 05 NNE<br />
no./m² Kol Sum %<br />
D 05 SSW<br />
no./m² Kol Sum %<br />
1.4 .0% . . . . . .<br />
22.2 .0% 25.0 .0% 19.4 .0% 13.9 .0%<br />
. . . . 1.4 .0% 13.9 .0%<br />
12.5 .0% 12.5 .0% 11.1 .0% 12.5 .0%<br />
4.2 .0% . . 1.4 .0% 2.8 .0%<br />
8.3 .0% 19.4 .0% 22.2 .0% 31.9 .0%<br />
200.0 .2% 204.2 .3% 163.9 .1% 223.6 .2%<br />
. . . . 12.5 .0% . .<br />
6.9 .0% 36.1 .0% 4.2 .0% 41.7 .0%<br />
208.3 .2% 897.2 1.2% 554.2 .4% 1090.3 .9%<br />
4.2 .0% 1.4 .0% 4.2 .0% 6.9 .0%<br />
8.3 .0% . . . . 1.4 .0%<br />
55.6 .1% 51.4 .1% 36.1 .0% 33.3 .0%<br />
. . . . . . 1.4 .0%<br />
. . . . 1.4 .0% . .<br />
4.2 .0% . . 1.4 .0% 2.8 .0%<br />
. . 1.4 .0% . . . .<br />
. . . . 1.4 .0% 1.4 .0%<br />
. . . . 1.4 .0% . .<br />
20.8 .0% 20.8 .0% 13.9 .0% 13.9 .0%<br />
. . 1.4 .0% 1.4 .0% . .<br />
40.3 .0% 123.6 .2% 118.1 .1% 80.6 .1%<br />
8.3 .0% 6.9 .0% . . 5.6 .0%<br />
. . . . 1.4 .0% 5.6 .0%<br />
343.1 .3% 304.2 .4% 316.7 .2% 208.3 .2%<br />
. . 1.4 .0% 8.3 .0% 1.4 .0%<br />
. . . . 2.8 .0% 1.4 .0%<br />
. . 1.4 .0% . . . .<br />
6.9 .0% . . . . . .<br />
103165.3 96.2% 68754.2 93.1% 123579.2 94.4% 111233.3 94.5%<br />
56.9 .1% 76.4 .1% 77.8 .1% 76.4 .1%<br />
1772.2 1.7% 2023.6 2.7% 4833.3 3.7% 2547.2 2.2%<br />
1.4 .0% . . 1.4 .0% . .<br />
144.4 .1% 91.7 .1% 37.5 .0% 43.1 .0%<br />
23.6 .0% 41.7 .1% 41.7 .0% 16.7 .0%<br />
. . . . . . 1.4 .0%<br />
8.3 .0% 5.6 .0% 8.3 .0% . .<br />
. . . . 5.6 .0% 1.4 .0%<br />
43.1 .0% 18.1 .0% 25.0 .0% 41.7 .0%<br />
27.8 .0% 40.3 .1% 16.7 .0% 13.9 .0%<br />
. . 22.2 .0% 15.3 .0% 9.7 .0%<br />
979.2 .9% 986.1 1.3% 905.6 .7% 1837.5 1.6%<br />
. . 1.4 .0% . . 1.4 .0%<br />
9.7 .0% 9.7 .0% 9.7 .0% 6.9 .0%<br />
1.4 .0% . . 4.2 .0% 2.8 .0%<br />
1.4 .0% . . . . . .<br />
. . . . . . 1.4 .0%<br />
25.0 .0% 23.6 .0% 23.6 .0% 20.8 .0%<br />
6.9 .0% 4.2 .0% 1.4 .0% 2.8 .0%<br />
23.6 .0% 27.8 .0% 22.2 .0% 22.2 .0%<br />
. . . . 4.2 .0% 1.4 .0%<br />
. . 1.4 .0% . . . .<br />
. . . . 4.2 .0% 1.4 .0%<br />
107245.8 100.0% 73836.1 100.0% 130915.3 100.0% 117677.8 100.0%<br />
<strong>Horns</strong> <strong>Rev</strong>. <strong>Benthic</strong> communities Page 115<br />
.
Doc. No. 2572-03-005 rev. 4<br />
8.4.4. Appendix 4.5. Mean biomass WW. Monopiles 2003-2005<br />
2003-Spring<br />
HYDROZOA Tubulariidae indet.<br />
Campanulariidae indet.<br />
ANTHOZOA Anthozoa indet.<br />
Actiniaria indet.<br />
NEMERTINI Nemertini indet.<br />
POLYCHAETA Harmothoe impar<br />
Phyllodoce groenl<strong>and</strong>ica<br />
Eulalia viridis<br />
Capitella capit<strong>at</strong>a<br />
Pom<strong>at</strong>oceros triqueter<br />
CRUSTACEA Verruca stroemia<br />
Balanus balanus<br />
Balanus cren<strong>at</strong>us<br />
Cancer pagurus<br />
Aoridae indet.<br />
Jassa marmor<strong>at</strong>a<br />
Caprella linearis<br />
GASTROPODA Rissoidae indet.<br />
Crepidula fornic<strong>at</strong>a<br />
Nudibranchia indet.<br />
Onchidoris muric<strong>at</strong>a<br />
BIVALVIA Mytilus edulis<br />
BRYOZOA Bryozoa indet.<br />
Electra pilosa<br />
ECHINODERMATA Asterias rubens<br />
Strongylocentrotus<br />
droebachiensis<br />
Total<br />
NNE 02<br />
g/m² Kol Sum %<br />
NNE 04<br />
g/m² Kol Sum %<br />
NNE 06<br />
g/m² Kol Sum %<br />
NNE 08<br />
g/m² Kol Sum %<br />
NNE Bottom<br />
g/m² Kol Sum %<br />
Transect<br />
Turbine tower, vertical<br />
SSW 02<br />
g/m² Kol Sum %<br />
SSW 04<br />
g/m² Kol Sum %<br />
SSW 06<br />
g/m² Kol Sum %<br />
SSW 08<br />
g/m² Kol Sum %<br />
SSW Bottom<br />
g/m² Kol Sum %<br />
. . . . . . . . . . .025 .0% . . . . . . . .<br />
. . . . . . . . . . .019 .0% . . . . . . .007 .0%<br />
. . 2.760 .1% . . . . . . . . . . . . . . 1.235 .1%<br />
. . . . . . . . 6.736 .7% .012 .0% .004 .0% . . . . .073 .0%<br />
16.003 1.3% 2.327 .1% 2.504 .1% .860 .1% . . 3.660 .2% 4.520 .3% 8.773 .4% . . .337 .0%<br />
.465 .0% .548 .0% .474 .0% . . 1.553 .1% .312 .0% .658 .0% .183 .0% . . .650 .1%<br />
.571 .0% .226 .0% .047 .0% . . .158 .0% 1.021 .1% .295 .0% . . . . .129 .0%<br />
.012 .0% .049 .0% . . . . . . . . . . . . . . .114 .0%<br />
.021 .0% .052 .0% .013 .0% . . . . . . .002 .0% .005 .0% . . . .<br />
.356 .0% . . .190 .0% . . .482 .0% .535 .0% .343 .0% . . . . .548 .1%<br />
.052 .0% . . .076 .0% . . .147 .0% .085 .0% . . .063 .0% . . .108 .0%<br />
. . . . 174.242 5.7% 827.259 65.8% . . . . . . 276.446 11.8% 645.328 38.3% . .<br />
722.158 57.1% 3024.561 78.0% 1827.500 60.0% . . 162.188 15.7% 831.235 47.9% 621.063 44.4% 1430.783 61.0% . . 339.675 37.4%<br />
.494 .0% .181 .0% .209 .0% 1.184 .1% . . .657 .0% .039 .0% .741 .0% . . . .<br />
. . . . . . . . . . . . . . .045 .0% . . . .<br />
449.821 35.6% 640.879 16.5% 778.979 25.6% 233.212 18.5% 446.121 43.1% 756.217 43.6% 552.090 39.4% 538.175 22.9% 838.700 49.8% 295.390 32.5%<br />
17.698 1.4% 19.550 .5% 21.791 .7% 4.830 .4% 7.545 .7% 15.150 .9% 16.391 1.2% 6.293 .3% .805 .0% 5.115 .6%<br />
.027 .0% . . . . . . . . . . . . . . . . .011 .0%<br />
2.287 .2% 2.753 .1% . . . . .246 .0% 4.016 .2% .183 .0% . . . . . .<br />
. . .015 .0% . . . . .224 .0% . . .003 .0% . . . . .014 .0%<br />
. . . . . . . . . . . . . . . . . . .089 .0%<br />
53.323 4.2% 146.528 3.8% 161.438 5.3% 22.813 1.8% 14.694 1.4% 91.841 5.3% 203.588 14.5% 82.380 3.5% 199.438 11.8% 50.205 5.5%<br />
. . . . . . . . .006 .0% . . . . . . . . . .<br />
1.686 .1% .837 .0% 13.563 .4% .187 .0% .879 .1% 2.826 .2% 1.074 .1% 1.242 .1% . . 1.017 .1%<br />
. . 36.063 .9% 64.428 2.1% 167.840 13.3% 394.842 38.1% 27.791 1.6% . . . . . . 214.666 23.6%<br />
. . . . . . . . . . . . .003 .0% . . . . . .<br />
1264.974 100.0% 3877.328 100.0% 3045.455 100.0% 1258.186 100.0% 1035.820 100.0% 1735.400 100.0% 1400.255 100.0% 2345.128 100.0% 1684.270 100.0% 909.383 100.0%<br />
<strong>Horns</strong> <strong>Rev</strong>. <strong>Benthic</strong> communities Page 116<br />
.
Doc. No. 2572-03-005 rev. 4<br />
2003-Autumn<br />
HYDROZOA Tubularia indivisa<br />
Campanulariidae indet.<br />
ANTHOZOA Actiniaria indet.<br />
NEMERTINI Nemertini indet.<br />
NEMATODA Nem<strong>at</strong>oda indet.<br />
POLYCHAETA Harmothoe imbric<strong>at</strong>a<br />
Harmothoe impar<br />
Phyllodoce groenl<strong>and</strong>ica<br />
Eulalia viridis<br />
Nereididae indet.<br />
Nereis pelagica<br />
Neanthes virens<br />
Capitella capit<strong>at</strong>a<br />
Pom<strong>at</strong>oceros triqueter<br />
PYCNOGONIDA Phoxichilidium femor<strong>at</strong>um<br />
CRUSTACEA Verruca stroemia<br />
Balanus balanus<br />
Balanus cren<strong>at</strong>us<br />
Caridea indet.<br />
Corystes cassivelaunus<br />
Cancer pagurus<br />
Corophium crassicorne<br />
Jassa marmor<strong>at</strong>a<br />
Caprella linearis<br />
CHIRONOMIDAE Telm<strong>at</strong>ogeton japonicus<br />
GASTROPODA Rissoidae indet.<br />
Crepidula fornic<strong>at</strong>a<br />
Nudibranchia indet.<br />
Onchidoris muric<strong>at</strong>a<br />
BIVALVIA Mytilus edulis<br />
Ostrea edulis<br />
Heteranomia squamula<br />
Moerella pygmaea<br />
Venerupis senegalensis<br />
Hi<strong>at</strong>ella arctica<br />
BRYOZOA Bryozoa indet.<br />
Electra pilosa<br />
ECHINODERMATA Asterias rubens<br />
Strongylocentrotus<br />
droebachiensis<br />
Total<br />
NNE 02<br />
g/m² Kol Sum %<br />
NNE 04<br />
g/m² Kol Sum %<br />
NNE 06<br />
g/m² Kol Sum %<br />
NNE 08<br />
g/m² Kol Sum %<br />
NNE Bottom<br />
g/m² Kol Sum %<br />
Transect<br />
Turbine tower, vertical<br />
SSW 02<br />
g/m² Kol Sum %<br />
SSW 04<br />
g/m² Kol Sum %<br />
SSW 06<br />
g/m² Kol Sum %<br />
SSW 08<br />
g/m² Kol Sum %<br />
SSW Bottom<br />
g/m² Kol Sum %<br />
121.527 27.3% 16.653 5.6% 21.135 .2% . . 9.936 2.6% 17.930 8.3% 63.777 28.0% 25.388 .5% 2.137 .0% 6.482 .5%<br />
.760 .2% .061 .0% .106 .0% . . .697 .2% .108 .0% .333 .1% .042 .0% .182 .0% .064 .0%<br />
58.962 13.2% 34.448 11.6% 23.799 .3% . . .005 .0% 48.729 22.6% 7.315 3.2% 5.960 .1% 4.720 .1% 24.718 2.1%<br />
.015 .0% . . 11.341 .1% 42.138 .9% .037 .0% .801 .4% .355 .2% 9.412 .2% 8.729 .1% .009 .0%<br />
. . .013 .0% . . . . . . .219 .1% . . .002 .0% . . . .<br />
. . . . 1.080 .0% . . . . . . . . 2.935 .1% . . . .<br />
. . . . .836 .0% . . . . . . . . .442 .0% .230 .0% . .<br />
. . .029 .0% .173 .0% .023 .0% .016 .0% .011 .0% .042 .0% .188 .0% .283 .0% .103 .0%<br />
.419 .1% . . . . . . .001 .0% .008 .0% .002 .0% .475 .0% .006 .0% .008 .0%<br />
. . . . .034 .0% .748 .0% . . . . . . .232 .0% . . . .<br />
. . . . . . . . . . . . .008 .0% . . .562 .0% . .<br />
. . . . .391 .0% .884 .0% . . . . . . .087 .0% .453 .0% . .<br />
. . . . .007 .0% . . . . . . .002 .0% . . . . .140 .0%<br />
2.965 .7% 1.360 .5% .408 .0% . . 3.969 1.0% 1.110 .5% 2.342 1.0% 2.221 .0% .045 .0% 3.420 .3%<br />
. . . . . . . . . . . . .001 .0% . . . . . .<br />
. . . . .040 .0% . . . . .051 .0% .030 .0% . . . . .083 .0%<br />
. . . . 1.431 .0% 1229.006 25.0% . . . . . . 1.848 .0% 403.500 4.4% . .<br />
.238 .1% .450 .2% . . . . .027 .0% 2.060 1.0% .173 .1% 1.845 .0% . . .400 .0%<br />
. . . . . . . . .003 .0% . . . . . . . . . .<br />
. . . . . . . . . . . . . . . . . . .008 .0%<br />
.420 .1% .057 .0% .850 .0% .595 .0% .016 .0% .444 .2% .370 .2% 1.438 .0% .285 .0% .307 .0%<br />
. . . . .002 .0% . . . . . . . . . . . . . .<br />
101.173 22.7% 106.318 35.8% 182.488 2.1% 298.591 6.1% 65.744 17.2% 65.822 30.5% 87.678 38.6% 232.053 4.4% 288.960 3.2% 42.563 3.6%<br />
21.983 4.9% 53.172 17.9% 62.299 .7% .108 .0% 36.317 9.5% 11.108 5.1% 15.909 7.0% 81.303 1.5% 15.243 .2% 4.945 .4%<br />
. . .025 .0% .022 .0% 2.820 .1% .014 .0% .280 .1% . . . . .085 .0% . .<br />
.124 .0% .004 .0% .040 .0% .004 .0% .017 .0% .023 .0% .014 .0% .326 .0% .156 .0% .018 .0%<br />
16.698 3.8% 13.438 4.5% .078 .0% . . 5.790 1.5% 23.626 10.9% 5.388 2.4% 4.131 .1% 5.180 .1% .404 .0%<br />
.140 .0% .059 .0% .033 .0% . . .054 .0% .061 .0% .007 .0% . . . . .078 .0%<br />
. . . . .021 .0% . . .041 .0% . . .017 .0% .007 .0% . . .020 .0%<br />
.998 .2% .262 .1% 8335.253 96.0% 3344.036 68.0% .042 .0% 14.250 6.6% .537 .2% 4867.761 91.5% 8335.884 91.7% .233 .0%<br />
. . . . . . . . . . . . . . .806 .0% . . . .<br />
. . .130 .0% .034 .0% . . . . . . .041 .0% . . . . . .<br />
. . . . . . . . . . . . . . .008 .0% . . . .<br />
. . . . . . . . . . . . . . .180 .0% . . . .<br />
.018 .0% .021 .0% . . . . . . . . .015 .0% .017 .0% .005 .0% . .<br />
2.027 .5% .957 .3% . . . . .044 .0% . . .224 .1% . . . . . .<br />
37.250 8.4% 38.389 12.9% 24.744 .3% .071 .0% 12.735 3.3% 1.286 .6% 27.843 12.2% 42.506 .8% 12.808 .1% 24.192 2.0%<br />
79.313 17.8% 31.112 10.5% 20.232 .2% . . 246.060 64.5% 27.949 12.9% 14.967 6.6% 38.652 .7% 6.792 .1% 1082.390 90.9%<br />
. . .010 .0% . . . . . . . . . . .472 .0% . . .007 .0%<br />
445.027 100.0% 296.967 100.0% 8686.874 100.0% 4919.025 100.0% 381.566 100.0% 215.876 100.0% 227.390 100.0% 5320.736 100.0% 9086.243 100.0% 1190.592 100.0%<br />
<strong>Horns</strong> <strong>Rev</strong>. <strong>Benthic</strong> communities Page 117<br />
.
Doc. No. 2572-03-005 rev. 4<br />
2004-Spring<br />
HYDROZOA Tubularia indivisa<br />
Campanulariidae indet.<br />
ANTHOZOA Actiniaria indet.<br />
NEMERTINI Nemertini indet.<br />
NEMATODA Nem<strong>at</strong>oda indet.<br />
POLYCHAETA Harmothoe imbric<strong>at</strong>a<br />
Harmothoe impar<br />
Phyllodoce groenl<strong>and</strong>ica<br />
Eulalia viridis<br />
Syllidae indet.<br />
Nereis pelagica<br />
Neanthes virens<br />
Pom<strong>at</strong>oceros triqueter<br />
CRUSTACEA Verruca stroemia<br />
Balanus balanus<br />
Balanus cren<strong>at</strong>us<br />
Brachyura indet.<br />
Cancer pagurus<br />
Pisidia longicornis<br />
Jassa marmor<strong>at</strong>a<br />
Caprella linearis<br />
CHIRONOMIDAE Chironomidae indet.<br />
Telm<strong>at</strong>ogeton japonicus<br />
GASTROPODA Rissoidae indet.<br />
Crepidula fornic<strong>at</strong>a<br />
Nudibranchia indet.<br />
Onchidoris muric<strong>at</strong>a<br />
Polycera quadriline<strong>at</strong>a<br />
Aeolidia papillosa<br />
BIVALVIA<br />
Mytilus edulis<br />
Ostrea edulis<br />
Heteranomia squamula<br />
Hi<strong>at</strong>ella arctica<br />
BRYOZOA Electra pilosa<br />
Alcyonidium sp.<br />
ECHINODERMATA Asterias rubens<br />
Strongylocentrotus<br />
droebachiensis<br />
Total<br />
NNE 02<br />
g/m² Kol Sum %<br />
NNE 04<br />
g/m² Kol Sum %<br />
NNE 06<br />
g/m² Kol Sum %<br />
NNE 08<br />
g/m² Kol Sum %<br />
NNE Bottom<br />
g/m² Kol Sum %<br />
Transect<br />
Turbine tower, vertical<br />
SSW 02<br />
g/m² Kol Sum %<br />
SSW 04<br />
g/m² Kol Sum %<br />
SSW 06<br />
g/m² Kol Sum %<br />
SSW 08<br />
g/m² Kol Sum %<br />
SSW Bottom<br />
g/m² Kol Sum %<br />
. . . . . . . . . . . . .011 .0% . . . . .725 .2%<br />
. . .006 .0% . . . . .147 .1% . . .003 .0% . . . . . .<br />
6.165 1.1% 17.056 2.4% 19.213 .2% . . 12.773 4.8% 16.472 1.5% 5.494 .9% 10.344 .1% . . 5.669 1.6%<br />
.050 .0% .185 .0% 15.806 .2% 1.448 .0% .055 .0% .127 .0% .047 .0% 4.115 .0% 3.270 .1% .100 .0%<br />
. . . . . . . . . . .005 .0% . . . . . . . .<br />
. . . . . . . . . . . . . . 1.565 .0% . . . .<br />
.015 .0% .018 .0% 2.929 .0% .216 .0% .010 .0% .121 .0% .013 .0% .214 .0% .202 .0% . .<br />
. . .197 .0% .073 .0% .369 .0% . . .110 .0% .328 .1% . . .101 .0% . .<br />
.206 .0% . . .183 .0% .331 .0% . . .027 .0% .122 .0% . . .295 .0% .023 .0%<br />
. . . . . . . . . . .018 .0% . . . . . . .008 .0%<br />
. . . . 7.695 .1% . . . . . . . . . . . . . .<br />
. . . . . . .372 .0% . . . . . . . . . . . .<br />
4.004 .7% 2.246 .3% .007 .0% . . 3.785 1.4% 7.047 .6% 5.063 .8% .580 .0% . . 1.865 .5%<br />
. . . . .120 .0% . . . . . . .100 .0% . . . . . .<br />
. . . . . . 78.429 .8% . . . . . . .683 .0% 49.984 .8% . .<br />
2.180 .4% 3.203 .5% 3.475 .0% . . .046 .0% 1.786 .2% 6.839 1.1% 4.818 .0% . . .028 .0%<br />
. . . . .803 .0% . . . . . . . . . . . . . .<br />
.036 .0% .132 .0% 11.735 .1% . . . . . . .038 .0% 8.301 .1% 1.007 .0% . .<br />
. . . . .293 .0% . . . . . . . . . . . . . .<br />
417.598 73.6% 530.581 75.0% 307.335 3.2% 71.042 .8% 155.147 57.9% 898.530 79.5% 532.073 84.9% 551.103 4.5% 70.042 1.1% 207.605 58.9%<br />
76.515 13.5% 32.743 4.6% 101.426 1.1% 1.688 .0% 13.720 5.1% 43.493 3.8% 26.505 4.2% 13.330 .1% .428 .0% 45.824 13.0%<br />
. . . . . . .013 .0% . . . . . . . . .010 .0% . .<br />
. . . . . . 4.904 .1% . . . . . . . . 8.432 .1% . .<br />
. . . . . . .012 .0% .008 .0% .009 .0% . . . . .005 .0% . .<br />
13.920 2.5% 28.114 4.0% . . . . 9.432 3.5% 105.176 9.3% 36.683 5.9% 11.324 .1% . . 8.607 2.4%<br />
.214 .0% .250 .0% .009 .0% . . . . . . .273 .0% .057 .0% . . .019 .0%<br />
1.824 .3% .724 .1% .128 .0% . . .094 .0% .213 .0% .007 .0% . . . . . .<br />
.230 .0% .131 .0% .087 .0% . . .030 .0% .666 .1% .156 .0% .012 .0% . . .067 .0%<br />
.205 .0% 5.992 .8% .097 .0% . . .149 .1% .374 .0% .504 .1% .302 .0% . . . .<br />
.081 .0% 1.473 .2% 9033.851 94.8% 9118.379 98.3% .100 .0% .575 .1% 1.366 .2% 11503.015 94.8% 6070.800 97.8% .210 .1%<br />
. . . . .803 .0% . . . . . . . . . . . . . .<br />
.181 .0% .635 .1% . . . . . . . . .287 .0% . . . . . .<br />
.043 .0% . . .173 .0% .052 .0% . . .040 .0% .019 .0% .024 .0% .055 .0% . .<br />
11.895 2.1% 29.016 4.1% 18.971 .2% .008 .0% 10.032 3.7% 45.049 4.0% 4.379 .7% 18.397 .2% .694 .0% 1.515 .4%<br />
3.946 .7% .665 .1% .678 .0% . . 7.183 2.7% 2.633 .2% . . . . . . 12.375 3.5%<br />
28.108 5.0% 53.712 7.6% . . . . 55.226 20.6% 7.953 .7% 6.727 1.1% . . . . 67.693 19.2%<br />
. . . . .070 .0% . . . . . . . . .398 .0% . . . .<br />
567.416 100.0% 707.078 100.0% 9525.958 100.0% 9277.261 100.0% 267.938 100.0% 1130.424 100.0% 627.032 100.0% 12128.582 100.0% 6205.323 100.0% 352.334 100.0%<br />
<strong>Horns</strong> <strong>Rev</strong>. <strong>Benthic</strong> communities Page 118<br />
.
Doc. No. 2572-03-005 rev. 4<br />
2004-Autumn<br />
HYDROZOA Tubularia indivisa<br />
Hydractinia echin<strong>at</strong>a<br />
Campanulariidae indet.<br />
ANTHOZOA Actiniaria indet.<br />
NEMERTINI Nemertini indet.<br />
NEMATODA Nem<strong>at</strong>oda indet.<br />
POLYCHAETA Harmothoe imbric<strong>at</strong>a<br />
Harmothoe impar<br />
Phyllodoce groenl<strong>and</strong>ica<br />
Eulalia viridis<br />
Ophiodromus flexuosus<br />
Nereis pelagica<br />
Cirr<strong>at</strong>ulidae indet.<br />
Terebellidae indet.<br />
Pom<strong>at</strong>oceros triqueter<br />
CRUSTACEA Verruca stroemia<br />
Balanus balanus<br />
Balanus cren<strong>at</strong>us<br />
Cancer pagurus<br />
Jassa marmor<strong>at</strong>a<br />
Caprella linearis<br />
CHIRONOMIDAE Telm<strong>at</strong>ogeton japonicus<br />
GASTROPODA Rissoidae indet.<br />
Crepidula fornic<strong>at</strong>a<br />
Hinia pygmaea<br />
Nudibranchia indet.<br />
Onchidoris muric<strong>at</strong>a<br />
Polycera quadriline<strong>at</strong>a<br />
Aeolidia papillosa<br />
BIVALVIA Mytilus edulis<br />
Modiolarca tumida<br />
Heteranomia squamula<br />
Thracia phaseolina<br />
BRYOZOA Bryozoa indet.<br />
Electra pilosa<br />
Alcyonidium sp.<br />
ECHINODERMATA Asterias rubens<br />
Ophiura albida<br />
Strongylocentrotus<br />
droebachiensis<br />
Total<br />
NNE 02<br />
g/m² Kol Sum %<br />
NNE 04<br />
g/m² Kol Sum %<br />
NNE 06<br />
g/m² Kol Sum %<br />
NNE 08<br />
g/m² Kol Sum %<br />
NNE 10<br />
g/m² Kol Sum %<br />
NNE Bottom<br />
g/m² Kol Sum %<br />
Transect<br />
Turbine tower, vertical<br />
SSW 02<br />
g/m² Kol Sum %<br />
SSW 04<br />
g/m² Kol Sum %<br />
SSW 06<br />
g/m² Kol Sum %<br />
SSW 08<br />
g/m² Kol Sum %<br />
SSW 10<br />
g/m² Kol Sum %<br />
SSW Bottom<br />
g/m² Kol Sum %<br />
.041 .0% .527 .1% .819 .1% . . . . .526 .1% 1.307 .2% .145 .0% .060 .0% .010 .0% . . .348 .1%<br />
. . .370 .1% .180 .0% . . . . .095 .0% . . . . . . . . . . . .<br />
.062 .0% .042 .0% .013 .0% . . . . .063 .0% .006 .0% . . .031 .0% . . . . .043 .0%<br />
5.772 1.0% 3.167 .5% 37.181 2.8% 21.416 .2% . . .759 .1% 7.358 1.1% .196 .0% 16.547 .1% . . . . 1.600 .3%<br />
. . . . . . .175 .0% . . . . . . . . 1.610 .0% 3.326 .1% . . . .<br />
.015 .0% .002 .0% .004 .0% . . . . .012 .0% .009 .0% .006 .0% .012 .0% . . . . .003 .0%<br />
. . . . . . . . . . . . . . . . 3.436 .0% . . . . . .<br />
.010 .0% .095 .0% .064 .0% . . . . .027 .0% .036 .0% . . 1.478 .0% . . . . . .<br />
. . . . .026 .0% . . . . . . .006 .0% . . .054 .0% . . . . . .<br />
.341 .1% .208 .0% .213 .0% .105 .0% . . .292 .0% .126 .0% .625 .1% .452 .0% .056 .0% . . .235 .0%<br />
. . . . . . . . . . . . . . . . .007 .0% . . . . . .<br />
. . . . . . .422 .0% . . . . . . . . . . .118 .0% . . . .<br />
.000 .0% . . . . .002 .0% . . . . . . .007 .0% . . .003 .0% . . .000 .0%<br />
. . . . . . . . . . .013 .0% . . . . . . . . . . . .<br />
2.511 .4% 1.713 .3% .471 .0% . . . . 3.043 .5% 2.662 .4% 3.020 .5% .667 .0% . . . . 3.015 .6%<br />
.064 .0% . . . . . . . . . . . . . . . . . . . . .021 .0%<br />
. . . . 73.143 5.5% 106.738 1.1% 373.678 97.5% . . 90.407 13.5% . . .009 .0% 34.463 .6% 643.368 60.6% 14.254 2.6%<br />
1.040 .2% .295 .1% .232 .0% . . . . .025 .0% .621 .1% .815 .1% 1.010 .0% . . . . .081 .0%<br />
2.710 .5% 5.451 .9% 9.117 .7% 8.089 .1% . . 10.329 1.6% 4.359 .7% 4.823 .7% 10.740 .1% 4.805 .1% . . 7.340 1.3%<br />
333.247 59.6% 306.401 52.7% 769.336 58.1% 410.862 4.3% 6.194 1.6% 423.737 63.7% 291.334 43.5% 388.019 60.2% 436.709 3.7% 417.348 7.0% 411.700 38.7% 339.778 62.2%<br />
161.965 29.0% 119.938 20.6% 86.020 6.5% 63.945 .7% .083 .0% 76.624 11.5% 81.251 12.1% 93.085 14.4% 120.829 1.0% 72.985 1.2% .015 .0% 26.786 4.9%<br />
.293 .1% .143 .0% .003 .0% .994 .0% 3.391 .9% .495 .1% . . . . .005 .0% 2.170 .0% 7.381 .7% .009 .0%<br />
.012 .0% .041 .0% .166 .0% .385 .0% . . .069 .0% .077 .0% .089 .0% .195 .0% .351 .0% . . .100 .0%<br />
23.038 4.1% 114.809 19.7% .005 .0% 97.531 1.0% . . .033 .0% 130.174 19.4% 108.071 16.8% 26.125 .2% .030 .0% . . 10.755 2.0%<br />
. . . . . . .006 .0% . . . . . . . . . . . . . . . .<br />
. . . . . . . . . . . . . . .294 .0% . . . . . . . .<br />
.019 .0% .006 .0% .021 .0% . . . . .007 .0% .021 .0% .018 .0% . . . . . . .012 .0%<br />
.755 .1% 1.327 .2% 1.491 .1% .375 .0% . . .205 .0% .304 .0% 1.132 .2% .625 .0% .150 .0% . . .171 .0%<br />
.344 .1% 1.032 .2% .325 .0% 1.287 .0% . . .339 .1% .202 .0% .975 .2% 2.011 .0% .050 .0% . . . .<br />
1.145 .2% .190 .0% 314.058 23.7% 8743.565 92.4% .010 .0% .138 .0% .246 .0% .776 .1% 11246.523 94.7% 5411.395 90.9% . . .239 .0%<br />
. . . . . . .014 .0% . . .019 .0% . . . . . . .004 .0% . . . .<br />
. . . . .031 .0% . . . . . . . . . . . . . . . . . .<br />
. . . . . . .152 .0% . . . . . . . . . . . . . . . .<br />
. . . . . . .145 .0% . . . . . . . . . . . . . . . .<br />
3.331 .6% 5.825 1.0% 13.138 1.0% 1.248 .0% . . 7.370 1.1% 6.265 .9% 6.542 1.0% 3.860 .0% 3.493 .1% . . 1.992 .4%<br />
.967 .2% 3.035 .5% 2.420 .2% . . . . .518 .1% 18.778 2.8% .399 .1% .014 .0% .167 .0% . . 1.467 .3%<br />
21.532 3.9% 16.949 2.9% 16.149 1.2% 5.523 .1% . . 140.033 21.1% 33.895 5.1% 35.541 5.5% 7.020 .1% .665 .0% . . 138.406 25.3%<br />
. . .006 .0% . . . . . . .003 .0% . . . . . . . . . . .004 .0%<br />
. . . . .114 .0% . . . . . . . . .234 .0% . . . . . . . .<br />
559.214 100.0% 581.573 100.0% 1324.740 100.0% 9462.980 100.0% 383.355 100.0% 664.771 100.0% 669.443 100.0% 644.814 100.0% 11880.028 100.0% 5951.591 100.0% 1062.464 100.0% 546.658 100.0%<br />
<strong>Horns</strong> <strong>Rev</strong>. <strong>Benthic</strong> communities Page 119<br />
.
Doc. No. 2572-03-005 rev. 4<br />
2005-Spring<br />
HYDROZOA Tubularia indivisa<br />
Hydractinia echin<strong>at</strong>a<br />
Campanulariidae indet.<br />
ANTHOZOA Actiniaria indet.<br />
NEMERTINI Nemertini indet.<br />
NEMATODA Nem<strong>at</strong>oda indet.<br />
POLYCHAETA Lepidonotus squam<strong>at</strong>us<br />
Harmothoe imbric<strong>at</strong>a<br />
Harmothoe impar<br />
Eulalia viridis<br />
Hesionidae indet.<br />
Ophiodromus flexuosus<br />
Syllidae indet.<br />
Chaetopterus norvegicus<br />
Pom<strong>at</strong>oceros triqueter<br />
CRUSTACEA Verruca stroemia<br />
Balanus balanus<br />
Balanus cren<strong>at</strong>us<br />
Cancer pagurus<br />
Pisidia longicornis<br />
Jassa marmor<strong>at</strong>a<br />
Atylus swammerdami<br />
Caprella linearis<br />
CHIRONOMIDAE Telm<strong>at</strong>ogeton japonicus<br />
GASTROPODA Tectura testudinalis<br />
Rissoidae indet.<br />
Crepidula fornic<strong>at</strong>a<br />
Polinices polianus<br />
Onchidoris muric<strong>at</strong>a<br />
Polycera quadriline<strong>at</strong>a<br />
Facelina bostoniensis<br />
Aeolidia papillosa<br />
BIVALVIA Mytilus edulis<br />
Heteranomia squamula<br />
Hi<strong>at</strong>ella arctica<br />
BRYOZOA Bryozoa indet.<br />
Electra pilosa<br />
Alcyonidium sp.<br />
ECHINODERMATA Asterias rubens<br />
Strongylocentrotus<br />
droebachiensis<br />
Total<br />
NNE 02<br />
g/m² Kol Sum %<br />
NNE 04<br />
g/m² Kol Sum %<br />
NNE 06<br />
g/m² Kol Sum %<br />
NNE 08<br />
g/m² Kol Sum %<br />
NNE 10<br />
g/m² Kol Sum %<br />
NNE Bottom<br />
g/m² Kol Sum %<br />
Transect<br />
Turbine tower, vertical<br />
SSW 02<br />
g/m² Kol Sum %<br />
SSW 04<br />
g/m² Kol Sum %<br />
SSW 06<br />
g/m² Kol Sum %<br />
SSW 08<br />
g/m² Kol Sum %<br />
SSW 10<br />
g/m² Kol Sum %<br />
SSW Bottom<br />
g/m² Kol Sum %<br />
1.994 .5% .335 .1% .839 .0% . . . . 1.366 .5% .171 .0% .397 .1% .136 .0% . . . . 1.806 1.1%<br />
.180 .0% .407 .1% . . . . . . . . .001 .0% .915 .3% . . . . . . .419 .3%<br />
. . . . .125 .0% . . . . . . .002 .0% . . .043 .0% .043 .0% . . .851 .5%<br />
.951 .2% 40.472 13.2% 22.680 .1% . . . . 1.697 .6% 1.506 .4% .719 .2% .077 .0% . . . . 61.583 39.0%<br />
. . .003 .0% 3.998 .0% . . . . . . . . . . .428 .0% . . . . . .<br />
.030 .0% .014 .0% .368 .0% .026 .1% .003 .0% .012 .0% .027 .0% .172 .1% .040 .0% .005 .0% . . .015 .0%<br />
. . . . 4.949 .0% . . . . . . . . . . . . . . . . . .<br />
. . . . 8.260 .1% . . . . . . . . . . 4.161 .0% . . . . . .<br />
. . . . .061 .0% . . . . . . . . . . 1.727 .0% . . . . . .<br />
.900 .2% .584 .2% 2.985 .0% . . . . 1.424 .5% 2.298 .6% 1.901 .6% .500 .0% .003 .0% . . .706 .4%<br />
. . .025 .0% . . . . . . . . . . . . . . . . . . . .<br />
.069 .0% . . . . . . . . .021 .0% . . . . . . . . . . . .<br />
. . . . .012 .0% . . . . . . . . . . . . . . . . . .<br />
.017 .0% . . . . . . . . . . . . . . . . . . . . . .<br />
1.743 .4% .945 .3% .672 .0% . . . . 1.930 .7% 5.103 1.4% 3.843 1.2% 3.598 .0% . . . . 1.036 .7%<br />
. . .048 .0% . . . . . . .180 .1% . . .035 .0% .011 .0% .006 .0% . . . .<br />
9.074 2.2% .055 .0% 1.763 .0% . . . . . . . . 44.498 13.9% . . 15.738 .2% . . . .<br />
. . .278 .1% .095 .0% . . . . .027 .0% . . . . . . . . . . . .<br />
1.391 .3% .532 .2% 29.154 .2% . . . . . . .743 .2% . . 34.985 .2% .827 .0% . . . .<br />
. . . . .544 .0% . . . . . . . . . . .053 .0% . . . . . .<br />
60.635 14.8% 63.083 20.6% 47.948 .3% 22.736 56.3% .035 .2% 50.692 17.7% 59.421 16.2% 52.659 16.5% 57.004 .4% 15.390 .2% .089 .3% 32.119 20.3%<br />
. . . . . . . . . . .020 .0% . . . . . . . . . . . .<br />
41.031 10.0% 24.277 7.9% 11.840 .1% .006 .0% . . 5.803 2.0% 24.638 6.7% 29.057 9.1% 8.921 .1% .138 .0% . . 2.089 1.3%<br />
. . . . .011 .0% 7.028 17.4% 18.389 99.8% .032 .0% . . . . .020 .0% 8.378 .1% 25.634 99.7% . .<br />
. . . . . . . . . . . . . . .058 .0% . . . . . . .004 .0%<br />
. . . . .183 .0% . . . . .012 .0% . . . . .058 .0% .016 .0% . . .060 .0%<br />
187.998 45.8% 153.344 50.1% 11.215 .1% 7.034 17.4% . . . . 231.547 63.1% 162.205 50.7% 39.175 .2% . . . . .011 .0%<br />
. . . . . . .009 .0% . . . . . . . . . . . . . . . .<br />
.234 .1% 1.218 .4% 1.138 .0% . . . . .439 .2% .203 .1% . . 1.158 .0% . . . . .191 .1%<br />
. . . . .178 .0% . . . . . . . . .085 .0% . . . . . . . .<br />
. . . . .034 .0% . . . . .013 .0% . . .028 .0% .027 .0% .012 .0% . . .014 .0%<br />
. . . . . . . . . . . . .055 .0% . . .009 .0% . . . . . .<br />
.313 .1% .676 .2% 15604.052 98.8% 1.484 3.7% . . .348 .1% .229 .1% .403 .1% 15785.122 98.9% 6759.733 99.4% . . .097 .1%<br />
. . . . . . . . . . .278 .1% . . . . . . . . . . . .<br />
. . . . .957 .0% . . . . . . . . . . . . . . . . . .<br />
. . . . . . . . . . . . . . . . . . . . . . .060 .0%<br />
1.020 .2% .297 .1% 1.147 .0% .127 .3% . . .685 .2% 3.748 1.0% 4.415 1.4% 1.615 .0% .139 .0% . . .130 .1%<br />
87.967 21.4% 1.390 .5% 3.713 .0% . . . . 1.033 .4% 35.089 9.6% 9.911 3.1% 1.178 .0% . . . . 10.078 6.4%<br />
14.735 3.6% 17.820 5.8% 42.333 .3% 1.912 4.7% . . 220.610 77.0% 1.928 .5% 8.620 2.7% 21.319 .1% . . . . 46.631 29.5%<br />
. . . . . . . . . . . . . . . . 3.586 .0% . . . . . .<br />
410.280 100.0% 305.803 100.0% 15801.253 100.0% 40.361 100.0% 18.426 100.0% 286.618 100.0% 366.709 100.0% 319.922 100.0% 15964.949 100.0% 6800.427 100.0% 25.723 100.0% 157.900 100.0%<br />
<strong>Horns</strong> <strong>Rev</strong>. <strong>Benthic</strong> communities Page 120<br />
.
Doc. No. 2572-03-005 rev. 4<br />
2005-Autumn<br />
PORIFERA Porifera indet.<br />
Halichondria panicea<br />
HYDROZOA Tubularia indivisa<br />
Hydractinia echin<strong>at</strong>a<br />
Campanulariidae indet.<br />
Sertularia cupressina<br />
ANTHOZOA Alcyonium digit<strong>at</strong>um<br />
Actiniaria indet.<br />
NEMERTINI Nemertini indet.<br />
NEMATODA Nem<strong>at</strong>oda indet.<br />
POLYCHAETA Lepidonotus squam<strong>at</strong>us<br />
Harmothoe imbric<strong>at</strong>a<br />
Harmothoe impar<br />
Phyllodoce groenl<strong>and</strong>ica<br />
Eulalia viridis<br />
Polydora cornuta<br />
Chaetopterus norvegicus<br />
Pom<strong>at</strong>oceros triqueter<br />
CRUSTACEA Harpacticoida indet.<br />
Verruca stroemia<br />
Balanus balanus<br />
Cancer pagurus<br />
Pilumnus hirtellus<br />
Pisidia longicornis<br />
Stenothoe sp.<br />
Jassa marmor<strong>at</strong>a<br />
Atylus swammerdami<br />
Caprella linearis<br />
CHIRONOMIDAE Telm<strong>at</strong>ogeton japonicus<br />
GASTROPODA Rissoidae indet.<br />
Crepidula fornic<strong>at</strong>a<br />
Polinices polianus<br />
Nudibranchia indet.<br />
Onchidoris muric<strong>at</strong>a<br />
Polycera quadriline<strong>at</strong>a<br />
Facelina bostoniensis<br />
Aeolidia papillosa<br />
BIVALVIA Mytilus edulis<br />
Tridonta borealis<br />
Angulus tenuis<br />
Fabulina fabula<br />
Moerella pygmaea<br />
Donax vitt<strong>at</strong>us<br />
Hi<strong>at</strong>ella arctica<br />
Phaxas pellucidus<br />
BRYOZOA Electra pilosa<br />
Alcyonidium sp.<br />
ECHINODERMATA Asterias rubens<br />
Strongylocentrotus<br />
droebachiensis<br />
Total<br />
NNE 02<br />
g/m² Kol Sum %<br />
NNE 04<br />
g/m² Kol Sum %<br />
NNE 06<br />
g/m² Kol Sum %<br />
NNE 08<br />
g/m² Kol Sum %<br />
NNE Bottom<br />
g/m² Kol Sum %<br />
Transect<br />
Turbine tower, vertical<br />
SSW 02<br />
g/m² Kol Sum %<br />
SSW 04<br />
g/m² Kol Sum %<br />
SSW 06<br />
g/m² Kol Sum %<br />
SSW 08<br />
g/m² Kol Sum %<br />
SSW Bottom<br />
g/m² Kol Sum %<br />
. . .006 .0% . . . . . . . . . . . . . . . .<br />
. . . . . . . . 1.002 .1% . . . . . . . . . .<br />
6.127 .8% 6.307 .7% 1.769 .0% .306 .0% .838 .1% .954 .1% 8.294 .9% 5.063 .0% 1.480 .0% 1.310 .2%<br />
.398 .1% .259 .0% . . . . .345 .0% .020 .0% .152 .0% . . . . 2.300 .3%<br />
.102 .0% .116 .0% .062 .0% . . .047 .0% .448 .0% .235 .0% . . . . .076 .0%<br />
. . . . . . . . .040 .0% . . . . . . . . . .<br />
. . . . . . . . . . . . . . . . . . .321 .0%<br />
44.017 5.6% 213.790 22.6% 32.782 .2% .338 .0% 12.392 1.6% 98.267 7.2% 16.914 1.9% 54.258 .2% 1.819 .0% 22.368 2.9%<br />
.131 .0% .163 .0% 14.752 .1% 45.985 .4% .011 .0% .085 .0% .253 .0% .711 .0% 7.071 .0% .005 .0%<br />
.015 .0% .121 .0% .059 .0% .280 .0% .034 .0% .025 .0% .018 .0% .036 .0% .022 .0% .057 .0%<br />
. . . . . . . . . . . . . . 2.785 .0% . . . .<br />
. . . . . . . . . . . . . . .755 .0% . . . .<br />
.050 .0% .003 .0% .600 .0% .124 .0% .035 .0% .011 .0% .012 .0% .532 .0% .111 .0% .073 .0%<br />
. . . . .005 .0% . . . . . . . . . . . . . .<br />
.696 .1% 1.873 .2% 4.755 .0% 1.153 .0% 1.173 .2% 2.218 .2% 1.411 .2% 3.021 .0% .693 .0% 1.258 .2%<br />
. . . . . . . . . . .006 .0% . . . . . . . .<br />
. . . . . . . . . . .020 .0% . . .012 .0% . . .030 .0%<br />
.469 .1% .018 .0% . . . . 3.522 .5% 2.438 .2% .410 .0% .271 .0% . . 1.506 .2%<br />
. . . . . . . . .022 .0% . . . . . . . . . .<br />
.434 .1% .629 .1% 1.948 .0% . . .807 .1% .347 .0% .485 .1% .091 .0% . . .643 .1%<br />
3.947 .5% 2.133 .2% 804.978 5.8% 1413.793 11.4% 1.016 .1% 110.592 8.1% 47.449 5.3% 15.573 .1% .035 .0% 1.006 .1%<br />
1.608 .2% 2.571 .3% 17.716 .1% 3.195 .0% 1.715 .2% 2.052 .2% 1.641 .2% 2438.138 10.8% 1.758 .0% 5.094 .7%<br />
. . . . 2.800 .0% . . . . . . . . 2.595 .0% . . . .<br />
. . .015 .0% .012 .0% . . .005 .0% . . . . . . . . . .<br />
. . . . . . . . . . .075 .0% . . . . . . .019 .0%<br />
430.705 55.2% 512.295 54.2% 673.978 4.9% 291.013 2.3% 486.679 64.3% 386.455 28.3% 513.972 57.4% 617.987 2.7% 361.787 1.4% 343.405 44.7%<br />
.016 .0% .020 .0% .022 .0% . . .047 .0% .076 .0% .030 .0% .008 .0% . . .123 .0%<br />
81.174 10.4% 139.383 14.8% 251.230 1.8% .622 .0% 107.478 14.2% 121.974 8.9% 91.686 10.2% 127.818 .6% .046 .0% 59.644 7.8%<br />
.018 .0% . . . . 1.852 .0% .037 .0% .022 .0% .036 .0% .005 .0% 1.680 .0% . .<br />
.029 .0% .012 .0% .017 .0% .083 .0% .107 .0% .053 .0% .005 .0% .031 .0% .070 .0% .167 .0%<br />
127.853 16.4% 34.806 3.7% 37.086 .3% . . 1.850 .2% 408.838 30.0% 202.651 22.6% 132.199 .6% .004 .0% 224.607 29.3%<br />
. . .041 .0% . . . . . . . . . . . . . . . .<br />
. . . . . . . . .019 .0% . . . . . . . . . .<br />
. . . . . . . . . . . . . . .015 .0% . . .027 .0%<br />
.656 .1% .823 .1% 1.708 .0% .234 .0% .226 .0% .491 .0% .566 .1% 4.624 .0% . . .169 .0%<br />
2.077 .3% 1.153 .1% .651 .0% . . .558 .1% .637 .0% .971 .1% .612 .0% .050 .0% .365 .0%<br />
. . . . . . . . . . .040 .0% .837 .1% .017 .0% . . . .<br />
2.032 .3% 4.358 .5% 11538.779 83.6% 10623.984 85.8% 1.804 .2% 2.705 .2% 3.290 .4% 19000.936 83.8% 25293.875 98.5% 2.674 .3%<br />
. . . . . . . . . . .007 .0% . . . . . . . .<br />
. . . . . . . . . . .001 .0% . . . . . . . .<br />
. . . . . . . . . . .027 .0% . . . . . . . .<br />
. . . . . . . . . . . . . . .016 .0% . . .008 .0%<br />
. . . . . . .013 .0% . . . . . . . . . . . .<br />
. . .007 .0% .024 .0% .141 .0% .020 .0% .012 .0% .013 .0% .026 .0% .009 .0% . .<br />
. . . . . . . . . . .007 .0% . . . . . . . .<br />
3.988 .5% 5.423 .6% 2.753 .0% .263 .0% 4.761 .6% 5.111 .4% 4.332 .5% 3.073 .0% .269 .0% 1.549 .2%<br />
63.075 8.1% 17.993 1.9% 7.470 .1% .406 .0% 32.330 4.3% 197.876 14.5% . . 13.347 .1% . . 32.238 4.2%<br />
10.010 1.3% .012 .0% 402.442 2.9% . . 97.797 12.9% 22.045 1.6% . . 236.283 1.0% . . 66.535 8.7%<br />
. . . . . . . . .035 .0% . . . . .011 .0% . . .049 .0%<br />
779.627 100.0% 944.328 100.0% 13798.398 100.0% 12383.781 100.0% 756.750 100.0% 1363.935 100.0% 895.665 100.0% 22660.848 100.0% 25670.779 100.0% 767.626 100.0%<br />
<strong>Horns</strong> <strong>Rev</strong>. <strong>Benthic</strong> communities Page 121<br />
.
Doc. No. 2572-03-005 rev. 4<br />
8.4.5. Appendix 4.6. Mean biomass WW. Scour protections 2003-2005<br />
2003<br />
Spring<br />
HYDROZOA Hydrozoa indet.<br />
Thec<strong>at</strong>a indet.<br />
Campanulariidae indet.<br />
ANTHOZOA Anthozoa indet.<br />
Actiniaria indet.<br />
NEMERTINI Nemertini indet.<br />
POLYCHAETA Harmothoe impar<br />
Phyllodoce groenl<strong>and</strong>ica<br />
Eulalia viridis<br />
Chaetopterus norvegicus<br />
Pom<strong>at</strong>oceros triqueter<br />
CRUSTACEA Verruca stroemia<br />
Balanus cren<strong>at</strong>us<br />
Cancer pagurus<br />
Corophium crassicorne<br />
Jassa marmor<strong>at</strong>a<br />
Caprella linearis<br />
GASTROPODA Rissoidae indet.<br />
Crepidula fornic<strong>at</strong>a<br />
Nudibranchia indet.<br />
Onchidoris muric<strong>at</strong>a<br />
BIVALVIA Bivalvia indet.<br />
Mytilus edulis<br />
Heteranomia squamula<br />
Moerella pygmaea<br />
Thracia phaseolina<br />
BRYOZOA Bryozoa indet.<br />
Electra pilosa<br />
ECHINODERMATA Asterias rubens<br />
Ophiura albida<br />
Strongylocentrotus<br />
droebachiensis<br />
Total<br />
A 0.5 NNE<br />
g/m² Kol Sum %<br />
B 02 NNE<br />
g/m² Kol Sum %<br />
Transect<br />
Found<strong>at</strong>ions, horizontal<br />
C 05 NNE<br />
g/m² Kol Sum %<br />
D 05 SSW<br />
g/m² Kol Sum %<br />
. . .004 .0% . . . .<br />
. . . . .003 .0% . .<br />
. . .010 .0% .004 .0% . .<br />
.622 .3% 4.929 2.3% . . .278 .1%<br />
4.022 1.9% 3.373 1.6% 7.379 1.3% 2.272 1.0%<br />
.023 .0% .002 .0% . . .002 .0%<br />
.136 .1% .634 .3% 1.128 .2% .353 .2%<br />
.038 .0% .278 .1% .999 .2% .898 .4%<br />
.001 .0% .003 .0% .025 .0% . .<br />
. . .075 .0% .054 .0% . .<br />
.003 .0% .141 .1% .095 .0% .024 .0%<br />
.025 .0% .005 .0% . . .020 .0%<br />
93.304 45.2% 79.611 37.7% 360.297 65.9% 15.682 7.2%<br />
.033 .0% . . .096 .0% . .<br />
. . . . .003 .0% . .<br />
70.065 34.0% 56.164 26.6% 111.123 20.3% 147.338 67.7%<br />
3.730 1.8% 6.435 3.0% 1.189 .2% .219 .1%<br />
.003 .0% .019 .0% .069 .0% .006 .0%<br />
.053 .0% .276 .1% .929 .2% .060 .0%<br />
. . . . .269 .0% .015 .0%<br />
.342 .2% . . .045 .0% . .<br />
. . .006 .0% . . . .<br />
2.383 1.2% 3.978 1.9% 1.354 .2% 4.313 2.0%<br />
. . .010 .0% .017 .0% . .<br />
.016 .0% .045 .0% .099 .0% . .<br />
. . . . .006 .0% . .<br />
. . .099 .0% .017 .0% . .<br />
.290 .1% 1.372 .6% 1.680 .3% .411 .2%<br />
31.253 15.1% 53.760 25.5% 60.071 11.0% 45.712 21.0%<br />
. . .002 .0% .004 .0% .002 .0%<br />
. . . . . . .004 .0%<br />
206.342 100.0% 211.231 100.0% 546.955 100.0% 217.608 100.0%<br />
Autumn<br />
PORIFERA Porifera indet.<br />
HYDROZOA Tubularia indivisa<br />
Campanulariidae indet.<br />
ANTHOZOA Actiniaria indet.<br />
NEMERTINI Nemertini indet.<br />
NEMATODA Nem<strong>at</strong>oda indet.<br />
POLYCHAETA Harmothoe impar<br />
Phyllodocidae indet.<br />
Phyllodoce groenl<strong>and</strong>ica<br />
Eulalia viridis<br />
Syllidae indet.<br />
Nereididae indet.<br />
Polydora cili<strong>at</strong>a<br />
Capitella capit<strong>at</strong>a<br />
Pom<strong>at</strong>oceros triqueter<br />
PYCNOGONIDA Phoxichilidium femor<strong>at</strong>um<br />
CRUSTACEA Verruca stroemia<br />
Balanus cren<strong>at</strong>us<br />
Cancer pagurus<br />
Stenothoe marina<br />
Jassa marmor<strong>at</strong>a<br />
Atylus swammerdami<br />
Caprella linearis<br />
Hyperia galba<br />
CHIRONOMIDAE Telm<strong>at</strong>ogeton japonicus<br />
GASTROPODA Rissoidae indet.<br />
Crepidula fornic<strong>at</strong>a<br />
Polinices sp.<br />
Nudibranchia indet.<br />
Onchidoris muric<strong>at</strong>a<br />
BIVALVIA Mytilus edulis<br />
Moerella pygmaea<br />
Hi<strong>at</strong>ella arctica<br />
BRYOZOA Bryozoa indet.<br />
Electra pilosa<br />
ECHINODERMATA Asterias rubens<br />
Strongylocentrotus<br />
droebachiensis<br />
Total<br />
A 0.5 NNE<br />
g/m² Kol Sum %<br />
B 02 NNE<br />
g/m² Kol Sum %<br />
Transect<br />
Found<strong>at</strong>ions, horizontal<br />
C 05 NNE<br />
g/m² Kol Sum %<br />
D 05 SSW<br />
g/m² Kol Sum %<br />
. . . . .492 .4% . .<br />
4.765 2.9% 5.688 2.5% 2.173 1.6% 6.586 4.1%<br />
.142 .1% .133 .1% .088 .1% .098 .1%<br />
43.808 27.1% 97.761 42.9% 68.143 49.1% 41.939 26.1%<br />
.003 .0% . . .009 .0% .004 .0%<br />
.003 .0% .002 .0% .002 .0% .002 .0%<br />
. . . . .002 .0% . .<br />
. . .000 .0% . . . .<br />
.050 .0% .032 .0% .045 .0% .026 .0%<br />
.003 .0% .003 .0% . . . .<br />
. . . . . . .002 .0%<br />
.001 .0% . . . . . .<br />
. . . . .000 .0% . .<br />
. . .007 .0% .000 .0% . .<br />
.081 .1% .270 .1% .224 .2% .514 .3%<br />
.001 .0% . . . . . .<br />
.006 .0% .036 .0% .054 .0% .013 .0%<br />
.310 .2% .432 .2% .230 .2% 1.499 .9%<br />
.017 .0% .079 .0% .183 .1% .087 .1%<br />
.002 .0% . . . . . .<br />
32.758 20.3% 27.546 12.1% 22.944 16.5% 41.846 26.0%<br />
. . .001 .0% . . . .<br />
6.387 4.0% 3.619 1.6% 1.596 1.1% 4.478 2.8%<br />
.004 .0% . . . . . .<br />
.002 .0% . . . . . .<br />
.233 .1% .217 .1% .847 .6% .154 .1%<br />
.433 .3% 5.341 2.3% 1.125 .8% 7.195 4.5%<br />
. . . . .021 .0% . .<br />
.018 .0% .063 .0% .023 .0% .057 .0%<br />
.017 .0% .023 .0% .024 .0% .279 .2%<br />
.099 .1% .263 .1% .124 .1% 3.854 2.4%<br />
. . . . .001 .0% .001 .0%<br />
. . .001 .0% .006 .0% .004 .0%<br />
.019 .0% .122 .1% .210 .2% . .<br />
2.148 1.3% 1.411 .6% 1.225 .9% 2.279 1.4%<br />
70.229 43.5% 84.703 37.2% 39.036 28.1% 50.027 31.1%<br />
.002 .0% .002 .0% .002 .0% . .<br />
161.538 100.0% 227.756 100.0% 138.832 100.0% 160.945 100.0%<br />
<strong>Horns</strong> <strong>Rev</strong>. <strong>Benthic</strong> communities Page 122<br />
.
Doc. No. 2572-03-005 rev. 4<br />
2004<br />
Spring<br />
PORIFERA Halichondria panicea<br />
HYDROZOA Tubularia indivisa<br />
Campanulariidae indet.<br />
ANTHOZOA Alcyonium digit<strong>at</strong>um<br />
Actiniaria indet.<br />
NEMERTINI Nemertini indet.<br />
POLYCHAETA Phyllodoce groenl<strong>and</strong>ica<br />
Eulalia viridis<br />
Syllidae indet.<br />
Polydora cili<strong>at</strong>a<br />
Capitella capit<strong>at</strong>a<br />
Pom<strong>at</strong>oceros triqueter<br />
CRUSTACEA Verruca stroemia<br />
Balanus cren<strong>at</strong>us<br />
Corystes cassivelaunus<br />
Cancer pagurus<br />
Jassa marmor<strong>at</strong>a<br />
Caprella linearis<br />
GASTROPODA Rissoidae indet.<br />
Crepidula fornic<strong>at</strong>a<br />
Nudibranchia indet.<br />
Onchidoris muric<strong>at</strong>a<br />
Polycera quadriline<strong>at</strong>a<br />
Aeolidia papillosa<br />
BIVALVIA Mytilus edulis<br />
Goodallia triangularis<br />
Hi<strong>at</strong>ella arctica<br />
BRYOZOA Electra pilosa<br />
Alcyonidium sp.<br />
ECHINODERMATA Asterias rubens<br />
Total<br />
A 0.5 NNE<br />
g/m² Kol Sum %<br />
Transect<br />
Found<strong>at</strong>ions, horizontal<br />
B 02 NNE<br />
g/m² Kol Sum %<br />
C 05 NNE<br />
g/m² Kol Sum %<br />
D 05 SSW<br />
g/m² Kol Sum %<br />
. . .009 .0% .181 .1% . .<br />
.712 .5% .001 .0% . . .089 .0%<br />
.026 .0% .010 .0% .016 .0% .020 .0%<br />
. . .496 .2% .244 .1% . .<br />
12.831 9.7% 40.262 15.9% 80.245 38.6% 21.714 9.0%<br />
.034 .0% .024 .0% .067 .0% .031 .0%<br />
.011 .0% .140 .1% .140 .1% .128 .1%<br />
.002 .0% . . .001 .0% . .<br />
. . .001 .0% .007 .0% . .<br />
. . .003 .0% . . . .<br />
.001 .0% .009 .0% . . . .<br />
.173 .1% .081 .0% .461 .2% .374 .2%<br />
. . . . .013 .0% .012 .0%<br />
.008 .0% .015 .0% .424 .2% .009 .0%<br />
. . .002 .0% .003 .0% . .<br />
. . . . . . .013 .0%<br />
87.032 66.0% 159.154 63.0% 70.668 34.0% 155.237 64.5%<br />
8.311 6.3% 4.268 1.7% 1.564 .8% 1.690 .7%<br />
.025 .0% .143 .1% .145 .1% .016 .0%<br />
.001 .0% 1.124 .4% 3.448 1.7% 5.776 2.4%<br />
.054 .0% . . .024 .0% .068 .0%<br />
.119 .1% .003 .0% .003 .0% . .<br />
.006 .0% .199 .1% .263 .1% .069 .0%<br />
.004 .0% .105 .0% .113 .1% .032 .0%<br />
.111 .1% .479 .2% .243 .1% .085 .0%<br />
.002 .0% . . . . . .<br />
. . . . .032 .0% .018 .0%<br />
1.813 1.4% 2.376 .9% 1.541 .7% 1.331 .6%<br />
.027 .0% .070 .0% . . . .<br />
20.539 15.6% 43.715 17.3% 48.022 23.1% 54.067 22.5%<br />
131.840 100.0% 252.688 100.0% 207.868 100.0% 240.779 100.0%<br />
Autumn<br />
PORIFERA Porifera indet.<br />
HYDROZOA Tubularia indivisa<br />
Campanulariidae indet.<br />
Sertularia cupressina<br />
ANTHOZOA Alcyonium digit<strong>at</strong>um<br />
Actiniaria indet.<br />
NEMERTINI Nemertini indet.<br />
NEMATODA Nem<strong>at</strong>oda indet.<br />
POLYCHAETA Phyllodoce groenl<strong>and</strong>ica<br />
Eulalia viridis<br />
Nereis pelagica<br />
Polydora cili<strong>at</strong>a<br />
Cirr<strong>at</strong>ulidae indet.<br />
Terebellidae indet.<br />
Lanice conchilega<br />
Sabellaria sp.<br />
Pom<strong>at</strong>oceros triqueter<br />
CRUSTACEA Verruca stroemia<br />
Balanus cren<strong>at</strong>us<br />
Cancer pagurus<br />
Liocarcinus depur<strong>at</strong>or<br />
Jassa marmor<strong>at</strong>a<br />
Caprella linearis<br />
GASTROPODA Rissoidae indet.<br />
Crepidula fornic<strong>at</strong>a<br />
Hinia pygmaea<br />
Nudibranchia indet.<br />
Onchidoris muric<strong>at</strong>a<br />
Polycera quadriline<strong>at</strong>a<br />
Aeolidia papillosa<br />
BIVALVIA Mytilus edulis<br />
Angulus tenuis<br />
Moerella pygmaea<br />
Hi<strong>at</strong>ella arctica<br />
BRYOZOA Bryozoa indet.<br />
Electra pilosa<br />
Alcyonidium sp.<br />
ECHINODERMATA Asterias rubens<br />
Ophiura albida<br />
Strongylocentrotus<br />
droebachiensis<br />
Total<br />
A 0.5 NNE<br />
g/m² Kol Sum %<br />
Transect<br />
Found<strong>at</strong>ions, horizontal<br />
B 02 NNE<br />
g/m² Kol Sum %<br />
C 05 NNE<br />
g/m² Kol Sum %<br />
D 05 SSW<br />
g/m² Kol Sum %<br />
. . . . . . .044 .0%<br />
1.313 .5% .227 .1% .859 .4% .101 .0%<br />
.013 .0% .048 .0% .111 .1% .010 .0%<br />
.009 .0% . . . . .232 .1%<br />
11.878 4.8% 2.880 1.0% 7.471 3.5% 5.708 1.7%<br />
19.497 7.9% 34.011 11.9% 70.886 33.1% 9.443 2.8%<br />
. . . . . . .006 .0%<br />
.009 .0% .005 .0% .005 .0% .005 .0%<br />
.063 .0% .018 .0% .130 .1% .061 .0%<br />
.060 .0% .011 .0% .069 .0% .123 .0%<br />
. . . . . . .021 .0%<br />
. . . . . . .001 .0%<br />
. . .000 .0% . . . .<br />
. . . . . . .025 .0%<br />
. . . . .009 .0% . .<br />
. . . . .005 .0% . .<br />
.539 .2% .689 .2% .922 .4% .484 .1%<br />
.063 .0% .059 .0% .344 .2% .343 .1%<br />
2.626 1.1% .093 .0% .444 .2% .525 .2%<br />
2.767 1.1% 2.348 .8% 2.053 1.0% 2.137 .6%<br />
.045 .0% . . . . . .<br />
150.580 61.2% 181.910 63.8% 79.928 37.3% 258.346 76.0%<br />
3.384 1.4% 1.746 .6% 2.574 1.2% 10.324 3.0%<br />
.058 .0% .085 .0% .047 .0% .172 .1%<br />
8.577 3.5% 20.774 7.3% 16.432 7.7% 5.670 1.7%<br />
.010 .0% .012 .0% .055 .0% .042 .0%<br />
.077 .0% . . . . .115 .0%<br />
.005 .0% . . .002 .0% .006 .0%<br />
.094 .0% . . .020 .0% .085 .0%<br />
.161 .1% .039 .0% .276 .1% . .<br />
.332 .1% .590 .2% .144 .1% .184 .1%<br />
.001 .0% .001 .0% .000 .0% .003 .0%<br />
.009 .0% . . . . . .<br />
. . .003 .0% . . . .<br />
. . . . .065 .0% . .<br />
2.549 1.0% .658 .2% 1.308 .6% 3.656 1.1%<br />
.037 .0% .082 .0% .096 .0% . .<br />
41.289 16.8% 38.867 13.6% 29.984 14.0% 42.226 12.4%<br />
.007 .0% .011 .0% .015 .0% .023 .0%<br />
.025 .0% .002 .0% .065 .0% . .<br />
246.076 100.0% 285.169 100.0% 214.317 100.0% 340.120 100.0%<br />
<strong>Horns</strong> <strong>Rev</strong>. <strong>Benthic</strong> communities Page 123<br />
.
Doc. No. 2572-03-005 rev. 4<br />
2005<br />
Spring<br />
HYDROZOA Tubularia indivisa<br />
Hydractinia echin<strong>at</strong>a<br />
Campanulariidae indet.<br />
Sertularia cupressina<br />
ANTHOZOA Alcyonium digit<strong>at</strong>um<br />
Actiniaria indet.<br />
NEMERTINI Nemertini indet.<br />
NEMATODA Nem<strong>at</strong>oda indet.<br />
POLYCHAETA Harmothoe impar<br />
Phyllodoce groenl<strong>and</strong>ica<br />
Eulalia viridis<br />
Hesionidae indet.<br />
Ophiodromus flexuosus<br />
Polydora cili<strong>at</strong>a<br />
Pom<strong>at</strong>oceros triqueter<br />
CRUSTACEA Verruca stroemia<br />
Balanus balanus<br />
Balanus sp.<br />
Cancer pagurus<br />
Jassa marmor<strong>at</strong>a<br />
Caprella linearis<br />
CHIRONOMIDAE Telm<strong>at</strong>ogeton japonicus<br />
GASTROPODA Tectura testudinalis<br />
Rissoidae indet.<br />
Crepidula fornic<strong>at</strong>a<br />
Epitonium cl<strong>at</strong>hrus<br />
Onchidoris muric<strong>at</strong>a<br />
Polycera quadriline<strong>at</strong>a<br />
Facelina bostoniensis<br />
BIVALVIA Mytilus edulis<br />
Thracia phaseolina<br />
BRYOZOA Bryozoa indet.<br />
Electra pilosa<br />
Alcyonidium sp.<br />
ECHINODERMATA Asterias rubens<br />
Ophiura albida<br />
Total<br />
A 0.5 NNE<br />
g/m² Kol Sum %<br />
Transect<br />
Found<strong>at</strong>ions, horizontal<br />
B 02 NNE<br />
g/m² Kol Sum %<br />
C 05 NNE<br />
g/m² Kol Sum %<br />
D 05 SSW<br />
g/m² Kol Sum %<br />
1.802 2.1% 8.305 5.5% .598 .3% .586 .2%<br />
. . .017 .0% .012 .0% . .<br />
.059 .1% .020 .0% .000 .0% .019 .0%<br />
. . .010 .0% . . . .<br />
1.406 1.7% .093 .1% 14.089 6.2% 4.832 2.0%<br />
24.576 29.3% 38.158 25.1% 74.191 32.6% 52.080 21.1%<br />
. . . . . . .004 .0%<br />
.023 .0% .033 .0% .040 .0% .102 .0%<br />
.053 .1% . . .129 .1% .003 .0%<br />
. . . . .076 .0% .071 .0%<br />
.216 .3% .065 .0% .149 .1% .230 .1%<br />
. . . . . . .001 .0%<br />
. . .017 .0% .001 .0% .011 .0%<br />
. . .001 .0% .002 .0% . .<br />
.966 1.2% .912 .6% 1.310 .6% 1.038 .4%<br />
.082 .1% .114 .1% .317 .1% .385 .2%<br />
. . 2.960 2.0% . . . .<br />
. . . . . . .053 .0%<br />
.107 .1% .234 .2% .035 .0% . .<br />
30.466 36.3% 62.579 41.2% 66.616 29.2% 79.437 32.2%<br />
.387 .5% .885 .6% .650 .3% 7.381 3.0%<br />
.011 .0% . . . . .015 .0%<br />
. . . . . . .019 .0%<br />
.054 .1% .153 .1% .049 .0% .166 .1%<br />
.010 .0% .845 .6% 2.276 1.0% 34.188 13.8%<br />
. . .001 .0% . . . .<br />
. . .099 .1% .028 .0% . .<br />
. . .048 .0% .032 .0% .085 .0%<br />
.001 .0% .007 .0% .016 .0% .076 .0%<br />
.080 .1% .110 .1% .097 .0% .154 .1%<br />
. . . . .002 .0% . .<br />
.140 .2% . . . . . .<br />
.396 .5% .521 .3% .850 .4% .710 .3%<br />
.039 .0% .005 .0% .137 .1% . .<br />
23.055 27.5% 35.575 23.4% 66.185 29.0% 65.255 26.4%<br />
.001 .0% . . . . . .<br />
83.930 100.0% 151.765 100.0% 227.890 100.0% 246.902 100.0%<br />
Autumn<br />
PORIFERA Porifera indet.<br />
HYDROZOA Tubularia indivisa<br />
Hydractinia echin<strong>at</strong>a<br />
Campanulariidae indet.<br />
Sertularia cupressina<br />
ANTHOZOA Alcyonium digit<strong>at</strong>um<br />
Actiniaria indet.<br />
Actinaridae indet.<br />
NEMERTINI Nemertini indet.<br />
NEMATODA Nem<strong>at</strong>oda indet.<br />
POLYCHAETA Harmothoe impar<br />
Phyllodoce groenl<strong>and</strong>ica<br />
Eulalia viridis<br />
Syllidae indet.<br />
Polydora cornuta<br />
Chaetopterus norvegicus<br />
Arenicola marina<br />
Lanice conchilega<br />
Sabellaria spinulosa<br />
Pom<strong>at</strong>oceros triqueter<br />
CRUSTACEA Copepoda indet.<br />
Verruca stroemia<br />
Balanus balanus<br />
Balanus cren<strong>at</strong>us<br />
Cancer pagurus<br />
Liocarcinus depur<strong>at</strong>or<br />
Pisidia longicornis<br />
Pagurus bernhardus<br />
Stenothoe sp.<br />
Jassa marmor<strong>at</strong>a<br />
Atylus swammerdami<br />
Caprella linearis<br />
CHIRONOMIDAE Telm<strong>at</strong>ogeton japonicus<br />
GASTROPODA Rissoidae indet.<br />
Crepidula fornic<strong>at</strong>a<br />
Polinices polianus<br />
Hinia pygmaea<br />
Onchidoris muric<strong>at</strong>a<br />
Polycera quadriline<strong>at</strong>a<br />
Facelina bostoniensis<br />
Aeolidia papillosa<br />
BIVALVIA Mytilus edulis<br />
Angulus tenuis<br />
Moerella pygmaea<br />
Hi<strong>at</strong>ella arctica<br />
Thracia phaseolina<br />
BRYOZOA Bryozoa indet.<br />
Electra pilosa<br />
Alcyonidium sp.<br />
ECHINODERMATA Asterias rubens<br />
Ophiura albida<br />
Strongylocentrotus<br />
droebachiensis<br />
ASCIDIACEA Tunic<strong>at</strong>a indet.<br />
Total<br />
A 0.5 NNE<br />
g/m² Kol Sum %<br />
B 02 NNE<br />
g/m² Kol Sum %<br />
Transect<br />
Found<strong>at</strong>ions, horizontal<br />
C 05 NNE<br />
g/m² Kol Sum %<br />
D 05 SSW<br />
g/m² Kol Sum %<br />
.000 .0% . . . . . .<br />
1.955 .4% 1.190 .2% 1.612 .3% 1.070 .2%<br />
. . . . .012 .0% .010 .0%<br />
.072 .0% .111 .0% .731 .1% .181 .0%<br />
.322 .1% . . .001 .0% .009 .0%<br />
6.353 1.2% 61.437 11.3% 25.853 5.2% 55.503 10.7%<br />
220.763 41.6% 272.300 50.1% 175.496 35.3% 202.466 38.9%<br />
. . . . 13.775 2.8% . .<br />
.006 .0% .101 .0% .013 .0% .016 .0%<br />
.035 .0% .129 .0% .087 .0% .239 .0%<br />
.042 .0% .000 .0% .017 .0% .014 .0%<br />
.017 .0% . . . . .004 .0%<br />
.161 .0% .156 .0% .092 .0% .099 .0%<br />
. . . . . . .002 .0%<br />
. . . . .022 .0% . .<br />
.014 .0% . . .036 .0% .025 .0%<br />
. . .000 .0% . . . .<br />
. . . . .046 .0% .006 .0%<br />
. . . . .013 .0% . .<br />
1.747 .3% .843 .2% .891 .2% .376 .1%<br />
. . .003 .0% .000 .0% . .<br />
.386 .1% 1.305 .2% 1.239 .2% .884 .2%<br />
1.632 .3% .652 .1% . . 3.443 .7%<br />
. . . . .014 .0% .189 .0%<br />
2.609 .5% 1.858 .3% 1.735 .3% 1.424 .3%<br />
. . .008 .0% .132 .0% .010 .0%<br />
. . . . .002 .0% .009 .0%<br />
. . .005 .0% . . . .<br />
.039 .0% . . . . . .<br />
226.354 42.6% 140.248 25.8% 208.714 42.0% 176.580 33.9%<br />
.101 .0% .125 .0% .101 .0% .103 .0%<br />
11.296 2.1% 7.076 1.3% 3.285 .7% 3.651 .7%<br />
.002 .0% . . .001 .0% . .<br />
.260 .0% .144 .0% .065 .0% .080 .0%<br />
.289 .1% 8.572 1.6% 18.697 3.8% 33.523 6.4%<br />
. . . . . . .004 .0%<br />
.023 .0% .014 .0% .015 .0% . .<br />
. . . . .030 .0% .003 .0%<br />
.214 .0% .090 .0% .229 .0% .300 .1%<br />
.252 .0% .348 .1% .129 .0% .129 .0%<br />
. . .331 .1% .184 .0% .186 .0%<br />
2.042 .4% 1.894 .3% 1.164 .2% 3.273 .6%<br />
. . .000 .0% . . .001 .0%<br />
.020 .0% .014 .0% .023 .0% .017 .0%<br />
.003 .0% . . .007 .0% .010 .0%<br />
.006 .0% . . . . . .<br />
. . . . . . .004 .0%<br />
1.127 .2% 1.560 .3% 1.510 .3% 1.493 .3%<br />
2.687 .5% 1.501 .3% .026 .0% .284 .1%<br />
50.305 9.5% 39.807 7.3% 41.281 8.3% 34.594 6.6%<br />
. . . . .003 .0% .002 .0%<br />
. . 1.238 .2% . . . .<br />
. . . . .070 .0% .015 .0%<br />
531.136 100.0% 543.061 100.0% 497.356 100.0% 520.230 100.0%<br />
<strong>Horns</strong> <strong>Rev</strong>. <strong>Benthic</strong> communities Page 124<br />
.
Doc. No. 2572-03-005 rev. 4<br />
8.4.6. Appendix 4.7. Mean biomass DW. Monopiles 2003-2005<br />
2003-Spring<br />
HYDROZOA Tubulariidae indet.<br />
Campanulariidae indet.<br />
ANTHOZOA Anthozoa indet.<br />
Actiniaria indet.<br />
NEMERTINI Nemertini indet.<br />
POLYCHAETA Harmothoe impar<br />
Phyllodoce groenl<strong>and</strong>ica<br />
Eulalia viridis<br />
Capitella capit<strong>at</strong>a<br />
Pom<strong>at</strong>oceros triqueter<br />
CRUSTACEA Verruca stroemia<br />
Balanus balanus<br />
Balanus cren<strong>at</strong>us<br />
Cancer pagurus<br />
Aoridae indet.<br />
Jassa marmor<strong>at</strong>a<br />
Caprella linearis<br />
GASTROPODA Rissoidae indet.<br />
Crepidula fornic<strong>at</strong>a<br />
Nudibranchia indet.<br />
Onchidoris muric<strong>at</strong>a<br />
BIVALVIA Mytilus edulis<br />
BRYOZOA Bryozoa indet.<br />
Electra pilosa<br />
ECHINODERMATA Asterias rubens<br />
Strongylocentrotus<br />
droebachiensis<br />
Total<br />
NNE 02<br />
g/m² Kol Sum %<br />
NNE 04<br />
g/m² Kol Sum %<br />
NNE 06<br />
g/m² Kol Sum %<br />
NNE 08<br />
g/m² Kol Sum %<br />
NNE Bottom<br />
g/m² Kol Sum %<br />
Transect<br />
Turbine tower, vertical<br />
SSW 02<br />
g/m² Kol Sum %<br />
SSW 04<br />
g/m² Kol Sum %<br />
SSW 06<br />
g/m² Kol Sum %<br />
SSW 08<br />
g/m² Kol Sum %<br />
SSW Bottom<br />
g/m² Kol Sum %<br />
. . . . . . . . . . .008 .0% . . . . . . . .<br />
. . . . . . . . . . .007 .0% . . . . . . .004 .0%<br />
. . .490 .0% . . . . . . . . . . . . . . .329 .1%<br />
. . . . . . . . 1.548 .4% .005 .0% .003 .0% . . . . .021 .0%<br />
2.899 .8% .681 .0% .495 .0% .111 .0% . . .668 .1% .795 .1% 1.328 .1% . . .082 .0%<br />
.099 .0% .100 .0% .066 .0% . . .341 .1% .053 .0% .137 .0% .035 .0% . . .126 .0%<br />
.108 .0% .056 .0% .013 .0% . . .032 .0% .179 .0% .064 .0% . . . . .040 .0%<br />
.005 .0% .023 .0% . . . . . . . . . . . . . . .017 .0%<br />
.007 .0% .017 .0% .004 .0% . . . . . . .000 .0% .003 .0% . . . .<br />
.254 .1% . . .130 .0% . . .404 .1% .331 .1% .207 .0% . . . . .444 .1%<br />
.031 .0% . . .039 .0% . . .100 .0% .065 .0% . . .044 .0% . . .073 .0%<br />
. . . . 81.875 6.6% 411.053 78.4% . . . . . . 181.845 17.1% 325.159 57.4% . .<br />
277.618 76.4% 1458.095 87.6% 896.704 72.5% . . 89.722 21.3% 393.773 69.4% 341.599 60.4% 750.148 70.4% . . 206.394 59.9%<br />
.182 .0% .056 .0% .070 .0% .391 .1% . . .207 .0% .020 .0% .252 .0% . . . .<br />
. . . . . . . . . . . . . . .019 .0% . . . .<br />
75.641 20.8% 125.477 7.5% 165.433 13.4% 49.713 9.5% 122.537 29.1% 123.274 21.7% 125.535 22.2% 99.710 9.4% 146.189 25.8% 56.494 16.4%<br />
2.406 .7% 3.290 .2% 3.198 .3% .852 .2% 2.218 .5% 2.295 .4% 3.875 .7% 1.015 .1% .394 .1% .807 .2%<br />
.026 .0% . . . . . . . . . . . . . . . . .008 .0%<br />
1.356 .4% 1.771 .1% . . . . .134 .0% .599 .1% .087 .0% . . . . . .<br />
. . .010 .0% . . . . .035 .0% . . .000 .0% . . . . .004 .0%<br />
. . . . . . . . . . . . . . . . . . .021 .0%<br />
2.325 .6% 65.397 3.9% 72.725 5.9% 9.821 1.9% 6.612 1.6% 38.863 6.9% 92.752 16.4% 30.006 2.8% 94.543 16.7% 21.154 6.1%<br />
. . . . . . . . .001 .0% . . . . . . . . . .<br />
.587 .2% .280 .0% .408 .0% .143 .0% .323 .1% .429 .1% .413 .1% .391 .0% . . .202 .1%<br />
. . 8.763 .5% 15.096 1.2% 52.347 10.0% 197.751 46.9% 6.470 1.1% . . . . . . 58.163 16.9%<br />
. . . . . . . . . . . . .002 .0% . . . . . .<br />
363.545 100.0% 1664.505 100.0% 1236.256 100.0% 524.430 100.0% 421.759 100.0% 567.225 100.0% 565.489 100.0% 1064.797 100.0% 566.284 100.0% 344.383 100.0%<br />
<strong>Horns</strong> <strong>Rev</strong>. <strong>Benthic</strong> communities Page 125<br />
.
Doc. No. 2572-03-005 rev. 4<br />
2003-Autumn<br />
HYDROZOA Tubularia indivisa<br />
Campanulariidae indet.<br />
ANTHOZOA Actiniaria indet.<br />
NEMERTINI Nemertini indet.<br />
NEMATODA Nem<strong>at</strong>oda indet.<br />
POLYCHAETA Harmothoe imbric<strong>at</strong>a<br />
Harmothoe impar<br />
Phyllodoce groenl<strong>and</strong>ica<br />
Eulalia viridis<br />
Nereididae indet.<br />
Nereis pelagica<br />
Neanthes virens<br />
Capitella capit<strong>at</strong>a<br />
Pom<strong>at</strong>oceros triqueter<br />
PYCNOGONIDA Phoxichilidium femor<strong>at</strong>um<br />
CRUSTACEA Verruca stroemia<br />
Balanus balanus<br />
Balanus cren<strong>at</strong>us<br />
Caridea indet.<br />
Corystes cassivelaunus<br />
Cancer pagurus<br />
Corophium crassicorne<br />
Jassa marmor<strong>at</strong>a<br />
Caprella linearis<br />
CHIRONOMIDAE Telm<strong>at</strong>ogeton japonicus<br />
GASTROPODA Rissoidae indet.<br />
Crepidula fornic<strong>at</strong>a<br />
Nudibranchia indet.<br />
Onchidoris muric<strong>at</strong>a<br />
BIVALVIA Mytilus edulis<br />
Ostrea edulis<br />
Heteranomia squamula<br />
Moerella pygmaea<br />
Venerupis senegalensis<br />
Hi<strong>at</strong>ella arctica<br />
BRYOZOA Bryozoa indet.<br />
Electra pilosa<br />
ECHINODERMATA Asterias rubens<br />
Strongylocentrotus<br />
droebachiensis<br />
Total<br />
NNE 02<br />
g/m² Kol Sum %<br />
NNE 04<br />
g/m² Kol Sum %<br />
NNE 06<br />
g/m² Kol Sum %<br />
NNE 08<br />
g/m² Kol Sum %<br />
NNE Bottom<br />
g/m² Kol Sum %<br />
Transect<br />
Turbine tower, vertical<br />
SSW 02<br />
g/m² Kol Sum %<br />
SSW 04<br />
g/m² Kol Sum %<br />
SSW 06<br />
g/m² Kol Sum %<br />
SSW 08<br />
g/m² Kol Sum %<br />
SSW Bottom<br />
g/m² Kol Sum %<br />
15.574 16.3% 2.142 3.0% 4.346 .1% . . 1.570 1.7% 1.909 3.2% 10.973 20.3% 4.540 .1% .161 .0% 1.247 .3%<br />
.035 .0% .027 .0% .033 .0% . . .172 .2% .022 .0% .115 .2% .012 .0% .009 .0% .023 .0%<br />
10.388 10.9% 5.672 8.0% 3.852 .1% . . .003 .0% 9.164 15.2% 1.525 2.8% 1.114 .0% .953 .0% 4.587 1.3%<br />
.007 .0% . . 2.834 .0% 11.273 .4% .008 .0% .085 .1% .119 .2% 2.551 .1% 1.470 .0% .003 .0%<br />
. . .012 .0% . . . . . . .042 .1% . . .001 .0% . . . .<br />
. . . . .238 .0% . . . . . . . . .098 .0% . . . .<br />
. . . . .160 .0% . . . . . . . . .153 .0% .046 .0% . .<br />
. . .015 .0% .049 .0% .013 .0% .005 .0% .005 .0% .012 .0% .038 .0% .054 .0% .012 .0%<br />
.111 .1% . . . . . . .000 .0% .003 .0% .002 .0% .091 .0% .005 .0% .003 .0%<br />
. . . . .007 .0% .149 .0% . . . . . . .031 .0% . . . .<br />
. . . . . . . . . . . . .005 .0% . . .112 .0% . .<br />
. . . . .071 .0% .109 .0% . . . . . . .015 .0% .092 .0% . .<br />
. . . . .004 .0% . . . . . . .001 .0% . . . . .007 .0%<br />
1.600 1.7% .928 1.3% .308 .0% . . 2.518 2.7% .760 1.3% 1.454 2.7% 1.477 .0% .034 .0% 2.060 .6%<br />
. . . . . . . . . . . . .000 .0% . . . . . .<br />
. . . . .026 .0% . . . . .044 .1% .029 .1% . . . . .059 .0%<br />
. . . . .828 .0% 858.400 29.6% . . . . . . .927 .0% 281.693 3.5% . .<br />
.221 .2% .230 .3% . . . . .019 .0% 1.013 1.7% .129 .2% 1.200 .0% . . .304 .1%<br />
. . . . . . . . .001 .0% . . . . . . . . . .<br />
. . . . . . . . . . . . . . . . . . .004 .0%<br />
.079 .1% .021 .0% .202 .0% .162 .0% .008 .0% .100 .2% .071 .1% .365 .0% .081 .0% .020 .0%<br />
. . . . .001 .0% . . . . . . . . . . . . . .<br />
19.546 20.4% 24.727 34.9% 43.821 .7% 59.498 2.1% 14.309 15.1% 12.589 20.8% 19.884 36.7% 47.109 1.3% 58.952 .7% 10.028 2.8%<br />
3.758 3.9% 8.716 12.3% 7.954 .1% .059 .0% 5.949 6.3% 2.091 3.5% 2.722 5.0% 13.017 .4% 2.065 .0% 1.094 .3%<br />
. . .010 .0% .006 .0% .065 .0% .003 .0% .001 .0% . . . . .024 .0% . .<br />
.009 .0% .003 .0% .030 .0% .004 .0% .014 .0% .021 .0% .008 .0% .228 .0% .103 .0% .015 .0%<br />
10.904 11.4% 8.423 11.9% .053 .0% . . 3.845 4.1% 17.083 28.3% 3.329 6.1% 2.661 .1% 3.549 .0% .084 .0%<br />
.027 .0% .011 .0% .008 .0% . . .016 .0% .012 .0% .001 .0% . . . . .027 .0%<br />
. . . . .013 .0% . . .014 .0% . . .009 .0% .005 .0% . . .008 .0%<br />
.529 .6% .149 .2% 5839.220 98.6% 1970.145 67.9% .025 .0% 7.302 12.1% .327 .6% 3460.745 97.1% 7583.838 95.5% .034 .0%<br />
. . . . . . . . . . . . . . .670 .0% . . . .<br />
. . .065 .1% .026 .0% . . . . . . .024 .0% . . . . . .<br />
. . . . . . . . . . . . . . .005 .0% . . . .<br />
. . . . . . . . . . . . . . .105 .0% . . . .<br />
.012 .0% .014 .0% . . . . . . . . .012 .0% .011 .0% .001 .0% . .<br />
.445 .5% .580 .8% . . . . .022 .0% . . .074 .1% . . . . . .<br />
12.273 12.8% 10.979 15.5% 12.241 .2% .020 .0% 4.085 4.3% .389 .6% 7.450 13.8% 11.819 .3% 4.202 .1% 5.747 1.6%<br />
20.150 21.1% 8.044 11.4% 5.314 .1% . . 62.169 65.6% 7.807 12.9% 5.886 10.9% 15.259 .4% .248 .0% 331.061 92.9%<br />
. . .006 .0% . . . . . . . . . . .220 .0% . . .003 .0%<br />
95.666 100.0% 70.776 100.0% 5921.644 100.0% 2899.897 100.0% 94.755 100.0% 60.444 100.0% 54.161 100.0% 3564.465 100.0% 7937.692 100.0% 356.429 100.0%<br />
<strong>Horns</strong> <strong>Rev</strong>. <strong>Benthic</strong> communities Page 126<br />
.
Doc. No. 2572-03-005 rev. 4<br />
2004-Spring<br />
HYDROZOA Tubularia indivisa<br />
Campanulariidae indet.<br />
ANTHOZOA Actiniaria indet.<br />
NEMERTINI Nemertini indet.<br />
NEMATODA Nem<strong>at</strong>oda indet.<br />
POLYCHAETA Harmothoe imbric<strong>at</strong>a<br />
Harmothoe impar<br />
Phyllodoce groenl<strong>and</strong>ica<br />
Eulalia viridis<br />
Syllidae indet.<br />
Nereis pelagica<br />
Neanthes virens<br />
Pom<strong>at</strong>oceros triqueter<br />
CRUSTACEA Verruca stroemia<br />
Balanus balanus<br />
Balanus cren<strong>at</strong>us<br />
Brachyura indet.<br />
Cancer pagurus<br />
Pisidia longicornis<br />
Jassa marmor<strong>at</strong>a<br />
Caprella linearis<br />
CHIRONOMIDAE Chironomidae indet.<br />
Telm<strong>at</strong>ogeton japonicus<br />
GASTROPODA Rissoidae indet.<br />
Crepidula fornic<strong>at</strong>a<br />
Nudibranchia indet.<br />
Onchidoris muric<strong>at</strong>a<br />
Polycera quadriline<strong>at</strong>a<br />
Aeolidia papillosa<br />
BIVALVIA Mytilus edulis<br />
Ostrea edulis<br />
Heteranomia squamula<br />
Hi<strong>at</strong>ella arctica<br />
BRYOZOA Electra pilosa<br />
Alcyonidium sp.<br />
ECHINODERMATA Asterias rubens<br />
Strongylocentrotus<br />
droebachiensis<br />
Total<br />
NNE 02<br />
g/m² Kol Sum %<br />
NNE 04<br />
g/m² Kol Sum %<br />
NNE 06<br />
g/m² Kol Sum %<br />
NNE 08<br />
g/m² Kol Sum %<br />
NNE Bottom<br />
g/m² Kol Sum %<br />
Transect<br />
Turbine tower, vertical<br />
SSW 02<br />
g/m² Kol Sum %<br />
SSW 04<br />
g/m² Kol Sum %<br />
SSW 06<br />
g/m² Kol Sum %<br />
SSW 08<br />
g/m² Kol Sum %<br />
SSW Bottom<br />
g/m² Kol Sum %<br />
. . . . . . . . . . . . .001 .0% . . . . .141 .2%<br />
. . .001 .0% . . . . .038 .1% . . .002 .0% . . . . . .<br />
1.292 1.0% 3.193 1.5% 3.864 .1% . . 2.307 3.7% 2.613 1.3% 1.010 .7% 2.067 .0% . . 1.101 1.3%<br />
.020 .0% .060 .0% 3.187 .1% .273 .0% .014 .0% .051 .0% .010 .0% .920 .0% .824 .0% .029 .0%<br />
. . . . . . . . . . .002 .0% . . . . . . . .<br />
. . . . . . . . . . . . . . .165 .0% . . . .<br />
.010 .0% .004 .0% .580 .0% .057 .0% .004 .0% .030 .0% .003 .0% .051 .0% .045 .0% . .<br />
. . .036 .0% .020 .0% .087 .0% . . .039 .0% .055 .0% . . .019 .0% . .<br />
.011 .0% . . .039 .0% .060 .0% . . .010 .0% .022 .0% . . .060 .0% .006 .0%<br />
. . . . . . . . . . .007 .0% . . . . . . .003 .0%<br />
. . . . 1.443 .0% . . . . . . . . . . . . . .<br />
. . . . . . .096 .0% . . . . . . . . . . . .<br />
2.895 2.3% 1.560 .7% .005 .0% . . 2.296 3.7% 4.895 2.4% 3.693 2.7% .438 .0% . . 1.325 1.6%<br />
. . . . .070 .0% . . . . . . .064 .0% . . . . . .<br />
. . . . . . 41.725 1.0% . . . . . . .358 .0% 32.127 1.0% . .<br />
1.491 1.2% 1.548 .7% 1.927 .0% . . .013 .0% .997 .5% 3.706 2.7% 3.141 .1% . . .013 .0%<br />
. . . . .037 .0% . . . . . . . . . . . . . .<br />
.009 .0% .046 .0% 4.064 .1% . . . . . . .010 .0% 2.811 .0% .358 .0% . .<br />
. . . . .111 .0% . . . . . . . . . . . . . .<br />
81.997 65.9% 150.450 72.2% 67.718 1.4% 16.191 .4% 32.091 51.5% 95.260 47.7% 97.931 70.8% 124.689 2.1% 15.011 .5% 43.296 52.4%<br />
15.242 12.2% 8.106 3.9% 16.715 .4% .134 .0% 3.264 5.2% 10.259 5.1% 4.488 3.2% 2.521 .0% .065 .0% 8.663 10.5%<br />
. . . . . . .005 .0% . . . . . . . . .002 .0% . .<br />
. . . . . . 1.364 .0% . . . . . . . . 1.793 .1% . .<br />
. . . . . . .009 .0% .006 .0% .007 .0% . . . . .003 .0% . .<br />
9.554 7.7% 19.098 9.2% . . . . 6.591 10.6% 74.396 37.2% 23.887 17.3% 8.217 .1% . . 6.035 7.3%<br />
.040 .0% .050 .0% .007 .0% . . . . . . .040 .0% .014 .0% . . .002 .0%<br />
.624 .5% .184 .1% .028 .0% . . .028 .0% .049 .0% .004 .0% . . . . . .<br />
.040 .0% .033 .0% .021 .0% . . .013 .0% .163 .1% .038 .0% .003 .0% . . .014 .0%<br />
.033 .0% 1.118 .5% .026 .0% . . .031 .1% .115 .1% .109 .1% .075 .0% . . . .<br />
.035 .0% .625 .3% 4642.448 97.8% 4329.058 98.6% .034 .1% .292 .1% .623 .5% 5897.030 97.5% 3077.527 98.4% .090 .1%<br />
. . . . .529 .0% . . . . . . . . . . . . . .<br />
.102 .1% .353 .2% . . . . . . . . .159 .1% . . . . . .<br />
.027 .0% . . .101 .0% .032 .0% . . .016 .0% .010 .0% .017 .0% .034 .0% . .<br />
1.930 1.6% 6.883 3.3% 2.587 .1% .005 .0% 2.406 3.9% 7.687 3.8% .917 .7% 4.506 .1% .446 .0% .347 .4%<br />
1.041 .8% .335 .2% .131 .0% . . 2.287 3.7% .631 .3% . . . . . . 4.150 5.0%<br />
8.058 6.5% 14.638 7.0% . . . . 10.860 17.4% 2.364 1.2% 1.620 1.2% . . . . 17.341 21.0%<br />
. . . . .047 .0% . . . . . . . . .277 .0% . . . .<br />
124.450 100.0% 208.321 100.0% 4745.704 100.0% 4389.098 100.0% 62.282 100.0% 199.885 100.0% 138.402 100.0% 6047.300 100.0% 3128.315 100.0% 82.557 100.0%<br />
<strong>Horns</strong> <strong>Rev</strong>. <strong>Benthic</strong> communities Page 127<br />
.
Doc. No. 2572-03-005 rev. 4<br />
2004-Autumn<br />
HYDROZOA Tubularia indivisa<br />
Hydractinia echin<strong>at</strong>a<br />
Campanulariidae indet.<br />
ANTHOZOA Actiniaria indet.<br />
NEMERTINI Nemertini indet.<br />
NEMATODA Nem<strong>at</strong>oda indet.<br />
POLYCHAETA Harmothoe imbric<strong>at</strong>a<br />
Harmothoe impar<br />
Phyllodoce groenl<strong>and</strong>ica<br />
Eulalia viridis<br />
Ophiodromus flexuosus<br />
Nereis pelagica<br />
Cirr<strong>at</strong>ulidae indet.<br />
Terebellidae indet.<br />
Pom<strong>at</strong>oceros triqueter<br />
CRUSTACEA Verruca stroemia<br />
Balanus balanus<br />
Balanus cren<strong>at</strong>us<br />
Cancer pagurus<br />
Jassa marmor<strong>at</strong>a<br />
Caprella linearis<br />
CHIRONOMIDAE Telm<strong>at</strong>ogeton japonicus<br />
GASTROPODA Rissoidae indet.<br />
Crepidula fornic<strong>at</strong>a<br />
Hinia pygmaea<br />
Nudibranchia indet.<br />
Onchidoris muric<strong>at</strong>a<br />
Polycera quadriline<strong>at</strong>a<br />
Aeolidia papillosa<br />
BIVALVIA Mytilus edulis<br />
Modiolarca tumida<br />
Heteranomia squamula<br />
Thracia phaseolina<br />
BRYOZOA Bryozoa indet.<br />
Electra pilosa<br />
Alcyonidium sp.<br />
ECHINODERMATA Asterias rubens<br />
Ophiura albida<br />
Strongylocentrotus<br />
droebachiensis<br />
Total<br />
NNE 02<br />
g/m² Kol Sum %<br />
NNE 04<br />
g/m² Kol Sum %<br />
NNE 06<br />
g/m² Kol Sum %<br />
NNE 08<br />
g/m² Kol Sum %<br />
NNE 10<br />
g/m² Kol Sum %<br />
NNE Bottom<br />
g/m² Kol Sum %<br />
Transect<br />
Turbine tower, vertical<br />
SSW 02<br />
g/m² Kol Sum %<br />
SSW 04<br />
g/m² Kol Sum %<br />
SSW 06<br />
g/m² Kol Sum %<br />
SSW 08<br />
g/m² Kol Sum %<br />
SSW 10<br />
g/m² Kol Sum %<br />
SSW Bottom<br />
g/m² Kol Sum %<br />
.006 .0% .087 .1% .115 .0% . . . . .097 .1% .199 .1% .021 .0% .008 .0% .002 .0% . . .068 .0%<br />
. . .090 .1% .034 .0% . . . . .028 .0% . . . . . . . . . . . .<br />
.011 .0% .010 .0% .006 .0% . . . . .013 .0% .002 .0% . . .010 .0% . . . . .014 .0%<br />
1.121 .9% .603 .4% 6.837 1.9% 3.713 .1% . . .150 .1% 1.414 .6% .036 .0% 2.712 .0% . . . . .455 .3%<br />
. . . . . . .047 .0% . . . . . . . . .353 .0% .915 .0% . . . .<br />
.005 .0% .001 .0% .003 .0% . . . . .002 .0% .000 .0% .004 .0% .002 .0% . . . . .002 .0%<br />
. . . . . . . . . . . . . . . . .670 .0% . . . . . .<br />
.005 .0% .014 .0% .010 .0% . . . . .006 .0% .012 .0% . . .258 .0% . . . . . .<br />
. . . . .002 .0% . . . . . . .001 .0% . . .015 .0% . . . . . .<br />
.062 .1% .043 .0% .045 .0% .028 .0% . . .080 .0% .031 .0% .225 .1% .090 .0% .022 .0% . . .051 .0%<br />
. . . . . . . . . . . . . . . . .001 .0% . . . . . .<br />
. . . . . . .076 .0% . . . . . . . . . . .031 .0% . . . .<br />
.000 .0% . . . . .001 .0% . . . . . . .001 .0% . . .000 .0% . . .000 .0%<br />
. . . . . . . . . . .007 .0% . . . . . . . . . . . .<br />
1.634 1.3% .903 .6% .303 .1% . . . . 1.900 1.1% 1.813 .8% 1.703 .9% .340 .0% . . . . 1.897 1.3%<br />
.034 .0% . . . . . . . . . . . . . . . . . . . . .012 .0%<br />
. . . . 39.555 11.3% 69.603 1.3% 274.015 99.2% . . 63.389 26.2% . . .007 .0% 24.983 .8% 411.878 80.4% 10.180 7.2%<br />
.395 .3% .121 .1% .108 .0% . . . . .012 .0% .235 .1% .295 .2% .491 .0% . . . . .037 .0%<br />
.766 .6% 1.422 .9% 2.253 .6% 2.073 .0% . . 2.927 1.7% 1.090 .5% 1.193 .7% 2.790 .0% 1.179 .0% . . 2.123 1.5%<br />
65.592 54.1% 58.361 36.1% 112.513 32.1% 89.272 1.6% 1.445 .5% 85.875 48.6% 53.985 22.3% 78.682 43.6% 79.963 1.0% 82.019 2.6% 99.053 19.3% 78.985 55.7%<br />
27.495 22.7% 17.946 11.1% 14.768 4.2% 10.894 .2% .020 .0% 14.321 8.1% 14.402 6.0% 16.805 9.3% 20.092 .3% 13.233 .4% .006 .0% 4.155 2.9%<br />
.058 .0% .028 .0% .002 .0% .210 .0% .755 .3% .102 .1% . . . . .003 .0% .507 .0% 1.496 .3% .004 .0%<br />
.009 .0% .032 .0% .113 .0% .273 .0% . . .047 .0% .053 .0% .058 .0% .132 .0% .256 .0% . . .072 .1%<br />
16.398 13.5% 75.429 46.7% .001 .0% 64.967 1.2% . . .018 .0% 90.566 37.5% 68.867 38.2% 16.994 .2% .022 .0% . . 6.617 4.7%<br />
. . . . . . .004 .0% . . . . . . . . . . . . . . . .<br />
. . . . . . . . . . . . . . .159 .1% . . . . . . . .<br />
.009 .0% .003 .0% .008 .0% . . . . .002 .0% .010 .0% .011 .0% . . . . . . .006 .0%<br />
.160 .1% .252 .2% .271 .1% .068 .0% . . .045 .0% .071 .0% .175 .1% .117 .0% .031 .0% . . .043 .0%<br />
.070 .1% .173 .1% .058 .0% .226 .0% . . .078 .0% .048 .0% .165 .1% .317 .0% .008 .0% . . . .<br />
.517 .4% .101 .1% 167.030 47.6% 5304.660 95.6% .006 .0% .077 .0% .123 .1% .339 .2% 7557.190 98.3% 3047.285 96.1% . . .133 .1%<br />
. . . . . . .005 .0% . . .010 .0% . . . . . . .004 .0% . . . .<br />
. . . . .014 .0% . . . . . . . . . . . . . . . . . .<br />
. . . . . . .090 .0% . . . . . . . . . . . . . . . .<br />
. . . . . . .109 .0% . . . . . . . . . . . . . . . .<br />
.496 .4% .975 .6% 2.121 .6% .206 .0% . . 1.524 .9% .963 .4% 1.034 .6% .638 .0% .781 .0% . . .569 .4%<br />
.125 .1% .418 .3% .371 .1% . . . . .075 .0% 3.258 1.3% .062 .0% .001 .0% .084 .0% . . .213 .2%<br />
6.181 5.1% 4.491 2.8% 4.377 1.2% 1.553 .0% . . 69.323 39.2% 9.965 4.1% 10.587 5.9% 2.318 .0% .231 .0% . . 36.075 25.5%<br />
. . .003 .0% . . . . . . .001 .0% . . . . . . . . . . .001 .0%<br />
. . . . .041 .0% . . . . . . . . .075 .0% . . . . . . . .<br />
121.150 100.0% 161.506 100.0% 350.960 100.0% 5548.076 100.0% 276.241 100.0% 176.721 100.0% 241.631 100.0% 180.497 100.0% 7685.512 100.0% 3171.592 100.0% 512.433 100.0% 141.711 100.0%<br />
<strong>Horns</strong> <strong>Rev</strong>. <strong>Benthic</strong> communities Page 128<br />
.
Doc. No. 2572-03-005 rev. 4<br />
2005-Spring<br />
HYDROZOA Tubularia indivisa<br />
Hydractinia echin<strong>at</strong>a<br />
Campanulariidae indet.<br />
ANTHOZOA Actiniaria indet.<br />
NEMERTINI Nemertini indet.<br />
NEMATODA Nem<strong>at</strong>oda indet.<br />
POLYCHAETA Lepidonotus squam<strong>at</strong>us<br />
Harmothoe imbric<strong>at</strong>a<br />
Harmothoe impar<br />
Eulalia viridis<br />
Hesionidae indet.<br />
Ophiodromus flexuosus<br />
Syllidae indet.<br />
Chaetopterus norvegicus<br />
Pom<strong>at</strong>oceros triqueter<br />
CRUSTACEA Verruca stroemia<br />
Balanus balanus<br />
Balanus cren<strong>at</strong>us<br />
Cancer pagurus<br />
Pisidia longicornis<br />
Jassa marmor<strong>at</strong>a<br />
Atylus swammerdami<br />
Caprella linearis<br />
CHIRONOMIDAE Telm<strong>at</strong>ogeton japonicus<br />
GASTROPODA Tectura testudinalis<br />
Rissoidae indet.<br />
Crepidula fornic<strong>at</strong>a<br />
Polinices polianus<br />
Onchidoris muric<strong>at</strong>a<br />
Polycera quadriline<strong>at</strong>a<br />
Facelina bostoniensis<br />
Aeolidia papillosa<br />
BIVALVIA Mytilus edulis<br />
Heteranomia squamula<br />
Hi<strong>at</strong>ella arctica<br />
BRYOZOA Bryozoa indet.<br />
Electra pilosa<br />
Alcyonidium sp.<br />
ECHINODERMATA Asterias rubens<br />
Strongylocentrotus<br />
droebachiensis<br />
Total<br />
NNE 02<br />
g/m² Kol Sum %<br />
NNE 04<br />
g/m² Kol Sum %<br />
NNE 06<br />
g/m² Kol Sum %<br />
NNE 08<br />
g/m² Kol Sum %<br />
NNE 10<br />
g/m² Kol Sum %<br />
NNE Bottom<br />
g/m² Kol Sum %<br />
Transect<br />
Turbine tower, vertical<br />
SSW 02<br />
g/m² Kol Sum %<br />
SSW 04<br />
g/m² Kol Sum %<br />
SSW 06<br />
g/m² Kol Sum %<br />
SSW 08<br />
g/m² Kol Sum %<br />
SSW 10<br />
g/m² Kol Sum %<br />
SSW Bottom<br />
g/m² Kol Sum %<br />
.312 .2% .060 .0% .085 .0% . . . . .308 .5% .028 .0% .051 .0% .010 .0% . . . . .363 1.1%<br />
.050 .0% .143 .1% . . . . . . . . .000 .0% .253 .2% . . . . . . .004 .0%<br />
. . . . .018 .0% . . . . . . .000 .0% . . .008 .0% .000 .0% . . .093 .3%<br />
.214 .1% 6.799 4.9% 4.400 .1% . . . . .474 .8% .302 .2% .151 .1% .017 .0% . . . . 12.065 35.9%<br />
. . .000 .0% .743 .0% . . . . . . . . . . .085 .0% . . . . . .<br />
.002 .0% .000 .0% .035 .0% .000 .0% .001 .0% .002 .0% .005 .0% .004 .0% .010 .0% .001 .0% . . .003 .0%<br />
. . . . .732 .0% . . . . . . . . . . . . . . . . . .<br />
. . . . .960 .0% . . . . . . . . . . .761 .0% . . . . . .<br />
. . . . .008 .0% . . . . . . . . . . .266 .0% . . . . . .<br />
.141 .1% .156 .1% .447 .0% . . . . .275 .5% .507 .3% .299 .2% .099 .0% .000 .0% . . .146 .4%<br />
. . .005 .0% . . . . . . . . . . . . . . . . . . . .<br />
.011 .0% . . . . . . . . .009 .0% . . . . . . . . . . . .<br />
. . . . .001 .0% . . . . . . . . . . . . . . . . . .<br />
.003 .0% . . . . . . . . . . . . . . . . . . . . . .<br />
.943 .5% .565 .4% .396 .0% . . . . 1.241 2.2% 2.876 1.5% 2.223 1.4% 2.424 .0% . . . . .559 1.7%<br />
. . .024 .0% . . . . . . .113 .2% . . .011 .0% .007 .0% .002 .0% . . . .<br />
7.970 4.5% .016 .0% .918 .0% . . . . . . . . 28.132 17.3% . . 10.534 .3% . . . .<br />
. . .137 .1% .057 .0% . . . . .013 .0% . . . . . . . . . . . .<br />
.528 .3% .178 .1% 9.335 .1% . . . . . . .286 .1% . . 11.809 .1% .333 .0% . . . .<br />
. . . . .155 .0% . . . . . . . . . . .012 .0% . . . . . .<br />
13.418 7.6% 11.027 7.9% 8.398 .1% 4.178 31.2% .006 .2% 9.072 15.8% 9.462 4.8% 8.947 5.5% 12.836 .2% 2.445 .1% .006 .1% 5.993 17.8%<br />
. . . . . . . . . . .005 .0% . . . . . . . . . . . .<br />
7.023 4.0% 3.233 2.3% 1.936 .0% .001 .0% . . 1.045 1.8% 4.120 2.1% 4.285 2.6% 1.387 .0% .023 .0% . . .359 1.1%<br />
. . . . .001 .0% 1.671 12.5% 3.600 99.8% .000 .0% . . . . .001 .0% 1.828 .1% 5.653 99.9% . .<br />
. . . . . . . . . . . . . . .025 .0% . . . . . . .000 .0%<br />
. . . . .117 .0% . . . . .007 .0% . . . . .038 .0% .011 .0% . . .009 .0%<br />
130.888 74.1% 110.337 79.5% 7.352 .1% 6.161 46.1% . . . . 170.915 87.4% 113.642 69.8% 27.638 .3% . . . . .005 .0%<br />
. . . . . . .003 .0% . . . . . . . . . . . . . . . .<br />
.068 .0% .384 .3% .343 .0% . . . . .159 .3% .044 .0% . . .383 .0% . . . . .061 .2%<br />
. . . . .022 .0% . . . . . . . . .017 .0% . . . . . . . .<br />
. . . . .005 .0% . . . . .003 .0% . . .002 .0% .005 .0% .000 .0% . . .001 .0%<br />
. . . . . . . . . . . . .013 .0% . . .001 .0% . . . . . .<br />
.114 .1% .274 .2% 8141.941 99.4% .740 5.5% . . .169 .3% .092 .0% .190 .1% 8332.859 99.2% 3553.848 99.6% . . .018 .1%<br />
. . . . . . . . . . .172 .3% . . . . . . . . . . . .<br />
. . . . .571 .0% . . . . . . . . . . . . . . . . . .<br />
. . . . . . . . . . . . . . . . . . . . . . .025 .1%<br />
.167 .1% .086 .1% .284 .0% .032 .2% . . .178 .3% .683 .3% .743 .5% .423 .0% .058 .0% . . .030 .1%<br />
10.348 5.9% .265 .2% .459 .0% . . . . .130 .2% 5.500 2.8% 1.466 .9% .720 .0% . . . . 1.166 3.5%<br />
4.434 2.5% 5.059 3.6% 10.247 .1% .584 4.4% . . 44.139 76.7% .740 .4% 2.406 1.5% 5.553 .1% . . . . 12.735 37.9%<br />
. . . . . . . . . . . . . . . . 1.770 .0% . . . . . .<br />
176.633 100.0% 138.747 100.0% 8189.963 100.0% 13.371 100.0% 3.608 100.0% 57.514 100.0% 195.573 100.0% 162.847 100.0% 8399.123 100.0% 3569.084 100.0% 5.659 100.0% 33.634 100.0%<br />
<strong>Horns</strong> <strong>Rev</strong>. <strong>Benthic</strong> communities Page 129<br />
.
Doc. No. 2572-03-005 rev. 4<br />
2005-Autumn<br />
PORIFERA Porifera indet.<br />
Halichondria panicea<br />
HYDROZOA Tubularia indivisa<br />
Hydractinia echin<strong>at</strong>a<br />
Campanulariidae indet.<br />
Sertularia cupressina<br />
ANTHOZOA Alcyonium digit<strong>at</strong>um<br />
Actiniaria indet.<br />
NEMERTINI Nemertini indet.<br />
NEMATODA Nem<strong>at</strong>oda indet.<br />
POLYCHAETA Lepidonotus squam<strong>at</strong>us<br />
Harmothoe imbric<strong>at</strong>a<br />
Harmothoe impar<br />
Phyllodoce groenl<strong>and</strong>ica<br />
Eulalia viridis<br />
Polydora cornuta<br />
Chaetopterus norvegicus<br />
Pom<strong>at</strong>oceros triqueter<br />
CRUSTACEA Harpacticoida indet.<br />
Verruca stroemia<br />
Balanus balanus<br />
Cancer pagurus<br />
Pilumnus hirtellus<br />
Pisidia longicornis<br />
Stenothoe sp.<br />
Jassa marmor<strong>at</strong>a<br />
Atylus swammerdami<br />
Caprella linearis<br />
CHIRONOMIDAE Telm<strong>at</strong>ogeton japonicus<br />
GASTROPODA Rissoidae indet.<br />
Crepidula fornic<strong>at</strong>a<br />
Polinices polianus<br />
Nudibranchia indet.<br />
Onchidoris muric<strong>at</strong>a<br />
Polycera quadriline<strong>at</strong>a<br />
Facelina bostoniensis<br />
Aeolidia papillosa<br />
BIVALVIA Mytilus edulis<br />
Tridonta borealis<br />
Angulus tenuis<br />
Fabulina fabula<br />
Moerella pygmaea<br />
Donax vitt<strong>at</strong>us<br />
Hi<strong>at</strong>ella arctica<br />
Phaxas pellucidus<br />
BRYOZOA Electra pilosa<br />
Alcyonidium sp.<br />
ECHINODERMATA Asterias rubens<br />
Strongylocentrotus<br />
droebachiensis<br />
Total<br />
NNE 02<br />
g/m² Kol Sum %<br />
NNE 04<br />
g/m² Kol Sum %<br />
NNE 06<br />
g/m² Kol Sum %<br />
NNE 08<br />
g/m² Kol Sum %<br />
NNE Bottom<br />
g/m² Kol Sum %<br />
Transect<br />
Turbine tower, vertical<br />
SSW 02<br />
g/m² Kol Sum %<br />
SSW 04<br />
g/m² Kol Sum %<br />
SSW 06<br />
g/m² Kol Sum %<br />
SSW 08<br />
g/m² Kol Sum %<br />
SSW Bottom<br />
g/m² Kol Sum %<br />
. . .001 .0% . . . . . . . . . . . . . . . .<br />
. . . . . . . . .160 .1% . . . . . . . . . .<br />
.629 .4% .671 .4% .222 .0% .045 .0% .102 .1% .125 .0% .733 .3% .657 .0% .145 .0% .215 .1%<br />
.162 .1% .088 .0% . . . . .070 .0% .005 .0% .093 .0% . . . . .333 .1%<br />
.027 .0% .017 .0% .018 .0% . . .005 .0% .049 .0% .054 .0% . . . . .018 .0%<br />
. . . . . . . . .005 .0% . . . . . . . . . .<br />
. . . . . . . . . . . . . . . . . . .106 .0%<br />
13.521 7.9% 43.431 23.5% 4.807 .1% .063 .0% 2.697 1.8% 52.085 9.8% 2.627 1.0% 9.294 .1% .290 .0% 4.483 1.8%<br />
.031 .0% .040 .0% 3.175 .0% 11.325 .1% .002 .0% .020 .0% .048 .0% .146 .0% 1.784 .0% .000 .0%<br />
.004 .0% .021 .0% .014 .0% .049 .0% .004 .0% .002 .0% .007 .0% .013 .0% .008 .0% .014 .0%<br />
. . . . . . . . . . . . . . .687 .0% . . . .<br />
. . . . . . . . . . . . . . .130 .0% . . . .<br />
.018 .0% .001 .0% .079 .0% .028 .0% .006 .0% .000 .0% .006 .0% .107 .0% .016 .0% .016 .0%<br />
. . . . .000 .0% . . . . . . . . . . . . . .<br />
.116 .1% .246 .1% .677 .0% .191 .0% .179 .1% .303 .1% .203 .1% .415 .0% .117 .0% .218 .1%<br />
. . . . . . . . . . .005 .0% . . . . . . . .<br />
. . . . . . . . . . .003 .0% . . .003 .0% . . .008 .0%<br />
.272 .2% .003 .0% . . . . 1.894 1.2% 1.605 .3% .284 .1% .191 .0% . . .857 .3%<br />
. . . . . . . . .001 .0% . . . . . . . . . .<br />
.270 .2% .349 .2% .126 .0% . . .469 .3% .186 .0% .270 .1% .055 .0% . . .407 .2%<br />
1.613 .9% 1.115 .6% 596.981 8.4% 1165.937 13.0% .618 .4% 64.273 12.1% 33.187 12.7% 3.554 .0% .005 .0% .411 .2%<br />
.380 .2% .458 .2% 2.673 .0% .717 .0% .408 .3% .485 .1% .386 .1% 233.313 2.1% .313 .0% 1.385 .6%<br />
. . . . .663 .0% . . . . . . . . .557 .0% . . . .<br />
. . .001 .0% .004 .0% . . .000 .0% . . . . . . . . . .<br />
. . . . . . . . . . .007 .0% . . . . . . .007 .0%<br />
43.552 25.6% 88.963 48.2% 93.848 1.3% 51.235 .6% 104.763 68.6% 58.593 11.1% 67.921 26.0% 117.427 1.0% 37.220 .3% 56.387 22.5%<br />
.005 .0% .008 .0% .003 .0% . . .004 .0% .008 .0% .007 .0% .002 .0% . . .029 .0%<br />
13.994 8.2% 19.416 10.5% 44.969 .6% .085 .0% 11.185 7.3% 16.258 3.1% 11.135 4.3% 31.919 .3% .006 .0% 9.844 3.9%<br />
.003 .0% . . . . .369 .0% .015 .0% .008 .0% .016 .0% .004 .0% .346 .0% . .<br />
.024 .0% .008 .0% .011 .0% .063 .0% .068 .0% .032 .0% .003 .0% .021 .0% .050 .0% .110 .0%<br />
83.133 48.9% 24.071 13.0% 21.898 .3% . . 1.019 .7% 274.696 51.8% 141.126 54.1% 87.810 .8% .003 .0% 150.608 60.0%<br />
. . .001 .0% . . . . . . . . . . . . . . . .<br />
. . . . . . . . .003 .0% . . . . . . . . . .<br />
. . . . . . . . . . . . . . .004 .0% . . .008 .0%<br />
.132 .1% .136 .1% .305 .0% .045 .0% .045 .0% .070 .0% .086 .0% .782 .0% . . .031 .0%<br />
.326 .2% .159 .1% .100 .0% . . .096 .1% .100 .0% .131 .1% .105 .0% .008 .0% .070 .0%<br />
. . . . . . . . . . .008 .0% .125 .0% .003 .0% . . . .<br />
1.023 .6% 1.976 1.1% 6212.836 87.5% 7762.355 86.3% .919 .6% 1.332 .3% 1.742 .7% 10808.119 95.2% 13439.083 99.7% 1.423 .6%<br />
. . . . . . . . . . .005 .0% . . . . . . . .<br />
. . . . . . . . . . .000 .0% . . . . . . . .<br />
. . . . . . . . . . .001 .0% . . . . . . . .<br />
. . . . . . . . . . . . . . .009 .0% . . .001 .0%<br />
. . . . . . .008 .0% . . . . . . . . . . . .<br />
. . .003 .0% .017 .0% .078 .0% .011 .0% .005 .0% .000 .0% .019 .0% .008 .0% . .<br />
. . . . . . . . . . .005 .0% . . . . . . . .<br />
.847 .5% .820 .4% .461 .0% .057 .0% .755 .5% .841 .2% .711 .3% .476 .0% .049 .0% .284 .1%<br />
6.982 4.1% 2.604 1.4% 1.134 .0% .033 .0% 3.702 2.4% 52.255 9.9% . . 2.217 .0% . . 4.506 1.8%<br />
3.107 1.8% .005 .0% 114.630 1.6% . . 23.545 15.4% 6.762 1.3% . . 57.663 .5% . . 19.263 7.7%<br />
. . . . . . . . .006 .0% . . . . .007 .0% . . .020 .0%<br />
170.169 100.0% 184.612 100.0% 7099.651 100.0% 8992.683 100.0% 152.756 100.0% 530.131 100.0% 260.901 100.0% 11355.707 100.0% 13479.452 100.0% 251.060 100.0%<br />
<strong>Horns</strong> <strong>Rev</strong>. <strong>Benthic</strong> communities Page 130<br />
.
Doc. No. 2572-03-005 rev. 4<br />
8.4.7. Appendix 4.8. mean biomass DW. Scour protections 2003-2005<br />
2003<br />
Spring<br />
HYDROZOA Hydrozoa indet.<br />
Thec<strong>at</strong>a indet.<br />
Campanulariidae indet.<br />
ANTHOZOA Anthozoa indet.<br />
Actiniaria indet.<br />
NEMERTINI Nemertini indet.<br />
POLYCHAETA Harmothoe impar<br />
Phyllodoce groenl<strong>and</strong>ica<br />
Eulalia viridis<br />
Chaetopterus norvegicus<br />
Pom<strong>at</strong>oceros triqueter<br />
CRUSTACEA Verruca stroemia<br />
Balanus cren<strong>at</strong>us<br />
Cancer pagurus<br />
Corophium crassicorne<br />
Jassa marmor<strong>at</strong>a<br />
Caprella linearis<br />
GASTROPODA Rissoidae indet.<br />
Crepidula fornic<strong>at</strong>a<br />
Nudibranchia indet.<br />
Onchidoris muric<strong>at</strong>a<br />
BIVALVIA Bivalvia indet.<br />
Mytilus edulis<br />
Heteranomia squamula<br />
Moerella pygmaea<br />
Thracia phaseolina<br />
BRYOZOA Bryozoa indet.<br />
Electra pilosa<br />
ECHINODERMATA Asterias rubens<br />
Ophiura albida<br />
Strongylocentrotus<br />
droebachiensis<br />
Total<br />
A 0.5 NNE<br />
g/m² Kol Sum %<br />
B 02 NNE<br />
g/m² Kol Sum %<br />
Transect<br />
Found<strong>at</strong>ions, horizontal<br />
C 05 NNE<br />
g/m² Kol Sum %<br />
D 05 SSW<br />
g/m² Kol Sum %<br />
. . .003 .0% . . . .<br />
. . . . .001 .0% . .<br />
. . .002 .0% .003 .0% . .<br />
.160 .2% 1.200 1.2% . . .100 .2%<br />
.841 1.0% .881 .9% 1.802 .6% .687 1.1%<br />
.007 .0% .001 .0% . . .000 .0%<br />
.028 .0% .109 .1% .231 .1% .060 .1%<br />
.012 .0% .051 .1% .164 .1% .196 .3%<br />
.001 .0% .002 .0% .006 .0% . .<br />
. . .011 .0% .010 .0% . .<br />
.002 .0% .094 .1% .054 .0% .017 .0%<br />
.018 .0% .004 .0% . . .013 .0%<br />
60.233 69.1% 64.811 64.5% 254.586 82.8% 9.523 15.8%<br />
.012 .0% . . .034 .0% . .<br />
. . . . .002 .0% . .<br />
15.544 17.8% 16.138 16.1% 22.963 7.5% 36.402 60.3%<br />
.739 .8% 1.032 1.0% .215 .1% .053 .1%<br />
.001 .0% .011 .0% .048 .0% .005 .0%<br />
.036 .0% .092 .1% .482 .2% .044 .1%<br />
. . . . .090 .0% .004 .0%<br />
.099 .1% . . .015 .0% . .<br />
. . .006 .0% . . . .<br />
1.070 1.2% 1.292 1.3% .593 .2% 1.618 2.7%<br />
. . .006 .0% .016 .0% . .<br />
.012 .0% .022 .0% .049 .0% . .<br />
. . . . .006 .0% . .<br />
. . .086 .1% .014 .0% . .<br />
.092 .1% .590 .6% .737 .2% .112 .2%<br />
8.222 9.4% 14.085 14.0% 25.490 8.3% 11.575 19.2%<br />
. . .001 .0% .002 .0% .001 .0%<br />
. . . . . . .003 .0%<br />
87.131 100.0% 100.532 100.0% 307.614 100.0% 60.414 100.0%<br />
Autumn<br />
PORIFERA Porifera indet.<br />
HYDROZOA Tubularia indivisa<br />
Campanulariidae indet.<br />
ANTHOZOA Actiniaria indet.<br />
NEMERTINI Nemertini indet.<br />
NEMATODA Nem<strong>at</strong>oda indet.<br />
POLYCHAETA Harmothoe impar<br />
Phyllodocidae indet.<br />
Phyllodoce groenl<strong>and</strong>ica<br />
Eulalia viridis<br />
Syllidae indet.<br />
Nereididae indet.<br />
Polydora cili<strong>at</strong>a<br />
Capitella capit<strong>at</strong>a<br />
Pom<strong>at</strong>oceros triqueter<br />
PYCNOGONIDA Phoxichilidium femor<strong>at</strong>um<br />
CRUSTACEA Verruca stroemia<br />
Balanus cren<strong>at</strong>us<br />
Cancer pagurus<br />
Stenothoe marina<br />
Jassa marmor<strong>at</strong>a<br />
Atylus swammerdami<br />
Caprella linearis<br />
Hyperia galba<br />
CHIRONOMIDAE Telm<strong>at</strong>ogeton japonicus<br />
GASTROPODA Rissoidae indet.<br />
Crepidula fornic<strong>at</strong>a<br />
Polinices sp.<br />
Nudibranchia indet.<br />
Onchidoris muric<strong>at</strong>a<br />
BIVALVIA Mytilus edulis<br />
Moerella pygmaea<br />
Hi<strong>at</strong>ella arctica<br />
BRYOZOA Bryozoa indet.<br />
Electra pilosa<br />
ECHINODERMATA Asterias rubens<br />
Strongylocentrotus<br />
droebachiensis<br />
Total<br />
A 0.5 NNE<br />
g/m² Kol Sum %<br />
B 02 NNE<br />
g/m² Kol Sum %<br />
Transect<br />
Found<strong>at</strong>ions, horizontal<br />
C 05 NNE<br />
g/m² Kol Sum %<br />
D 05 SSW<br />
g/m² Kol Sum %<br />
. . . . .001 .0% . .<br />
.712 1.9% .848 1.7% .439 1.2% .926 2.3%<br />
.023 .1% .027 .1% .029 .1% .026 .1%<br />
8.175 21.6% 15.602 31.9% 16.031 42.8% 7.703 19.0%<br />
.002 .0% . . .008 .0% .003 .0%<br />
.001 .0% .001 .0% .001 .0% .001 .0%<br />
. . . . .002 .0% . .<br />
. . .000 .0% . . . .<br />
.011 .0% .005 .0% .020 .1% .009 .0%<br />
.001 .0% .001 .0% . . . .<br />
. . . . . . .001 .0%<br />
.000 .0% . . . . . .<br />
. . . . .000 .0% . .<br />
. . .003 .0% .000 .0% . .<br />
.055 .1% .198 .4% .159 .4% .264 .7%<br />
.001 .0% . . . . . .<br />
.005 .0% .029 .1% .046 .1% .008 .0%<br />
.233 .6% .268 .5% .165 .4% .963 2.4%<br />
.005 .0% .009 .0% .053 .1% .024 .1%<br />
.001 .0% . . . . . .<br />
6.957 18.4% 5.683 11.6% 5.025 13.4% 8.939 22.1%<br />
. . .001 .0% . . . .<br />
1.070 2.8% .585 1.2% .278 .7% .786 1.9%<br />
.001 .0% . . . . . .<br />
.002 .0% . . . . . .<br />
.165 .4% .154 .3% .117 .3% .116 .3%<br />
.228 .6% 3.439 7.0% .779 2.1% 4.558 11.3%<br />
. . . . .001 .0% . .<br />
.005 .0% .012 .0% .008 .0% .017 .0%<br />
.009 .0% .010 .0% .010 .0% .058 .1%<br />
.063 .2% .125 .3% .078 .2% 2.106 5.2%<br />
. . . . .001 .0% .001 .0%<br />
. . .000 .0% .004 .0% .001 .0%<br />
.013 .0% .066 .1% .156 .4% . .<br />
.804 2.1% .436 .9% .515 1.4% .792 2.0%<br />
19.299 51.0% 21.475 43.8% 13.560 36.2% 13.189 32.6%<br />
.002 .0% .000 .0% .002 .0% . .<br />
37.844 100.0% 48.977 100.0% 37.489 100.0% 40.490 100.0%<br />
<strong>Horns</strong> <strong>Rev</strong>. <strong>Benthic</strong> communities Page 131<br />
.
Doc. No. 2572-03-005 rev. 4<br />
2004<br />
Spring<br />
PORIFERA Halichondria panicea<br />
HYDROZOA Tubularia indivisa<br />
Campanulariidae indet.<br />
ANTHOZOA Alcyonium digit<strong>at</strong>um<br />
Actiniaria indet.<br />
NEMERTINI Nemertini indet.<br />
POLYCHAETA Phyllodoce groenl<strong>and</strong>ica<br />
Eulalia viridis<br />
Syllidae indet.<br />
Polydora cili<strong>at</strong>a<br />
Capitella capit<strong>at</strong>a<br />
Pom<strong>at</strong>oceros triqueter<br />
CRUSTACEA Verruca stroemia<br />
Balanus cren<strong>at</strong>us<br />
Corystes cassivelaunus<br />
Cancer pagurus<br />
Jassa marmor<strong>at</strong>a<br />
Caprella linearis<br />
GASTROPODA Rissoidae indet.<br />
Crepidula fornic<strong>at</strong>a<br />
Nudibranchia indet.<br />
Onchidoris muric<strong>at</strong>a<br />
Polycera quadriline<strong>at</strong>a<br />
Aeolidia papillosa<br />
BIVALVIA Mytilus edulis<br />
Goodallia triangularis<br />
Hi<strong>at</strong>ella arctica<br />
BRYOZOA Electra pilosa<br />
Alcyonidium sp.<br />
ECHINODERMATA Asterias rubens<br />
Total<br />
A 0.5 NNE<br />
g/m² Kol Sum %<br />
Transect<br />
Found<strong>at</strong>ions, horizontal<br />
B 02 NNE<br />
g/m² Kol Sum %<br />
C 05 NNE<br />
g/m² Kol Sum %<br />
D 05 SSW<br />
g/m² Kol Sum %<br />
. . .003 .0% .033 .1% . .<br />
.097 .3% .000 .0% . . .016 .0%<br />
.008 .0% .004 .0% .002 .0% .009 .0%<br />
. . .126 .3% .079 .2% . .<br />
2.712 8.2% 7.981 20.3% 17.445 34.4% 4.558 11.3%<br />
.014 .0% .008 .0% .015 .0% .011 .0%<br />
.002 .0% .027 .1% .029 .1% .028 .1%<br />
.001 .0% . . .001 .0% . .<br />
. . .001 .0% .002 .0% . .<br />
. . .001 .0% . . . .<br />
.001 .0% .003 .0% . . . .<br />
.125 .4% .046 .1% .350 .7% .270 .7%<br />
. . . . .007 .0% .009 .0%<br />
.005 .0% .009 .0% .309 .6% .005 .0%<br />
. . .001 .0% .002 .0% . .<br />
. . . . . . .003 .0%<br />
21.801 66.0% 15.577 39.6% 14.949 29.5% 15.071 37.4%<br />
1.573 4.8% .812 2.1% .282 .6% .307 .8%<br />
.018 .1% .103 .3% .103 .2% .013 .0%<br />
.001 .0% .807 2.0% 2.486 4.9% 4.196 10.4%<br />
.013 .0% . . .006 .0% .020 .1%<br />
.044 .1% .001 .0% .001 .0% . .<br />
.002 .0% .044 .1% .063 .1% .019 .0%<br />
.002 .0% .020 .1% .059 .1% .009 .0%<br />
.052 .2% .221 .6% .123 .2% .044 .1%<br />
.002 .0% . . . . . .<br />
. . . . .019 .0% .011 .0%<br />
.576 1.7% .571 1.5% .252 .5% .263 .7%<br />
.013 .0% .014 .0% . . . .<br />
5.958 18.0% 12.985 33.0% 14.078 27.8% 15.386 38.2%<br />
33.019 100.0% 39.365 100.0% 50.694 100.0% 40.250 100.0%<br />
Autumn<br />
PORIFERA Porifera indet.<br />
HYDROZOA Tubularia indivisa<br />
Campanulariidae indet.<br />
Sertularia cupressina<br />
ANTHOZOA Alcyonium digit<strong>at</strong>um<br />
Actiniaria indet.<br />
NEMERTINI Nemertini indet.<br />
NEMATODA Nem<strong>at</strong>oda indet.<br />
POLYCHAETA Phyllodoce groenl<strong>and</strong>ica<br />
Eulalia viridis<br />
Nereis pelagica<br />
Polydora cili<strong>at</strong>a<br />
Cirr<strong>at</strong>ulidae indet.<br />
Terebellidae indet.<br />
Lanice conchilega<br />
Sabellaria sp.<br />
Pom<strong>at</strong>oceros triqueter<br />
CRUSTACEA Verruca stroemia<br />
Balanus cren<strong>at</strong>us<br />
Cancer pagurus<br />
Liocarcinus depur<strong>at</strong>or<br />
Jassa marmor<strong>at</strong>a<br />
Caprella linearis<br />
GASTROPODA Rissoidae indet.<br />
Crepidula fornic<strong>at</strong>a<br />
Hinia pygmaea<br />
Nudibranchia indet.<br />
Onchidoris muric<strong>at</strong>a<br />
Polycera quadriline<strong>at</strong>a<br />
Aeolidia papillosa<br />
BIVALVIA Mytilus edulis<br />
Angulus tenuis<br />
Moerella pygmaea<br />
Hi<strong>at</strong>ella arctica<br />
BRYOZOA Bryozoa indet.<br />
Electra pilosa<br />
Alcyonidium sp.<br />
ECHINODERMATA Asterias rubens<br />
Ophiura albida<br />
Strongylocentrotus<br />
droebachiensis<br />
Total<br />
A 0.5 NNE<br />
g/m² Kol Sum %<br />
Transect<br />
Found<strong>at</strong>ions, horizontal<br />
B 02 NNE<br />
g/m² Kol Sum %<br />
C 05 NNE<br />
g/m² Kol Sum %<br />
D 05 SSW<br />
g/m² Kol Sum %<br />
. . . . . . .016 .0%<br />
.317 .5% .052 .1% .138 .2% .033 .0%<br />
.003 .0% .011 .0% .017 .0% .001 .0%<br />
.004 .0% . . . . .024 .0%<br />
2.388 3.7% .743 1.0% 2.023 3.5% 1.320 1.5%<br />
5.036 7.7% 8.270 10.8% 15.237 26.3% 2.004 2.3%<br />
. . . . . . .004 .0%<br />
.002 .0% .003 .0% .001 .0% .001 .0%<br />
.018 .0% .003 .0% .020 .0% .015 .0%<br />
.012 .0% .003 .0% .015 .0% .029 .0%<br />
. . . . . . .004 .0%<br />
. . . . . . .000 .0%<br />
. . .000 .0% . . . .<br />
. . . . . . .014 .0%<br />
. . . . .003 .0% . .<br />
. . . . .003 .0% . .<br />
.374 .6% .418 .5% .658 1.1% .346 .4%<br />
.043 .1% .034 .0% .207 .4% .210 .2%<br />
1.875 2.9% .051 .1% .267 .5% .345 .4%<br />
.733 1.1% .644 .8% .555 1.0% .532 .6%<br />
.011 .0% . . . . . .<br />
32.984 50.6% 39.311 51.5% 16.855 29.1% 63.250 72.6%<br />
.608 .9% .324 .4% .488 .8% 1.650 1.9%<br />
.036 .1% .056 .1% .030 .1% .112 .1%<br />
6.200 9.5% 13.524 17.7% 11.434 19.7% 3.553 4.1%<br />
.005 .0% .008 .0% .036 .1% .025 .0%<br />
.017 .0% . . . . .018 .0%<br />
.002 .0% . . .000 .0% .003 .0%<br />
.022 .0% . . .007 .0% .018 .0%<br />
.048 .1% .007 .0% .110 .2% . .<br />
.194 .3% .284 .4% .078 .1% .102 .1%<br />
.000 .0% .001 .0% .000 .0% .001 .0%<br />
.004 .0% . . . . . .<br />
. . .000 .0% . . . .<br />
. . . . .040 .1% . .<br />
.713 1.1% .177 .2% .329 .6% .754 .9%<br />
.005 .0% .026 .0% .042 .1% . .<br />
13.473 20.7% 12.374 16.2% 9.324 16.1% 12.752 14.6%<br />
.005 .0% .005 .0% .007 .0% .013 .0%<br />
.013 .0% .001 .0% .031 .1% . .<br />
65.145 100.0% 76.331 100.0% 57.956 100.0% 87.151 100.0%<br />
<strong>Horns</strong> <strong>Rev</strong>. <strong>Benthic</strong> communities Page 132<br />
.
Doc. No. 2572-03-005 rev. 4<br />
2005<br />
Spring<br />
HYDROZOA Tubularia indivisa<br />
Hydractinia echin<strong>at</strong>a<br />
Campanulariidae indet.<br />
Sertularia cupressina<br />
ANTHOZOA Alcyonium digit<strong>at</strong>um<br />
Actiniaria indet.<br />
NEMERTINI Nemertini indet.<br />
NEMATODA Nem<strong>at</strong>oda indet.<br />
POLYCHAETA Harmothoe impar<br />
Phyllodoce groenl<strong>and</strong>ica<br />
Eulalia viridis<br />
Hesionidae indet.<br />
Ophiodromus flexuosus<br />
Polydora cili<strong>at</strong>a<br />
Pom<strong>at</strong>oceros triqueter<br />
CRUSTACEA Verruca stroemia<br />
Balanus balanus<br />
Balanus sp.<br />
Cancer pagurus<br />
Jassa marmor<strong>at</strong>a<br />
Caprella linearis<br />
CHIRONOMIDAE Telm<strong>at</strong>ogeton japonicus<br />
GASTROPODA Tectura testudinalis<br />
Rissoidae indet.<br />
Crepidula fornic<strong>at</strong>a<br />
Epitonium cl<strong>at</strong>hrus<br />
Onchidoris muric<strong>at</strong>a<br />
Polycera quadriline<strong>at</strong>a<br />
Facelina bostoniensis<br />
BIVALVIA Mytilus edulis<br />
Thracia phaseolina<br />
BRYOZOA Bryozoa indet.<br />
Electra pilosa<br />
Alcyonidium sp.<br />
ECHINODERMATA Asterias rubens<br />
Ophiura albida<br />
Total<br />
A 0.5 NNE<br />
g/m² Kol Sum %<br />
Transect<br />
Found<strong>at</strong>ions, horizontal<br />
B 02 NNE<br />
g/m² Kol Sum %<br />
C 05 NNE<br />
g/m² Kol Sum %<br />
D 05 SSW<br />
g/m² Kol Sum %<br />
.111 .5% .852 2.3% .085 .2% .059 .1%<br />
. . .006 .0% .009 .0% . .<br />
.010 .0% .003 .0% .000 .0% .004 .0%<br />
. . .001 .0% . . . .<br />
.377 1.8% .021 .1% 2.533 4.8% 1.028 1.4%<br />
5.191 25.2% 9.322 25.3% 15.809 30.1% 10.914 14.7%<br />
. . . . . . .001 .0%<br />
.008 .0% .005 .0% .006 .0% .012 .0%<br />
.009 .0% . . .023 .0% .001 .0%<br />
. . . . .009 .0% .009 .0%<br />
.029 .1% .012 .0% .027 .1% .033 .0%<br />
. . . . . . .000 .0%<br />
. . .004 .0% .001 .0% .003 .0%<br />
. . .000 .0% .001 .0% . .<br />
.628 3.0% .527 1.4% 1.031 2.0% .724 1.0%<br />
.044 .2% .072 .2% .178 .3% .199 .3%<br />
. . 2.158 5.9% . . . .<br />
. . . . . . .031 .0%<br />
.032 .2% .073 .2% .012 .0% . .<br />
7.431 36.0% 12.094 32.8% 12.829 24.4% 14.348 19.4%<br />
.067 .3% .129 .3% .105 .2% 3.328 4.5%<br />
.003 .0% . . . . .003 .0%<br />
. . . . . . .012 .0%<br />
.030 .1% .092 .3% .030 .1% .094 .1%<br />
.005 .0% .533 1.4% 1.440 2.7% 24.799 33.5%<br />
. . .001 .0% . . . .<br />
. . .036 .1% .005 .0% . .<br />
. . .013 .0% .007 .0% .018 .0%<br />
.000 .0% .002 .0% .003 .0% .013 .0%<br />
.035 .2% .050 .1% .044 .1% .062 .1%<br />
. . . . .000 .0% . .<br />
.055 .3% . . . . . .<br />
.127 .6% .208 .6% .268 .5% .144 .2%<br />
.003 .0% .001 .0% .025 .0% . .<br />
6.437 31.2% 10.658 28.9% 18.092 34.4% 18.247 24.6%<br />
.000 .0% . . . . . .<br />
20.633 100.0% 36.871 100.0% 52.571 100.0% 74.086 100.0%<br />
Autumn<br />
PORIFERA Porifera indet.<br />
HYDROZOA Tubularia indivisa<br />
Hydractinia echin<strong>at</strong>a<br />
Campanulariidae indet.<br />
Sertularia cupressina<br />
ANTHOZOA Alcyonium digit<strong>at</strong>um<br />
Actiniaria indet.<br />
Actinaridae indet.<br />
NEMERTINI Nemertini indet.<br />
NEMATODA Nem<strong>at</strong>oda indet.<br />
POLYCHAETA Harmothoe impar<br />
Phyllodoce groenl<strong>and</strong>ica<br />
Eulalia viridis<br />
Syllidae indet.<br />
Polydora cornuta<br />
Chaetopterus norvegicus<br />
Arenicola marina<br />
Lanice conchilega<br />
Sabellaria spinulosa<br />
Pom<strong>at</strong>oceros triqueter<br />
CRUSTACEA Copepoda indet.<br />
Verruca stroemia<br />
Balanus balanus<br />
Balanus cren<strong>at</strong>us<br />
Cancer pagurus<br />
Liocarcinus depur<strong>at</strong>or<br />
Pisidia longicornis<br />
Pagurus bernhardus<br />
Stenothoe sp.<br />
Jassa marmor<strong>at</strong>a<br />
Atylus swammerdami<br />
Caprella linearis<br />
CHIRONOMIDAE Telm<strong>at</strong>ogeton japonicus<br />
GASTROPODA Rissoidae indet.<br />
Crepidula fornic<strong>at</strong>a<br />
Polinices polianus<br />
Hinia pygmaea<br />
Onchidoris muric<strong>at</strong>a<br />
Polycera quadriline<strong>at</strong>a<br />
Facelina bostoniensis<br />
Aeolidia papillosa<br />
BIVALVIA Mytilus edulis<br />
Angulus tenuis<br />
Moerella pygmaea<br />
Hi<strong>at</strong>ella arctica<br />
Thracia phaseolina<br />
BRYOZOA Bryozoa indet.<br />
Electra pilosa<br />
Alcyonidium sp.<br />
ECHINODERMATA Asterias rubens<br />
Ophiura albida<br />
Strongylocentrotus<br />
droebachiensis<br />
ASCIDIACEA Tunic<strong>at</strong>a indet.<br />
Total<br />
A 0.5 NNE<br />
g/m² Kol Sum %<br />
B 02 NNE<br />
g/m² Kol Sum %<br />
Transect<br />
Found<strong>at</strong>ions, horizontal<br />
C 05 NNE<br />
g/m² Kol Sum %<br />
D 05 SSW<br />
g/m² Kol Sum %<br />
.000 .0% . . . . . .<br />
.316 .3% .218 .2% .208 .2% .163 .1%<br />
. . . . .004 .0% .004 .0%<br />
.017 .0% .019 .0% .074 .1% .021 .0%<br />
.045 .0% . . .000 .0% .004 .0%<br />
1.325 1.2% 9.422 8.3% 5.607 5.1% 9.177 7.4%<br />
43.885 40.6% 57.497 50.6% 33.931 31.1% 42.188 34.0%<br />
. . . . 2.488 2.3% . .<br />
.002 .0% .022 .0% .003 .0% .002 .0%<br />
.009 .0% .027 .0% .008 .0% .041 .0%<br />
.008 .0% .000 .0% .003 .0% .003 .0%<br />
.005 .0% . . . . .000 .0%<br />
.036 .0% .027 .0% .014 .0% .011 .0%<br />
. . . . . . .001 .0%<br />
. . . . .000 .0% . .<br />
.002 .0% . . .029 .0% .003 .0%<br />
. . .000 .0% . . . .<br />
. . . . .024 .0% .000 .0%<br />
. . . . .000 .0% . .<br />
1.236 1.1% .598 .5% .608 .6% .233 .2%<br />
. . .000 .0% .000 .0% . .<br />
.219 .2% .783 .7% .715 .7% .547 .4%<br />
1.049 1.0% .427 .4% . . 2.283 1.8%<br />
. . . . .010 .0% .132 .1%<br />
.639 .6% .427 .4% .360 .3% .314 .3%<br />
. . .001 .0% .019 .0% .001 .0%<br />
. . . . .000 .0% .001 .0%<br />
. . .001 .0% . . . .<br />
.009 .0% . . . . . .<br />
40.101 37.1% 21.915 19.3% 37.729 34.6% 30.229 24.3%<br />
.026 .0% .026 .0% .021 .0% .021 .0%<br />
1.699 1.6% .982 .9% 1.159 1.1% .536 .4%<br />
.001 .0% . . .001 .0% . .<br />
.188 .2% .106 .1% .045 .0% .050 .0%<br />
.131 .1% 5.668 5.0% 12.654 11.6% 25.207 20.3%<br />
. . . . . . .002 .0%<br />
.016 .0% .009 .0% .009 .0% . .<br />
. . . . .004 .0% .000 .0%<br />
.053 .0% .018 .0% .040 .0% .068 .1%<br />
.051 .0% .061 .1% .021 .0% .026 .0%<br />
. . .068 .1% .029 .0% .029 .0%<br />
1.166 1.1% 1.035 .9% .588 .5% 1.618 1.3%<br />
. . .000 .0% . . .001 .0%<br />
.010 .0% .009 .0% .011 .0% .004 .0%<br />
.002 .0% . . .004 .0% .005 .0%<br />
.001 .0% . . . . . .<br />
. . . . . . .002 .0%<br />
.273 .3% .364 .3% .311 .3% .298 .2%<br />
.421 .4% .166 .1% .016 .0% .091 .1%<br />
15.198 14.1% 12.419 10.9% 12.290 11.3% 10.878 8.8%<br />
. . . . .002 .0% .000 .0%<br />
. . 1.237 1.1% . . . .<br />
. . . . .035 .0% .004 .0%<br />
108.139 100.0% 113.553 100.0% 109.075 100.0% 124.200 100.0%<br />
<strong>Horns</strong> <strong>Rev</strong>. <strong>Benthic</strong> communities Page 133<br />
.
Doc. No. 2572-03-005 rev. 4<br />
<strong>Horns</strong> <strong>Rev</strong>. <strong>Benthic</strong> communities Page 134<br />
.