Identification of important interactions between subchondral bone ...
Identification of important interactions between subchondral bone ...
Identification of important interactions between subchondral bone ...

Create successful ePaper yourself
Turn your PDF publications into a flip-book with our unique Google optimized e-Paper software.
Madsen et al. 269<br />
Figure 2. Microscopic changes after catabolic and anabolic stimulation. Sections from femoral heads from 3-, 6-, 9-, and 12-week-old<br />
mice were stained with safranin O (proteoglycans) and fast green (collagens) after culture for 10 days in the absence (W/O) or presence<br />
<strong>of</strong> IGF-I (anabolic) and OSM + TNF-α (catabolic) stimulation. The black bars represent 250 µM (A-D, F-I, K-N) and 20 µM (E, J, O). The<br />
black squares in the 12-week-old femoral heads (D, I, N) represent the magnification <strong>of</strong> the cartilage surface (E, J, O), which is divided<br />
in rows after treatment.<br />
from the cartilage surface. In 12-week-old femoral heads,<br />
the proteoglycans seem to be almost depleted from the cartilage<br />
compartment in the nonstimulated (Fig. 2D) and the<br />
OSM + TNF-α–stimulated (Fig. 2I) explants. Anabolic<br />
stimulation with IGF-I protects against the proteoglycan<br />
loss seen in W/O (Fig. 2A-D and K-N). Additionally, in<br />
12-week-old mice, anabolic stimulation shows proteoglycan<br />
staining around the chondrocytes (Fig. 2O) compared to the<br />
W/O (Fig. 2E). Next, we measured the size <strong>of</strong> the growth<br />
plate to investigate whether morphological changes could<br />
be induced (Fig. 3A). The size <strong>of</strong> the growth plate in IGF-<br />
I–stimulated 12-week-old femoral heads is increased by<br />
approximately 48% (P < 0.001) compared to W/O, whereas<br />
OSM + TNF-α stimulation decreases the growth plate size<br />
by approximately 34% (P < 0.001) compared to W/O (Fig.<br />
3B). This indicates that we are able to induce alteration to<br />
the femoral heads ex vivo with catabolic (degenerative) or<br />
anabolic (generative) factors.<br />
Catabolic Stimulation Increases Collagen and<br />
Proteoglycan Turnover<br />
Levels <strong>of</strong> hydroxyproline, an indicator <strong>of</strong> total collagen<br />
turnover, in the conditioned medium indicate that stimulation<br />
by OSM + TNF-α increases the total release <strong>of</strong> collagens by<br />
approximately 49% (P < 0.05) to approximately 190%<br />
(P < 0.001) in femoral heads aged 6, 9, and 12 weeks, but not in<br />
femoral heads from 3-week-old mice (Fig. 4A). The longitudinal<br />
effects from the different stimulations are shown in<br />
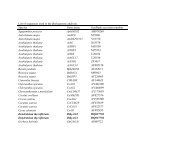
Table 1. OSM + TNF-α increases the release <strong>of</strong> collagens<br />
56<br />
Figure 3. Quantification <strong>of</strong> growth plate zone in femoral heads.<br />
Sections from femoral heads from 12-week-old mice were stained<br />
with safranin O (proteoglycans) and fast green (collagens) after<br />
culture for 10 days in the absence (W/O) or presence <strong>of</strong> IGF-I<br />
(anabolic) and OSM + TNF-α (catabolic) stimulation. The growth<br />
plate size was measured in one femoral head per treatment from 4<br />
different experiments using the annotation system (see Methods).<br />
The growth plate thickness (µm) is calculated by the average <strong>of</strong><br />
the black lines in the growth plate (A). The catabolic stimulation<br />
decreased the growth plate size, whereas the anabolic stimulation<br />
increased the size <strong>of</strong> the growth plate (B). ***P < 0.001.<br />
over time in 6- and 9-week-old mice. In femoral heads from<br />
12-week-old mice, the anabolic stimulation also increases<br />
total collagen release by approximately 49% (P < 0.01)<br />
compared to W/O (Fig. 4A). OSM + TNF-α stimulation<br />
increases the total release <strong>of</strong> sulfated glycosaminoglycans<br />
(sGAG) to the conditioned media by approximately 22%<br />
(P < 0.05) to approximately 40% (P < 0.01), except from<br />
the experiment with 6-week-old mice (Fig. 4B); however,<br />
similar trends were observed.