Extra questions - Homepage Usask
Extra questions - Homepage Usask
Extra questions - Homepage Usask

You also want an ePaper? Increase the reach of your titles
YUMPU automatically turns print PDFs into web optimized ePapers that Google loves.
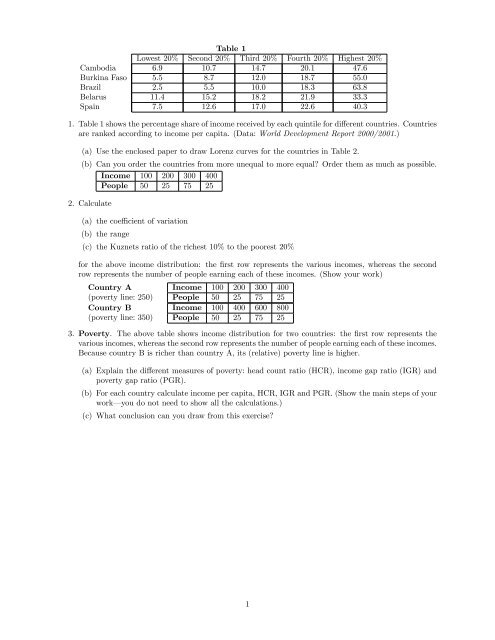
Table 1<br />
Lowest 20% Second 20% Third 20% Fourth 20% Highest 20%<br />
Cambodia 6.9 10.7 14.7 20.1 47.6<br />
Burkina Faso 5.5 8.7 12.0 18.7 55.0<br />
Brazil 2.5 5.5 10.0 18.3 63.8<br />
Belarus 11.4 15.2 18.2 21.9 33.3<br />
Spain 7.5 12.6 17.0 22.6 40.3<br />
1. Table 1 shows the percentage share of income received by each quintile for di¤erent countries. Countries<br />
are ranked according to income per capita. (Data: World Development Report 2000/2001.)<br />
(a) Use the enclosed paper to draw Lorenz curves for the countries in Table 2.<br />
(b) Can you order the countries from more unequal to more equal? Order them as much as possible.<br />
Income 100 200 300 400<br />
People 50 25 75 25<br />
2. Calculate<br />
(a) the coe¢ cient of variation<br />
(b) the range<br />
(c) the Kuznets ratio of the richest 10% to the poorest 20%<br />
for the above income distribution: the …rst row represents the various incomes, whereas the second<br />
row represents the number of people earning each of these incomes. (Show your work)<br />
Country A<br />
(poverty line: 250)<br />
Country B<br />
(poverty line: 350)<br />
Income 100 200 300 400<br />
People 50 25 75 25<br />
Income 100 400 600 800<br />
People 50 25 75 25<br />
3. Poverty. The above table shows income distribution for two countries: the …rst row represents the<br />
various incomes, whereas the second row represents the number of people earning each of these incomes.<br />
Because country B is richer than country A, its (relative) poverty line is higher.<br />
(a) Explain the di¤erent measures of poverty: head count ratio (HCR), income gap ratio (IGR) and<br />
poverty gap ratio (PGR).<br />
(b) For each country calculate income per capita, HCR, IGR and PGR. (Show the main steps of your<br />
work— you do not need to show all the calculations.)<br />
(c) What conclusion can you draw from this exercise?<br />
1
Answer to 3<br />
Country A<br />
Income 100 200 300 400<br />
(poverty line: 250) People 50 25 75 25<br />
Country B<br />
Income 100 400 600 800<br />
(poverty line: 350) People 50 25 75 25<br />
Poverty. The above table shows income distribution for two countries: the …rst row represents the<br />
various incomes, whereas the second row represents the number of people earning each of these incomes.<br />
Because country B is richer than country A, its (relative) poverty line is higher.<br />
4. (a) Explain the di¤erent measures of poverty: head count ratio (HCR), income gap ratio (IGR) and<br />
poverty gap ratio (PGR).<br />
Let us denote by p the poverty line, y refers to income, the subscript to the individual (i.e., yi is<br />
income of individual i), and m to the average income.<br />
The incidence of poverty or head count ratio, HCR, is de…ned as HCR = HC=n where n denotes<br />
total population and HC the head count, HC: number of people whose income falls below the<br />
poverty line, yi < p.<br />
The poverty gap ratio (depth) is the ratio of the average shortfall to poverty line<br />
P GR =<br />
P<br />
yi