APPLYING THERMOECONOMICS TO THE ANALYSIS OF ... - circe
APPLYING THERMOECONOMICS TO THE ANALYSIS OF ... - circe
APPLYING THERMOECONOMICS TO THE ANALYSIS OF ... - circe

Create successful ePaper yourself
Turn your PDF publications into a flip-book with our unique Google optimized e-Paper software.
Proceedings of ECOS 2009 22 nd International Conference on Efficiency, Cost, Optimization<br />
Copyright © 2009 by ABCM Simulation and Environmental Impact of Energy Systems<br />
August 31 – September 3, 2009, Foz do Iguaçu, Paraná, Brazil<br />
t<br />
P<br />
where cˆ0i ≡ c0iq0, i.<br />
The total cost of the external resources 0<br />
c = F c ˆ<br />
(5)<br />
0<br />
0<br />
C can be expressed as a function of the system demand as:<br />
t<br />
C = cˆ F P (6)<br />
Using these relationships is it also possible to determine the variation of the total resources as a function of the<br />
variation of the parameters of the PF representation:<br />
n ⎛ ⎞<br />
Δ C0 = ∑⎜c0iΔ q0 iFi + ∑ cP, jΔ qjiFi + cF, iΔ<br />
κiPi<br />
+ cP, iΔEi0⎟ (7)<br />
i=<br />
1 ⎝ j<br />
⎠<br />
The above expression is known as the Fuel Impact Formulae (Torres et al., 2002), the first two terms correspond to<br />
the variation of the junction (structural) ratios, the third term to the variation of the processes efficiency and the last<br />
term to the system demand variation.<br />
Through the example presented in the next section, we will show how thermoeconomics can be applied to a<br />
macroeconomic system such as the American food chain, giving insights on improving options.<br />
3. <strong>APPLYING</strong> <strong><strong>THE</strong>RMOECONOMICS</strong> <strong>TO</strong> <strong>THE</strong> <strong>ANALYSIS</strong> <strong>OF</strong> <strong>THE</strong> FOOD CHAIN<br />
The Global 2000 Report (Barney, 1980) presented a flow diagram of energy for American food production (see<br />
figure 2). For around 3.6 GJ (per capita) of human food energy, 35.5 GJ of technical energy are expended, without<br />
accounting for the “solar gift” of 80 GJ that is absorbed by the plants used in the process. It seems more than plausible<br />
that the energy demand from agriculture and food processing could be substantially reduced with essentially no<br />
sacrifice of wellbeing (Weizsacker, 1997). And thermoeconomics could help to identify and quantify these reductions.<br />
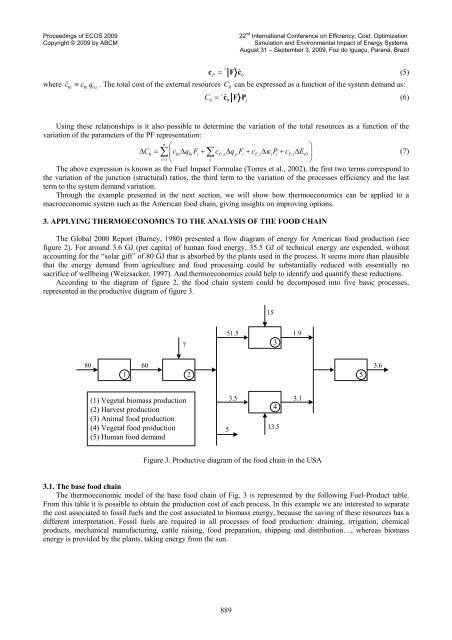
According to the diagram of figure 2, the food chain system could be decomposed into five basic processes,<br />
represented in the productive diagram of figure 3.<br />
80 60<br />
1 2<br />
(1) Vegetal biomass production<br />
(2) Harvest production<br />
(3) Animal food production<br />
(4) Vegetal food production<br />
(5) Human food demand<br />
7<br />
0<br />
51.5<br />
5<br />
3.5<br />
s<br />
15<br />
3<br />
4<br />
13.5<br />
Figure 3. Productive diagram of the food chain in the USA<br />
3.1. The base food chain<br />
The thermoeconomic model of the base food chain of Fig. 3 is represented by the following Fuel-Product table.<br />
From this table it is possible to obtain the production cost of each process. In this example we are interested to separate<br />
the cost associated to fossil fuels and the cost associated to biomass energy, because the saving of these resources has a<br />
different interpretation. Fossil fuels are required in all processes of food production: draining, irrigation, chemical<br />
products, mechanical manufacturing, cattle raising, food preparation, shipping and distribution…, whereas biomass<br />
energy is provided by the plants, taking energy from the sun.<br />
889<br />
1.9<br />
3.1<br />
5<br />
3.6