Distant metastasis occurs late during the genetic evolution of ...
Distant metastasis occurs late during the genetic evolution of ...
Distant metastasis occurs late during the genetic evolution of ...

Create successful ePaper yourself
Turn your PDF publications into a flip-book with our unique Google optimized e-Paper software.
LETTER doi:10.1038/nature09515<br />
<strong>Distant</strong> <strong>metastasis</strong> <strong>occurs</strong> <strong>late</strong> <strong>during</strong> <strong>the</strong> <strong>genetic</strong><br />
<strong>evolution</strong> <strong>of</strong> pancreatic cancer<br />
Shinichi Yachida 1 *, Siân Jones 2 *, Ivana Bozic 3 , Tibor Antal 3,4 , Rebecca Leary 2 , Baojin Fu 1 , Mihoko Kamiyama 1 , Ralph H. Hruban 1,5 ,<br />
James R. Eshleman 1 , Martin A. Nowak 3 , Victor E. Velculescu 2 , Kenneth W. Kinzler 2 , Bert Vogelstein 2<br />
& Christine A. Iacobuzio-Donahue 1,5,6<br />
Metastasis, <strong>the</strong> dissemination and growth <strong>of</strong> neoplastic cells in an<br />
organ distinct from that in which <strong>the</strong>y originated 1,2 , is <strong>the</strong> most<br />
common cause <strong>of</strong> death in cancer patients. This is particularly true<br />
for pancreatic cancers, where most patients are diagnosed with<br />
metastatic disease and few show a sustained response to chemo<strong>the</strong>rapy<br />
or radiation <strong>the</strong>rapy 3 . Whe<strong>the</strong>r <strong>the</strong> dismal prognosis <strong>of</strong><br />
patients with pancreatic cancer compared to patients with o<strong>the</strong>r<br />
types <strong>of</strong> cancer is a result <strong>of</strong> <strong>late</strong> diagnosis or early dissemination <strong>of</strong><br />
disease to distant organs is not known. Here we rely on data generated<br />
by sequencing <strong>the</strong> genomes <strong>of</strong> seven pancreatic cancer metastases<br />
to evaluate <strong>the</strong> clonal relationships among primary and<br />
metastatic cancers. We find that clonal populations that give rise<br />
to distant metastases are represented within <strong>the</strong> primary carcinoma,<br />
but <strong>the</strong>se clones are <strong>genetic</strong>ally evolved from <strong>the</strong> original<br />
parental, non-metastatic clone. Thus, <strong>genetic</strong> heterogeneity <strong>of</strong><br />
metastases reflects that within <strong>the</strong> primary carcinoma. A quantitative<br />
analysis <strong>of</strong> <strong>the</strong> timing <strong>of</strong> <strong>the</strong> <strong>genetic</strong> <strong>evolution</strong> <strong>of</strong> pancreatic<br />
cancer was performed, indicating at least a decade between <strong>the</strong><br />
occurrence <strong>of</strong> <strong>the</strong> initiating mutation and <strong>the</strong> birth <strong>of</strong> <strong>the</strong> parental,<br />
non-metastatic founder cell. At least five more years are required<br />
for <strong>the</strong> acquisition <strong>of</strong> metastatic ability and patients die an average<br />
<strong>of</strong> two years <strong>the</strong>reafter. These data provide novel insights into <strong>the</strong><br />
<strong>genetic</strong> features underlying pancreatic cancer progression and<br />
define a broad time window <strong>of</strong> opportunity for early detection to<br />
prevent deaths from metastatic disease.<br />
We performed rapid autopsies <strong>of</strong> seven individuals with end stage<br />
pancreatic cancer (Supplementary Table 1). In all patients, metastatic<br />
deposits were present within two or more anatomic sites in each<br />
patient, most <strong>of</strong>ten <strong>the</strong> liver, lung and peritoneum, as is typical for this<br />
form <strong>of</strong> neoplasia 4 .<br />
Low passage cell lines (six patients) or first passage xenografts (one<br />
patient) were created from one <strong>of</strong> <strong>the</strong> metastases present at each<br />
patient’s autopsy. These samples comprised seven <strong>of</strong> <strong>the</strong> 24 pancreatic<br />
cancers which previously underwent whole exome sequencing and<br />
copy number analysis, as described in a mutational survey <strong>of</strong> <strong>the</strong><br />
pancreatic cancer genome 5 . In this earlier study, a total <strong>of</strong> 426 somatic<br />
mutations in 388 different genes were identified among 220,884,033<br />
base pairs (bp) sequenced in <strong>the</strong> seven index metastatic lesions, corresponding<br />
to an average <strong>of</strong> 61 mutations per index metastatic lesion<br />
(range 41–77). In all samples, <strong>the</strong> vast majority <strong>of</strong> mutations were<br />
represented by missense or silent single base substitutions (Supplementary<br />
Fig. 1 and Supplementary Table 2).<br />
For each <strong>of</strong> <strong>the</strong> somatic mutations identified in <strong>the</strong> seven index<br />
<strong>metastasis</strong> lesions, we determined whe<strong>the</strong>r <strong>the</strong> same somatic mutation<br />
was present in anatomically distinct metastases harvested at autopsy<br />
from <strong>the</strong> same patients. We also determined whe<strong>the</strong>r <strong>the</strong>se mutations<br />
were present in <strong>the</strong> primary pancreatic tumours from which <strong>the</strong> metastases<br />
arose. A small number <strong>of</strong> <strong>the</strong>se samples <strong>of</strong> interest were cell lines<br />
or xenografts, similar to <strong>the</strong> index lesions, whereas <strong>the</strong> majority were<br />
fresh-frozen tissues that contained admixed neoplastic, stromal,<br />
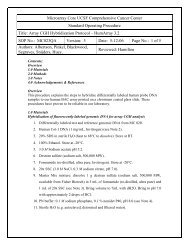
inflammatory, endo<strong>the</strong>lial and normal epi<strong>the</strong>lial cells (Fig. 1a). Each<br />
tissue sample was <strong>the</strong>refore microdissected to minimize contaminating<br />
non-neoplastic elements before purifying DNA.<br />
Two categories <strong>of</strong> mutations were identified (Fig. 1b). The first and<br />
largest category corresponded to those mutations present in all samples<br />
from a given patient (‘founder’ mutations, mean <strong>of</strong> 64%, range 48–83%<br />
<strong>of</strong> all mutations per patient; Fig. 1b, example in Supplementary Fig. 2a).<br />
These data indicate that <strong>the</strong> majority <strong>of</strong> somatically acquired mutations<br />
present in pancreatic cancers occur before <strong>the</strong> development <strong>of</strong> metastatic<br />
lesions. All o<strong>the</strong>r mutations were characterized as ‘progressor’<br />
mutations (mean <strong>of</strong> 36%, range 17–52% <strong>of</strong> all mutations per patient;<br />
a Pancreas Peritoneum<br />
1 Department <strong>of</strong> Pathology, The Sol Goldman Pancreatic Cancer Research Center, Johns Hopkins Medical Institutions, Baltimore, Maryland 21231, USA. 2 The Ludwig Center for Cancer Genetics and<br />
Therapeutics and The Howard Hughes Medical Institute at The Johns Hopkins Kimmel Cancer Center, Baltimore, Maryland 21231, USA. 3 Program for Evolutionary Dynamics, Department <strong>of</strong> Ma<strong>the</strong>matics,<br />
Department <strong>of</strong> Organismic and Evolutionary Biology, Harvard University, Cambridge, Massachusetts 02138, USA. 4 School <strong>of</strong> Ma<strong>the</strong>matics, University <strong>of</strong> Edinburgh, Edinburgh EH9 3JZ, UK. 5 Department <strong>of</strong><br />
Oncology, The Sol Goldman Pancreatic Cancer Research Center, Johns Hopkins Medical Institutions, Baltimore, Maryland 21231, USA. 6 Department <strong>of</strong> Surgery, The Sol Goldman Pancreatic Cancer<br />
Research Center, Johns Hopkins Medical Institutions, Baltimore, Maryland 21231, USA.<br />
*These authors contributed equally to this work.<br />
1114 | NATURE | VOL 467 | 28 OCTOBER 2010<br />
Macmillan Publishers Limited. All rights reserved<br />
©2010<br />
b<br />
Total mutations<br />
90<br />
80<br />
70<br />
60<br />
50<br />
40<br />
30<br />
20<br />
10<br />
0<br />
Liver Lung<br />
Progressor<br />
Founder<br />
Pa01 Pa02 Pa03 Pa04 Pa05 Pa07 Pa08<br />
Figure 1 | Summary <strong>of</strong> somatic mutations in metastatic pancreatic cancers.<br />
a, Histopathology <strong>of</strong> primary infiltrating pancreatic cancer and metastatic<br />
pancreatic cancer to <strong>the</strong> peritoneum, liver and lung. In addition to infiltrating<br />
cancer cells in each lesion (arrows), non-neoplastic cell types are abundant.<br />
b, Total mutations representing parental clones (founder mutations), and<br />
clonal <strong>evolution</strong> (progressor mutations) within <strong>the</strong> primary carcinoma based<br />
on comparative lesion sequencing. Mutations common to all samples analysed<br />
were <strong>the</strong> most common category identified.
Fig. 1b, example in Supplementary Fig. 2b). These mutations were<br />
present in one or more <strong>of</strong> <strong>the</strong> metastases examined, including <strong>the</strong> index<br />
<strong>metastasis</strong>, but not <strong>the</strong> parental clone.<br />
These mutation types were used to classify <strong>the</strong> lesions that contained<br />
<strong>the</strong>m into parental clones (containing only founder mutations) and<br />
subclones (containing both founder and progressor mutations). By<br />
definition, <strong>the</strong>re could be only one parental clone in a patient, although<br />
<strong>the</strong>re could be many different subclones. Parental clones tended to<br />
contain more deleterious mutations (nonsense, splice site or frameshift<br />
mutations) than subclones (12.6% <strong>of</strong> <strong>the</strong> mutations in <strong>the</strong> parental<br />
clones versus 8.1% <strong>of</strong> <strong>the</strong> mutations in subclones, Supplementary<br />
Table 2). The parental clones had already accumu<strong>late</strong>d mutations in<br />
all driver genes (KRAS, TP53 and SMAD4) previously shown to drive<br />
pancreatic tumorigenesis 6 . Through combined analysis <strong>of</strong> high-density<br />
single nucleotide polymorphism (SNP) chip data on <strong>the</strong> index lesion<br />
(Supplementary Table 3) plus <strong>the</strong> sequencing data on all lesions<br />
(Supplementary Table 2) we found that <strong>the</strong> vast majority <strong>of</strong> homozygous<br />
mutations (51 mutations, representing 89% <strong>of</strong> all homozygous<br />
mutations) in <strong>the</strong> index lesion were already present in <strong>the</strong> parental<br />
clones. Homozygous mutations are characteristic <strong>of</strong> tumour suppressor<br />
genes such as SMAD4 and CDKN2A and <strong>of</strong>ten occur in association with<br />
chromosomal instability 7 . In sum, <strong>the</strong> parental clones harboured <strong>the</strong><br />
majority <strong>of</strong> deleterious <strong>genetic</strong> alterations and chromosomal instability,<br />
a<br />
3 cm<br />
c<br />
Pa08<br />
Slice number<br />
1 5432 b<br />
S<br />
R L<br />
I<br />
5 mm<br />
Parental clone<br />
AKAP12 HPCAL1 ODZ4<br />
ATP2B3 ITPR1 OR4A16<br />
BCL2A1 JPH4 OR5J2<br />
CCNYL3 KAL1 OR8H1<br />
CMYA5 KIAA0082 SH3GL3<br />
CNTNAP4 KIAA1957 SMAD4<br />
DNAH8 KRAS TBX6<br />
DOCK2 KRTAP11-1 TMEM132B<br />
EML1 LGR6 TP53<br />
FLJ10324 MTR TTN<br />
FLJ21986 NEO1 TTN*<br />
GABRA1 NOD3<br />
Primary<br />
carcinoma<br />
Metastases<br />
Pancreatic tail<br />
PNPLA1<br />
O<br />
C20orf26<br />
FAT4<br />
P<br />
Q<br />
R<br />
e f<br />
Peritoneum<br />
C1RL<br />
B3GALT1<br />
LRRTM4<br />
SESN2<br />
SLC25A26<br />
S<br />
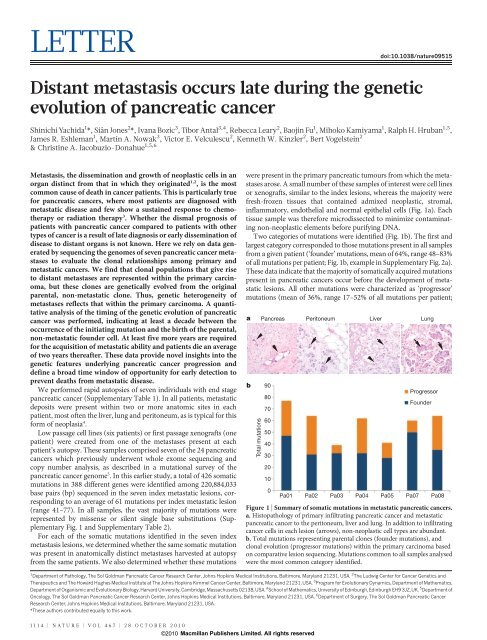
Figure 2 | Geographic mapping <strong>of</strong> metastatic clones within <strong>the</strong> primary<br />
carcinoma and proposed clonal <strong>evolution</strong> <strong>of</strong> Pa08. a, Illustration <strong>of</strong> <strong>the</strong><br />
pancreatic specimen removed from Pa08 at rapid autopsy, and <strong>the</strong> planes <strong>of</strong><br />
sectioning <strong>of</strong> <strong>the</strong> specimen. b, Mapping <strong>of</strong> <strong>the</strong> parental clone and subclones<br />
identified by comparative lesion sequencing within serial sections <strong>of</strong> <strong>the</strong><br />
infiltrating pancreatic carcinoma. Metastatic subclones giving rise to liver and<br />
lung metastases are non-randomly located within slice 3, indicated by blue<br />
upon which were superimposed an accumulation <strong>of</strong> progressor mutations<br />
associated with clonal <strong>evolution</strong> and <strong>metastasis</strong>.<br />
Evolutionary maps were constructed for each patient’s carcinoma<br />
based on <strong>the</strong> patterns <strong>of</strong> somatic mutation and allelic losses and <strong>the</strong><br />
locations <strong>of</strong> individual metastatic deposits (Fig. 2 and Supplementary<br />
Figs 3–8). These maps showed that, despite <strong>the</strong> presence <strong>of</strong> numerous<br />
founder mutations within <strong>the</strong> parental clones, <strong>the</strong> cells giving rise to<br />
<strong>the</strong> metastatic lesions had a large number <strong>of</strong> progressor mutations. For<br />
example, in Pa01 <strong>the</strong> parental clone contained 49 founder mutations,<br />
yet a clonal expansion marked by <strong>the</strong> presence <strong>of</strong> mutations in six<br />
additional genes was present in <strong>the</strong> lung and peritoneal metastases<br />
(Supplementary Fig. 3). Moreover, 22 more mutations were found in<br />
<strong>the</strong> liver <strong>metastasis</strong>. Note that all mutations in <strong>the</strong> metastatic lesions<br />
were clonal, that is, present in <strong>the</strong> great majority if not all neoplastic<br />
cells <strong>of</strong> <strong>the</strong> <strong>metastasis</strong>, as assessed by Sanger sequencing. Thus, <strong>the</strong>se<br />
mutations were present in <strong>the</strong> cell that clonally expanded to become<br />
<strong>the</strong> <strong>metastasis</strong>. Similarly, large numbers <strong>of</strong> progressor mutations were<br />
generally observed in <strong>the</strong> metastases from each <strong>of</strong> <strong>the</strong> seven cases<br />
examined (Fig. 2 and Supplementary Figs 3–8).<br />
To distinguish between <strong>the</strong> possibilities that clonal <strong>evolution</strong><br />
occurred inside <strong>the</strong> primary cancer versus within secondary sites, we<br />
sectioned <strong>the</strong> primary tumours from two patients into numerous, threedimensionally<br />
organized pieces (Fig. 2a, b) and examined <strong>the</strong> DNA<br />
Slice 1<br />
Slice 4<br />
X<br />
H<br />
R<br />
C13orf22<br />
GPC2<br />
GRM8<br />
MLL2<br />
NEB<br />
PALMD<br />
RAD9B<br />
SYNE1<br />
A<br />
T<br />
K<br />
J<br />
I<br />
Slice 2<br />
B<br />
C<br />
Y<br />
W<br />
Slice 3<br />
Slice 5<br />
Superior<br />
P O<br />
Right Left<br />
NL<br />
Inferior<br />
M<br />
Necrosis Normal Parental<br />
DICER1<br />
EHMT1<br />
U<br />
V<br />
W<br />
X<br />
CCNB3<br />
CNGB3<br />
NP_001074311.1 CTNND2<br />
LOC167127 MRGX1<br />
RDH8<br />
OVCH1<br />
Y<br />
a<br />
V<br />
NCL<br />
SLC2A3<br />
D<br />
U<br />
S Q<br />
b<br />
Liver Liver<br />
E<br />
CGN<br />
NLGN1<br />
c<br />
T<br />
F<br />
Pa08<br />
G<br />
d<br />
Lung<br />
(index<br />
lesion)<br />
LETTER RESEARCH<br />
circles. These clones are both geographically and <strong>genetic</strong>ally distinct from<br />
clones giving rise to peritoneal metastases in this same patient, indicated in<br />
green. c, Proposed clonal <strong>evolution</strong> based on <strong>the</strong> sequencing data. In this model,<br />
after development <strong>of</strong> <strong>the</strong> parental clone, ongoing clonal <strong>evolution</strong> continues<br />
within <strong>the</strong> primary carcinoma (yellow rectangle), and <strong>the</strong>se subclones seed<br />
metastases in distant sites. *Two mutations were found in <strong>the</strong> TTN gene.<br />
28 OCTOBER 2010 | VOL 467 | NATURE | 1115<br />
©2010<br />
Macmillan Publishers Limited. All rights reserved
RESEARCH LETTER<br />
from each piece for each <strong>of</strong> <strong>the</strong> founder and progressor mutations. In<br />
Patient Pa08, <strong>the</strong>re were three progressor mutations present in two<br />
independent peritoneal metastases (defining one subclone) and 23,<br />
25 or 27 additional progressor mutations present in liver and lung<br />
metastases (defining three additional subclones; Fig. 2c). Through <strong>the</strong><br />
analysis <strong>of</strong> distinct regions <strong>of</strong> <strong>the</strong> primary tumour, it was clear that<br />
subclones giving rise to each <strong>of</strong> <strong>the</strong>se metastases were present in <strong>the</strong><br />
primary tumour. Moreover, <strong>the</strong>se subclones were not small; from <strong>the</strong><br />
size <strong>of</strong> <strong>the</strong> pieces (Fig. 2a) and <strong>the</strong> amounts <strong>of</strong> DNA recovered, each<br />
subclone must have contained in excess <strong>of</strong> 100 million cells. In addition,<br />
more than four different subclones, each containing a similarly large<br />
number <strong>of</strong> cells, could be identified through <strong>the</strong> analysis <strong>of</strong> o<strong>the</strong>r pieces<br />
<strong>of</strong> <strong>the</strong> same tumour. These subclones could be put into an ordered<br />
hierarchy establishing an <strong>evolution</strong>ary path for tumour progression<br />
(Fig. 2c). Analysis <strong>of</strong> multiple primary tumour pieces and metastatic<br />
lesions from patient Pa04 revealed a similar clonal <strong>evolution</strong>, with<br />
distinct, large subclones within <strong>the</strong> primary tumours giving rise to <strong>the</strong><br />
various metastases (Supplementary Fig. 8).<br />
To clarify fur<strong>the</strong>r clonal <strong>evolution</strong> within <strong>the</strong> primary site, we<br />
attempted to corre<strong>late</strong> <strong>the</strong> mutation signatures representing <strong>the</strong> subclones<br />
<strong>of</strong> Pa08 (Fig. 2c) with <strong>the</strong> geographic location <strong>of</strong> <strong>the</strong> pieces <strong>of</strong> <strong>the</strong><br />
primary tumour used to define <strong>the</strong>m (Fig. 2a, b). Samples representative<br />
<strong>of</strong> <strong>the</strong> parental clone were located throughout <strong>the</strong> primary carcinoma.<br />
By contrast, samples representing subclones were non-randomly<br />
located in proximity to each o<strong>the</strong>r, within which <strong>the</strong> subclones specifically<br />
giving rise to peritoneal versus distant metastases were seen.<br />
Thus, we conclude that <strong>the</strong> <strong>genetic</strong> heterogeneity <strong>of</strong> metastases reflects<br />
heterogeneity already existing within <strong>the</strong> primary carcinoma, and that<br />
<strong>the</strong> primary carcinoma is a mixture <strong>of</strong> numerous subclones, each <strong>of</strong><br />
which has independently expanded to constitute a large number <strong>of</strong> cells.<br />
This data set could also be used to infer <strong>the</strong> timing <strong>of</strong> <strong>the</strong> development<br />
<strong>of</strong> <strong>the</strong> various stages <strong>of</strong> pancreatic tumour progression 8 . We<br />
assume that <strong>the</strong> tumour is initiated by a <strong>genetic</strong> event that confers a<br />
selective growth advantage to <strong>the</strong> cell that goes on to become <strong>the</strong><br />
T 1<br />
(average <strong>of</strong> 11.7 ± 3.1 years)<br />
T 2<br />
(average <strong>of</strong> 6.8 ± 3.4 years)<br />
T 3<br />
(average <strong>of</strong> 2.7 ± 1.2 years)<br />
Figure 3 | Schema <strong>of</strong> <strong>the</strong> <strong>genetic</strong> <strong>evolution</strong> <strong>of</strong> pancreatic cancer.<br />
Tumorigenesis begins with an initiating mutation in a normal cell that confers a<br />
selective growth advantage. Successive waves <strong>of</strong> clonal expansion occur in<br />
association with <strong>the</strong> acquisition <strong>of</strong> additional mutations, corresponding to <strong>the</strong><br />
progression model <strong>of</strong> pancreatic intraepi<strong>the</strong>lial neoplasia (PanIN) and time T1.<br />
One founder cell within a PanIN lesion will seed <strong>the</strong> parental clone and hence<br />
initiate an infiltrating carcinoma (end <strong>of</strong> T1 and beginning <strong>of</strong> T2). Eventually,<br />
t 0<br />
t 1<br />
t 2<br />
t 3<br />
founder cell <strong>of</strong> <strong>the</strong> tumour. To estimate <strong>the</strong> timing, we first used<br />
Ki-67 labelling to determine <strong>the</strong> proliferation rate <strong>of</strong> seven samples<br />
<strong>of</strong> normal duct epi<strong>the</strong>lium from surgically resected pancreata <strong>of</strong> individuals<br />
without pancreatic cancer as well as <strong>of</strong> each index <strong>metastasis</strong>.<br />
Ki-67-positive nuclei constituted an average <strong>of</strong> 0.4% <strong>of</strong> normal ductal<br />
cells, whereas an average <strong>of</strong> 16.3% <strong>of</strong> cancer cells within <strong>the</strong> index<br />
<strong>metastasis</strong> lesions were Ki-67-positive, consistent with prior estimates<br />
9,10 (Supplementary Table 4). Based on <strong>the</strong>se data plus that from<br />
sequencing <strong>of</strong> <strong>the</strong> index lesions, we derived estimates for three critical<br />
times in tumour <strong>evolution</strong>: T1, <strong>the</strong> time between tumour initiation and<br />
<strong>the</strong> birth <strong>of</strong> <strong>the</strong> cell giving rise to <strong>the</strong> parental clone; T2, <strong>the</strong> subsequent<br />
time required for <strong>the</strong> birth <strong>of</strong> <strong>the</strong> cell that gave rise to <strong>the</strong> index<br />
<strong>metastasis</strong>; and T3, <strong>the</strong> time between <strong>the</strong> dissemination <strong>of</strong> this cell<br />
and <strong>the</strong> patients’ death (Fig. 3). In o<strong>the</strong>r words, <strong>the</strong>re is a time point,<br />
t0, when <strong>the</strong> tumour was initiated, and a time point t1 when a cell is<br />
born that has all mutations that exist in <strong>the</strong> parental clone. Similarly,<br />
<strong>the</strong>re is a time point in tumour <strong>evolution</strong>, t 2, when a cell is born that has<br />
all <strong>the</strong> mutations that exist in <strong>the</strong> index <strong>metastasis</strong>. T1 is given by t1 2 t0<br />
and T2 is given by t2 2 t1. If we denote t3 as <strong>the</strong> time <strong>of</strong> patient’s death,<br />
<strong>the</strong>n T 3 5 t 3 2 t 2.<br />
Using <strong>the</strong> ma<strong>the</strong>matical model described in <strong>the</strong> Methods, we were<br />
able to conservatively estimate an average <strong>of</strong> 11.7 years from <strong>the</strong> initiation<br />
<strong>of</strong> tumorigenesis until <strong>the</strong> birth <strong>of</strong> <strong>the</strong> cell giving rise to <strong>the</strong><br />
parental clone, an average <strong>of</strong> 6.8 years from <strong>the</strong>n until <strong>the</strong> birth <strong>of</strong> <strong>the</strong><br />
cell giving rise to <strong>the</strong> index lesion, and an average <strong>of</strong> 2.7 years from <strong>the</strong>n<br />
until <strong>the</strong> patients’ death (see Supplementary Discussion and Supplementary<br />
Table 5).<br />
We show, for <strong>the</strong> first time, that primary pancreatic cancers contain a<br />
mix <strong>of</strong> geographically distinct subclones, each containing large numbers<br />
(hundreds <strong>of</strong> millions) <strong>of</strong> cells that are present within <strong>the</strong> primary<br />
tumour years before <strong>the</strong> metastases become clinically evident. The features<br />
<strong>of</strong> <strong>the</strong>se metastatic subclones that promote <strong>metastasis</strong> formation<br />
have yet to be discerned, because no consistent <strong>genetic</strong> signature <strong>of</strong><br />
metastatic subclones could be identified. We did identify several genes<br />
Normal duct<br />
epi<strong>the</strong>lial cell<br />
Initiated<br />
tumour cell<br />
Parental clone<br />
Lung Liver Liver<br />
Index lesion<br />
Subclones with<br />
metastatic capacity<br />
1116 | NATURE | VOL 467 | 28 OCTOBER 2010<br />
Macmillan Publishers Limited. All rights reserved<br />
©2010<br />
= Mutation(s) &<br />
clonal expansion<br />
= Dissemination to<br />
distant organs<br />
<strong>the</strong> cell that will give rise to <strong>the</strong> index lesion will appear (end <strong>of</strong> T2 and<br />
beginning <strong>of</strong> T3). Unfortunately, most patients are not diagnosed until well into<br />
time interval T3 when cells <strong>of</strong> <strong>the</strong>se metastatic subclones have already escaped<br />
<strong>the</strong> pancreas and started to grow within distant organs. The average time for<br />
intervals T1, T2 and T3 for all seven patients is indicated in <strong>the</strong> paren<strong>the</strong>ses at left<br />
(see also Supplementary Table 6).
that were mutated in one or more <strong>of</strong> <strong>the</strong> index metastatic lesions from<br />
<strong>the</strong>se seven patients with Stage IV disease, but not in <strong>the</strong> primary<br />
pancreatic index lesions from 17 patients with Stage II disease (Supplementary<br />
Table 2). These genes include those that may have a role<br />
in invasive or metastatic ability through heterotypic cell adhesion<br />
(CNTN5), motility (DOCK2), proteolysis (MEP1A) and tyrosine phosphorylation<br />
(LMTK2). However, <strong>the</strong>se mutations were not <strong>metastasis</strong>specific<br />
per se as all but one were present in <strong>the</strong> matched primary<br />
carcinoma <strong>of</strong> those same seven patients, and <strong>the</strong>re is no evidence that<br />
<strong>the</strong> mutations we observed endowed <strong>the</strong>se genes with metastagenic<br />
activity. These data also do not reveal <strong>the</strong> selective pressures within<br />
<strong>the</strong> primary carcinoma that led to <strong>the</strong> formation <strong>of</strong> progressor mutations.<br />
In light <strong>of</strong> recent findings indicating that pancreatic cancers are<br />
poorly vascularized 11 , one possibility is that intratumoural hypoxia creates<br />
a fertile microenvironment for <strong>the</strong> formation <strong>of</strong> additional mutations<br />
beyond that <strong>of</strong> <strong>the</strong> parental clone.<br />
One <strong>of</strong> <strong>the</strong> major implications <strong>of</strong> <strong>the</strong>se data is <strong>the</strong>ir implication for<br />
screening to prevent pancreatic cancer deaths. Quantitative analysis<br />
indicated a large window <strong>of</strong> opportunity for diagnosis while <strong>the</strong> disease<br />
was still in <strong>the</strong> curative stage—at least a decade. Our model also predicts<br />
an average <strong>of</strong> 6.8 years between <strong>the</strong> birth <strong>of</strong> <strong>the</strong> cell giving rise to <strong>the</strong><br />
parental clone and <strong>the</strong> seeding <strong>of</strong> <strong>the</strong> index <strong>metastasis</strong>. Unfortunately,<br />
<strong>the</strong> great majority <strong>of</strong> patients are not diagnosed until <strong>the</strong> last 2 years <strong>of</strong><br />
<strong>the</strong> entire tumorigenic process. The challenge is to detect <strong>the</strong>se tumours<br />
<strong>during</strong> time T1, orevenafterT1 but before seeding <strong>of</strong> metastases.<br />
Advanced imaging methods, as well as blood tests to detect cancerspecific<br />
proteins, transcripts or genes 12 , <strong>of</strong>fer hope for such non-invasive<br />
early detection.<br />
METHODS SUMMARY<br />
Rapid autopsies were performed on seven individuals with Stage IV pancreatic<br />
cancer 13 . Genomic DNA was extracted from cell lines or xenografts established<br />
from one <strong>metastasis</strong> <strong>of</strong> each patient and used for exomic sequencing as described<br />
previously 5 . The Illumina Infinium II Whole Genome Genotyping Assay using <strong>the</strong><br />
BeadChip platform was also used to analyse each sample at 1,072,820 (1M) SNP<br />
loci as described previously 5 . Samples <strong>of</strong> snap-frozen pancreatic cancer tissue were<br />
microdissected using a PALM MicroLaser System (Carl Zeiss MicroImaging) and<br />
DNA extracted using QIAamp DNA Micro Kits (Qiagen). Genomic DNA was<br />
quantified by calculating long interspersed nuclear elements (LINE) by real-time<br />
PCR. Whole genome amplification (WGA) was performed using 10 ng total temp<strong>late</strong><br />
DNA and an illustra GenomiPhi V2 DNA Amplification Kit (GE Healthcare).<br />
Ki-67 immunolabelling (Clone MIB-1, Dako Cytomation) was performed on<br />
formalin-fixed, paraffin-embedded sections <strong>of</strong> normal pancreatic ducts and metastatic<br />
pancreatic cancer tissues for each patient using <strong>the</strong> Ventana Discovery staining<br />
system (Ventana Medical Systems), and this information was used to inform<br />
computational models <strong>of</strong> <strong>the</strong> timing <strong>of</strong> clonal <strong>evolution</strong> <strong>of</strong> each patient’s pancreatic<br />
cancer (full details <strong>of</strong> <strong>the</strong>se models are available in Full Methods).<br />
Full Methods and any associated references are available in <strong>the</strong> online version <strong>of</strong><br />
<strong>the</strong> paper at www.nature.com/nature.<br />
Received 11 May; accepted 15 September 2010.<br />
1. Fidler, I. J. Critical determinants <strong>of</strong> <strong>metastasis</strong>. Semin. Cancer Biol. 12, 89–96<br />
(2002).<br />
2. Nguyen, D. X., Bos, P. D. & Massague, J. Metastasis: from dissemination to organspecific<br />
colonization. Nature Rev. Cancer 9, 274–284 (2009).<br />
LETTER RESEARCH<br />
3. Stathis, A. & Moore, M. J. Advanced pancreatic carcinoma: current treatment and<br />
future challenges. Nature Rev. Clin. Oncol. 7, 163–172 (2010).<br />
4. Yachida, S. & Iacobuzio-Donahue, C. A. The pathology and <strong>genetic</strong>s <strong>of</strong> metastatic<br />
pancreatic cancer. Arch. Pathol. Lab. Med. 133, 413–422 (2009).<br />
5. Jones, S. et al. Core signaling pathways in human pancreatic cancers revealed by<br />
global genomic analyses. Science 321, 1801–1806 (2008).<br />
6. Maitra, A. & Hruban, R. H. pancreatic cancer. Annu. Rev. Pathol. 3, 157–188 (2008).<br />
7. Lengauer, C., Kinzler, K. W. & Vogelstein, B. Genetic instabilities in human cancers.<br />
Nature 396, 643–649 (1998).<br />
8. Jones, S. et al. Comparative lesion sequencing provides insights into tumor<br />
<strong>evolution</strong>. Proc. Natl Acad. Sci. USA 105, 4283–4288 (2008).<br />
9. Terada, T. et al. Cell proliferative activity in intraductal papillary-mucinous<br />
neoplasms and invasive ductal adenocarcinomas <strong>of</strong> <strong>the</strong> pancreas: an<br />
immunohistochemical study. Arch. Pathol. Lab. Med. 122, 42–46 (1998).<br />
10. Hisa, T. et al. Growth process <strong>of</strong> small pancreatic carcinoma: a case report with<br />
imaging observation for 22 months. World J. Gastroenterol. 14, 1958–1960<br />
(2008).<br />
11. Olive, K. P. et al. Inhibition <strong>of</strong> Hedgehog signaling enhances delivery <strong>of</strong><br />
chemo<strong>the</strong>rapy in a mouse model <strong>of</strong> pancreatic cancer. Science 324, 1457–1461<br />
(2009).<br />
12. Sidransky, D. Emerging molecular markers <strong>of</strong> cancer. Nature Rev. Cancer 2,<br />
210–219 (2002).<br />
13. Embuscado, E. E. et al. Immortalizing <strong>the</strong> complexity <strong>of</strong> cancer <strong>metastasis</strong>: <strong>genetic</strong><br />
features <strong>of</strong> lethal metastatic pancreatic cancer obtained from rapid autopsy.<br />
Cancer Biol. Ther. 4, 548–554 (2005).<br />
14. Fu, B. et al. Evaluation <strong>of</strong> GATA-4 and GATA-5 methylation pr<strong>of</strong>iles in human<br />
pancreatic cancers indicate promoter methylation patterns distinct from o<strong>the</strong>r<br />
human tumor types. Cancer Biol. Ther. 6, 1546–1552 (2007).<br />
15. Peiffer, D. A. et al. High-resolution genomic pr<strong>of</strong>iling <strong>of</strong> chromosomal aberrations<br />
using Infinium whole-genome genotyping. Genome Res. 16, 1136–1148 (2006).<br />
16. Bignell, G. R. et al. Signatures <strong>of</strong> mutation and selection in <strong>the</strong> cancer genome.<br />
Nature 463, 893–898 (2010).<br />
17. Sasaki, K. et al. Relationship between labeling indices <strong>of</strong> KI-67 and brdurd in<br />
human malignant tumors. Cancer 62, 989–993 (1988).<br />
18. Rew, D. A. & Wilson, G. D. Cell production rates in human tissues and tumours and<br />
<strong>the</strong>ir significance. Part II: clinical data. Eur. J. Surg. Oncol. 26, 405–417 (2000).<br />
19. Steel, G. G. The Growth Kinetics <strong>of</strong> Tumours. (Clarendon Press, Oxford, 1977).<br />
20. Amikura, K., Kobari, M. & Matsuno, S. The time <strong>of</strong> occurrence <strong>of</strong> liver <strong>metastasis</strong> in<br />
carcinoma <strong>of</strong> <strong>the</strong> pancreas. Int. J. Pancreatol. 17, 139–146 (1995).<br />
21. Naumov, G. N. et al. A model <strong>of</strong> human tumor dormancy: an angiogenic switch<br />
from <strong>the</strong> nonangiogenic phenotype. J. Natl. Cancer Inst. 98, 316–325 (2006).<br />
Supplementary Information is linked to <strong>the</strong> online version <strong>of</strong> <strong>the</strong> paper at<br />
www.nature.com/nature.<br />
Acknowledgements This work was supported by National Institutes <strong>of</strong> Health grants<br />
CA106610 (C.A.I.-D.), CA62924 (C.A.I.-D., M.A.N.), CA43460 (B.V.), CA57345 (K.W.K.<br />
and V.E.V.), CA121113 (V.E.V. and K.W.K.), GM078986 (M.A.N.), <strong>the</strong> Bill and Melinda<br />
Gates Foundation Grand Challenges Grant 37874, <strong>the</strong> Uehara Memorial Foundation<br />
(S.Y.), <strong>the</strong> AACR-Barletta Foundation (C.A.I.-D.), <strong>the</strong> John Templeton Foundation, Pilot<br />
Funding from <strong>the</strong> Sol Goldman Pancreatic Cancer Research Center, <strong>the</strong> Michael Rolfe<br />
Pancreatic Cancer Foundation, <strong>the</strong> George Rubis Endowment for Pancreatic Cancer<br />
Research, <strong>the</strong> Joseph C. Monastra Foundation for Pancreatic Cancer Research, <strong>the</strong><br />
Alfredo Scatena Memorial Fund, <strong>the</strong> Virginia and <strong>the</strong> D.K. Ludwig Fund for Cancer<br />
Research, The Joint Program in Ma<strong>the</strong>matical Biology and J. Epstein. We would like to<br />
acknowledge T. C. Cornish, C. Henderson, N. Omura and S.-M. Hong for <strong>the</strong>ir technical<br />
assistance in selected aspects <strong>of</strong> this work.<br />
Author Contributions Sample collection and processing was performed by C.A.I.-D.,<br />
S.Y., B.F. and M.K. Microdissection, DNA extractions and whole genome amplification<br />
reactions were performed by S.Y. Sequencing was performed by S.J. Copy number<br />
analyses were performed by R.L. Computational models and estimates <strong>of</strong> clonal<br />
<strong>evolution</strong> were performed by I.B., T.A. and M.A.N.; C.A.I.-D., S.Y., S.J., R.H.H., J.R.E., M.A.N.,<br />
I.B., T.A., V.E.V., K.W.K. and B.V. directed <strong>the</strong> research. C.A.I.-D., B.V., S.Y., I.B. and T.A.<br />
wrote <strong>the</strong> manuscript, which all authors have approved.<br />
Author Information Reprints and permissions information is available at<br />
www.nature.com/reprints. The authors declare no competing financial interests.<br />
Readers are welcome to comment on <strong>the</strong> online version <strong>of</strong> this article at<br />
www.nature.com/nature. Correspondence and requests for materials should be<br />
addressed to C.A.I.-D. (ciacobu@jhmi.edu).<br />
28 OCTOBER 2010 | VOL 467 | NATURE | 1117<br />
©2010<br />
Macmillan Publishers Limited. All rights reserved
RESEARCH LETTER<br />
METHODS<br />
Patients and tissue samples. Tissue samples from seven patients with pancreatic<br />
ductal adenocarcinoma were collected in association with <strong>the</strong> Gastrointestinal<br />
Cancer Rapid Medical Donation Program (GICRMDP). This programme was<br />
approved by <strong>the</strong> Johns Hopkins institutional review board and deemed in accordance<br />
with <strong>the</strong> Health Insurance Portability and Accountability Act. Details <strong>of</strong> <strong>the</strong><br />
programme have been described in detail previously 13 . The tissue harvesting protocol<br />
consists <strong>of</strong> <strong>the</strong> following; after opening <strong>of</strong> <strong>the</strong> body cavity using standard<br />
techniques, <strong>the</strong> whole pancreas including <strong>the</strong> pancreatic cancer and each grossly<br />
identified <strong>metastasis</strong> were sampled using a sterile blade and forceps. The whole<br />
pancreas was sliced into 1 3 1 3 0.4 cm sections for overnight fixation in 10% buffered-formalin,<br />
for freezing in Tissue-Tek OCT compound (Sakura Finetechnical)<br />
in liquid nitrogen and for snap-freezing in liquid nitrogen in 1.7 ml cryovials and<br />
storage at 280 uC. Xenograft enriched or low passage cell lines were generated from<br />
<strong>the</strong> post mortem cancer tissues <strong>of</strong> <strong>the</strong>se seven patients as described previously 13,14 .<br />
Laser capture microdissection (LCM). Frozen tissue sections <strong>of</strong> autopsy tissues<br />
were cut into 7 mm sections using a cryostat and embedded onto UV-treated<br />
PALM membrane slides (Carl Zeiss MicroImaging) and <strong>the</strong> slides were stored<br />
immediately at 280 uC until subsequent fixation. Tissue sections that underwent<br />
LCM were defrosted, fixed in 100% methanol for 3 min, and stained with toluidine<br />
blue before microdissection to remove contaminating stromal elements. Sections<br />
were dissected using a PALM MicroLaser System (Carl Zeiss MicroImaging).<br />
Dissected tissues were catapulted into adhesive caps. Generally, .20,000 cells were<br />
obtained from 5–10 serial sections by LCM to obtain sufficient quantity and<br />
quality <strong>of</strong> genomic DNA for subsequent amplification and sequencing.<br />
Genomic DNA extraction and whole genome amplification. Genomic DNA<br />
from microdissected tissues was extracted using a QIAmp DNA Micro Kit (Qiagen)<br />
according to <strong>the</strong> manufacturer’s protocol. Genomic DNA was quantified by calculating<br />
long interspersed nuclear elements (LINE) by real-time PCR. The LINE<br />
primer set 59-AAAGCCGCTCAACTACATGG-39 (forward) and 59-TGCTTTGA<br />
ATGCGTCCCAGAG-39 (reverse) was designed. The real-time PCR conditions<br />
were 95 uC for 10 min; 40 cycles <strong>of</strong> 94 uC for 10 s, 58 uC for 15 s and 70 uC for<br />
30 s. PCR was carried out using Platinum SYBR Green qPCR SuperMix-UDG<br />
(Invitrogen). To minimize sequencing bias from using low-copy starting temp<strong>late</strong>s,<br />
only samples for which <strong>the</strong> measured concentration by LINE assay was $ 3.3 ng<br />
ml 21 (1,000 genome equivalents) were used as a starting temp<strong>late</strong> for whole genome<br />
amplification (WGA). WGA was performed using 10 ng total temp<strong>late</strong> DNA and<br />
an illustra GenomiPhi V2 DNA Amplification Kit (GE Healthcare), following <strong>the</strong><br />
manufacturer’s protocol. WGA products were purified using a Microspin G-50<br />
system (GE Healthcare). The purified WGA products were quantified by<br />
NanoDrop spectrophotometer (Thermo Fisher Scientific) and diluted to 20 ng ml 21<br />
for sequencing analysis. Using <strong>the</strong>se methods and quality controls, <strong>the</strong>re was complete<br />
concordance in <strong>the</strong> mutational signatures obtained <strong>of</strong> cultured cell lines/<br />
xenografts versus WGA materials prepared from <strong>the</strong>ir matched frozen tissues.<br />
Sanger sequencing. PCR amplification and sequencing was performed using <strong>the</strong><br />
conditions and primers described previously 5 . A small number <strong>of</strong> sequencing reactions<br />
failed (,2% <strong>of</strong> <strong>the</strong> total reactions) and <strong>the</strong>se corresponding genes were not<br />
included in progression models or quantitative time estimates <strong>of</strong> clonal <strong>evolution</strong>.<br />
Genotyping. The Illumina Infinium II Whole Genome Genotyping Assay using<br />
<strong>the</strong> BeadChip platform was used to analyse tumour samples at 1,072,820 (1M)<br />
SNP loci as previously described 5 . Briefly, all SNP positions were based on <strong>the</strong> hg18<br />
(NCBI Build 36, March 2006) version <strong>of</strong> <strong>the</strong> human genome reference sequence.<br />
The genotyping assay begins with hybridization to a 50-nucleotide oligonucleotide,<br />
followed by a two-colour fluorescent single-base extension. Fluorescence<br />
intensity image files were processed using Illumina BeadStation s<strong>of</strong>tware to provide<br />
normalized intensity values and allelic frequency for each SNP position. For<br />
each SNP, <strong>the</strong> normalized experimental intensity value (R) was compared to <strong>the</strong><br />
intensity values for that SNP from a training set <strong>of</strong> normal samples and represented<br />
as a ratio (called <strong>the</strong> ‘log R ratio’) <strong>of</strong> log 2 (R experimental/R training set). For each<br />
SNP, <strong>the</strong> normalized allele intensity ratio (<strong>the</strong>ta) was used to estimate a quantitative<br />
allelic frequency value (called <strong>the</strong> ‘B allele frequency’) for that SNP 15 . Using<br />
Illumina BeadStudio s<strong>of</strong>tware, log R ratio and B allele frequency values were<br />
plotted along chromosomal coordinates and examined visually. Regions <strong>of</strong> loss<br />
<strong>of</strong> heterozygosity (LOH) were identified as genomic regions .2 megabases (Mb)<br />
with consecutive homozygous genotype calls (B allele frequency near 0 or 1).<br />
Smaller (,2 Mb) regions <strong>of</strong> LOH were identified by requiring co-occurrence <strong>of</strong><br />
decreased log R ratio scores in regions <strong>of</strong> consecutive homozygous genotype calls<br />
(B allele frequency near 0 or 1). Visual analysis <strong>of</strong> <strong>the</strong>se data plotted along chromosomal<br />
coordinates was followed by manual analysis <strong>of</strong> <strong>the</strong> data for selected genes <strong>of</strong><br />
interest.<br />
Estimations <strong>of</strong> proliferation rates. To estimate <strong>the</strong> cell division rate, <strong>the</strong> Ki-67<br />
labelling index (LI) in <strong>the</strong> proband lesion for each case was calcu<strong>late</strong>d. The Ki-67 LI<br />
on <strong>the</strong> pancreatic ducts in <strong>the</strong> histologically normal pancreas parenchyma was also<br />
©2010<br />
Macmillan Publishers Limited. All rights reserved<br />
calcu<strong>late</strong>d. Normal pancreas was collected from two autopsied patients who died <strong>of</strong><br />
causes o<strong>the</strong>r than pancreatic cancer and five patients who underwent distal pancreatectomy<br />
for a serous cystadenoma or an islet cell tumour at The Johns Hopkins<br />
Hospital. Paraffin blocks were cut into sections 4-mmthickforKi-67immunostaining<br />
with all staining processes from deparaffinization to counterstaining with haematoxylin<br />
being performed automatically with <strong>the</strong> Ventana Discovery staining<br />
system (Ventana Medical Systems). An anti-human Ki-67 mouse monoclonal<br />
antibody (Clone MIB-1, Dako Cytomation) was used. At least 12 randomly selected<br />
high-power fields containing a minimum <strong>of</strong> 2,000 cells were evaluated for each case,<br />
and <strong>the</strong> labelling index (LI) was calcu<strong>late</strong>d as <strong>the</strong> percentage <strong>of</strong> positive cell nuclei.<br />
Reactive small lymphocytes in each case were regarded as internal positive controls<br />
for Ki-67. Equal or more intense nuclear staining in comparison with <strong>the</strong> internal<br />
positive controls was considered to indicate positivity.<br />
Modelling tumour <strong>evolution</strong>. Passenger mutations were defined as those unlikely<br />
to drive tumorigenesis. To be conservative, we considered passenger mutations as<br />
those not included as candidate cancer genes in a recent study based on whole<br />
exome sequencing <strong>of</strong> 24 pancreatic cancers5 . As <strong>the</strong> great majority <strong>of</strong> mutations<br />
identified in cancers are believed to be passengers, <strong>the</strong> results <strong>of</strong> <strong>the</strong> model are not<br />
highly dependent on <strong>the</strong> model used to estimate <strong>the</strong> relatively small number <strong>of</strong><br />
drivers16 .<br />
Because passenger mutations are neutral and do not affect <strong>the</strong> <strong>evolution</strong> in any<br />
way, <strong>the</strong>y are accumu<strong>late</strong>d independently in each cell lineage. Following <strong>the</strong><br />
lineage <strong>of</strong> <strong>the</strong> founder cell <strong>of</strong> <strong>the</strong> parental clone back in time, we can assume that<br />
it acquired a new neutral mutation with rate r at each cell division, with r being <strong>the</strong><br />
product <strong>of</strong> <strong>the</strong> mutation rate per base pair per cell division and <strong>the</strong> number <strong>of</strong> base<br />
pairs sequenced. The accumulation <strong>of</strong> neutral mutations in a cell lineage can be<br />
well-described by a Poisson process with rate r per cell division. We are interested<br />
in <strong>the</strong> number <strong>of</strong> cell divisions in <strong>the</strong> single lineage between tumour initiation and<br />
birth <strong>of</strong> <strong>the</strong> founder cell <strong>of</strong> <strong>the</strong> parental clone <strong>during</strong> which N1 passenger mutations<br />
accumu<strong>late</strong>. On <strong>the</strong> o<strong>the</strong>r hand, N1 is also <strong>the</strong> number <strong>of</strong> mutations that are found<br />
in all tumour samples from one patient. Since we sequenced at least one sample<br />
from <strong>the</strong> primary tumour and at least three samples from different metastases<br />
from each patient, <strong>the</strong>se specific N1 mutations had to be present in <strong>the</strong> founder<br />
cells <strong>of</strong> all three metastases and in cells in <strong>the</strong> primary tumour. Thus <strong>the</strong>re was a cell<br />
in <strong>the</strong> tumour that had <strong>the</strong>se N1 specific mutations for <strong>the</strong> first time, and that is, by<br />
definition, <strong>the</strong> founder cell <strong>of</strong> <strong>the</strong> parental clone. Since we can neglect <strong>the</strong> accumulation<br />
<strong>of</strong> mutations before <strong>the</strong> onset <strong>of</strong> <strong>the</strong> tumour, <strong>the</strong>se N1 mutations are<br />
accumu<strong>late</strong>d along <strong>the</strong> single lineage from <strong>the</strong> tumour initiator cell to <strong>the</strong> founder<br />
cell <strong>of</strong> <strong>the</strong> parental clone. As <strong>the</strong> number <strong>of</strong> cell divisions between two subsequent<br />
mutations is distributed according to an exponential distribution with mean 1/r,<br />
<strong>the</strong> required number <strong>of</strong> cell divisions is <strong>the</strong> sum <strong>of</strong> N1 independent exponentially<br />
distributed random variables with mean 1/r, and is distributed according to a<br />
Gamma distribution with shape parameter N1 and scale parameter 1/r. pffiffiffiffiffiffiffiffiffiffi<br />
The mean<br />
<strong>of</strong> this distribution is N1/r and <strong>the</strong> standard deviation is<br />
N1=r<br />
Supplementary Table 6). Because <strong>the</strong> number <strong>of</strong> base pairs sequenced in <strong>the</strong> study<br />
is 31.7 3 10 6 , and <strong>the</strong> mutation rate per base pair per generation is estimated at<br />
5 3 10 210 , r 5 31.7 3 10 6 3 5 3 10 210 < 0.016 per generation 8 .<br />
Using our measurements <strong>of</strong> Ki-67 labelling index <strong>of</strong> <strong>the</strong> seven index lesions<br />
(average 16.3%), we were able to estimate <strong>the</strong> S-phase fraction <strong>of</strong> cells in <strong>the</strong> seven<br />
index lesions (average LI 5 9.5%) 17 . Assuming a median value for <strong>the</strong> S-phase<br />
duration in human tissues and tumours, Ts, <strong>of</strong> 10 h (ref. 18) and using <strong>the</strong> formula<br />
for <strong>the</strong> potential cell doubling time Tpot 5 lTs/LI, we get an estimate for Tpot <strong>of</strong><br />
3.5 days. Here l is a correction factor for <strong>the</strong> nonlinear age distribution <strong>of</strong> cells<br />
through <strong>the</strong> cell cycle, which was assumed to be 0.8 (ref. 19). This estimate is<br />
consistent with <strong>the</strong> average cell doubling time in pancreatic cancer from ref. 20 <strong>of</strong><br />
2.3 days. We use this latter estimate in our analysis, as we believe it is more accurate<br />
for pancreatic cancer.<br />
Our model works very well for estimating <strong>the</strong> number <strong>of</strong> cell divisions between<br />
discrete events in tumour <strong>evolution</strong>. In order to go from number <strong>of</strong> cell divisions to<br />
actual time we need to have an estimate for <strong>the</strong> average rate <strong>of</strong> cell division. The<br />
accuracy <strong>of</strong> our predictions regarding actual time <strong>the</strong>refore depends on <strong>the</strong> accuracy<br />
<strong>of</strong> that estimate. If we let Tgen denote <strong>the</strong> average time between subsequent cell<br />
divisions in a cell lineage, we arrive at <strong>the</strong> expression for time T1:<br />
T1~ Tgen<br />
r<br />
(N1+ ffiffiffiffiffi p<br />
N1):<br />
We <strong>the</strong>refore estimate <strong>the</strong> number <strong>of</strong> cell divisions, and hence <strong>the</strong> time T 1<br />
between tumour initiation and birth <strong>of</strong> <strong>the</strong> founder cell <strong>of</strong> <strong>the</strong> parental clone, to<br />
be proportional to <strong>the</strong> number <strong>of</strong> passenger mutations, N1, that <strong>the</strong> tumour<br />
acquired <strong>during</strong> that time. In our calculations, we use <strong>the</strong> estimate for cell doubling<br />
time in pancreatic cancer from <strong>the</strong> literature 20 as <strong>the</strong> value <strong>of</strong> Tgen.<br />
T2 is determined analogously, with N2 defined as <strong>the</strong> number <strong>of</strong> passenger<br />
mutations present in <strong>the</strong> index lesion but not in <strong>the</strong> parental clone. T3 is<br />
(see
determined from literature-based estimates <strong>of</strong> <strong>the</strong> tumour and cell doubling times,<br />
and <strong>the</strong> size <strong>of</strong> <strong>the</strong> index lesions at autopsy 20 .<br />
The median doubling time <strong>of</strong> pancreatic cancer metastases was reported as<br />
56 days 20 . To estimate <strong>the</strong> age <strong>of</strong> <strong>the</strong> index <strong>metastasis</strong>, we used a two stage model.<br />
©2010<br />
Macmillan Publishers Limited. All rights reserved<br />
LETTER RESEARCH<br />
We estimated <strong>the</strong> tumour doubling time was equal to <strong>the</strong> cell doubling time<br />
(Tgen) until <strong>the</strong> tumour size reached 100 mm in diameter at which time angiogenesis<br />
is required 21 . Thereafter, we used <strong>the</strong> median doubling time described<br />
above.