A Geographical Analysis of Knowledge Production ... - ResearchGate
A Geographical Analysis of Knowledge Production ... - ResearchGate
A Geographical Analysis of Knowledge Production ... - ResearchGate

You also want an ePaper? Increase the reach of your titles
YUMPU automatically turns print PDFs into web optimized ePapers that Google loves.
ABSTRACT<br />
A <strong>Geographical</strong> <strong>Analysis</strong> <strong>of</strong> <strong>Knowledge</strong><br />
<strong>Production</strong> in Computer Science<br />
We analyze knowledge production in Computer Science by<br />
means <strong>of</strong> coauthorship networks. For this, we consider 30<br />
graduate programs <strong>of</strong> different regions <strong>of</strong> the world, being 8<br />
programs in Brazil, 16 in North America (3 in Canada and<br />
13 in the United States), and 6 in Europe (2 in France, 1<br />
in Switzerland and 3 in the United Kingdom). We use a<br />
dataset that consists <strong>of</strong> 176,537 authors and 352,766 publication<br />
entries distributed among 2,176 publication venues.<br />
The results obtained for different metrics <strong>of</strong> collaboration<br />
social networks indicate the process <strong>of</strong> knowledge production<br />
has changed differently for each region. Research is<br />
increasingly done in teams across different fields <strong>of</strong> Computer<br />
Science. The size <strong>of</strong> the giant component indicates<br />
the existence <strong>of</strong> isolated collaboration groups in the European<br />
network, contrasting to the degree <strong>of</strong> connectivity<br />
found in the Brazilian and North-American counterparts.<br />
We also analyzed the temporal evolution <strong>of</strong> the social networks<br />
representing the three regions. The number <strong>of</strong> authors<br />
per paper experienced an increase in a time span <strong>of</strong><br />
12 years. We observe that the number <strong>of</strong> collaborations between<br />
authors grows faster than the number <strong>of</strong> authors, benefiting<br />
from the existing network structure. The temporal<br />
evolution shows differences between well-established fields,<br />
such as Databases and Computer Architecture, and emerging<br />
fields, like Bioinformatics and Geoinformatics. The patterns<br />
<strong>of</strong> collaboration analyzed in this paper contribute to<br />
an overall understanding <strong>of</strong> Computer Science research in<br />
different geographical regions that could not be achieved<br />
without the use <strong>of</strong> complex networks and a large publication<br />
database.<br />
Categories and Subject Descriptors<br />
H.4 [Information Systems Applications]: Miscellaneous<br />
General Terms<br />
Experimentation<br />
Keywords<br />
Coauthorship Networks, Computer Science, Collaboration<br />
Social Networks<br />
Copyright is held by the author/owner(s).<br />
WWW2009, April 20-24, 2009, Madrid, Spain.<br />
.<br />
Guilherme Vale Menezes, Nivio Ziviani,<br />
Alberto H. F. Laender, Virgílio Almeida<br />
Computer Science Department<br />
Federal University <strong>of</strong> Minas Gerais<br />
31270-901 Belo Horizonte, Brazil<br />
{gmenezes, nivio, laender, virgilio}@dcc.ufmg.br<br />
1. INTRODUCTION<br />
A social network is a collection <strong>of</strong> people, each <strong>of</strong> whom is<br />
acquainted with some subset <strong>of</strong> the others [13]. According to<br />
Social Science terminology, individuals or groups are called<br />
actors, and relationships between them are called ties [15].<br />
Ties may represent friendship, acquaintance, collaboration,<br />
affiliation, or even the transmission <strong>of</strong> diseases between actors.<br />
Social network analysis help us understand the social<br />
behavior <strong>of</strong> these actors.<br />
In scientific collaboration social networks, actors are authors<br />
and a tie exists between two authors if they have<br />
already collaborated on the production <strong>of</strong> some work in a<br />
given period <strong>of</strong> time. In this way, network measures can be<br />
employed to obtain information regarding a scientific community<br />
specific characteristics, or to compare two or more<br />
communities according to these characteristics.<br />
It is important to stress that a collaboration among two<br />
authors implies in a certain affinity between them: authors<br />
collaborate if they are interested in the same area, if they are<br />
affiliated to the same organization, or if they at least speak<br />
the same language. Accordingly, if authors publish intensely<br />
with each other, meaning they have many instances <strong>of</strong> collaboration<br />
in a given period <strong>of</strong> time, it can be said that they<br />
have great affinity.<br />
We can also analyze a social network from a temporal<br />
perspective, since in some networks actors and ties may be<br />
created or destroyed at any point in time. In this sense, a<br />
social network evolves over time and its evolving characteristics<br />
can be measured and studied during this process. For<br />
instance, a collaboration social network has to incorporate<br />
the publishing <strong>of</strong> new papers by adding new authors and<br />
collaborations into the network. Each paper has a publishing<br />
date, and thus any period <strong>of</strong> collaboration can be set for<br />
the study <strong>of</strong> collaboration network characteristics.<br />
During the last decades, the advent and popularization <strong>of</strong><br />
the Web has helped prosper the study <strong>of</strong> social networks,<br />
creating opportunities for the study <strong>of</strong> social networks in an<br />
unprecedented scale. Online social networks such as Facebook<br />
1 , MySpace 2 , Flickr 3 , Orkut 4 , among many other examples,<br />
are today commonly found and each one have millions<br />
<strong>of</strong> users. Scientific collaboration networks may also be<br />
1 http://www.facebook.com/.<br />
2 http://www.myspace.com/.<br />
3 http://www.flickr.com/.<br />
4 http://www.orkut.com/.
easily obtained from existing Web services, such as DBLP 5 ,<br />
CiteSeer 6 , Google Scholar 7 , and Micros<strong>of</strong>t Libra 8 .<br />
This paper analyzes characteristics <strong>of</strong> collaboration social<br />
networks in Computer Science communities, formed by researchers<br />
and their publications. The study relies on datasets<br />
collected from DBLP. It includes three phases. First, we<br />
study measurements <strong>of</strong> collaboration networks from three<br />
regions <strong>of</strong> the world, namely a network <strong>of</strong> 8 Brazilian graduate<br />
programs, a network <strong>of</strong> 3 Canadian and 13 US graduate<br />
programs, and a network <strong>of</strong> 2 French, 1 Swiss and 3 British<br />
graduate programs. Second, we carry out a temporal analysis<br />
<strong>of</strong> three networks and four different Computer Science<br />
fields, over a time span <strong>of</strong> 12 years. Finally, we analyze<br />
a graph <strong>of</strong> interrelationships among 30 Computer Science<br />
subfields.<br />
Computer Science is a field that has distinct features when<br />
compared to other traditional research fields, such as Biology,<br />
Physics, Chemistry or Mathematics. A Computer<br />
Science paper can become obsolete due to new technological<br />
breakthroughs in a matter <strong>of</strong> months. Furthermore, the field<br />
is a relatively new one and there is an ongoing effort to fit it<br />
in academic institutions’ plans. As a consequence, it is important<br />
to understand intrinsic characteristics <strong>of</strong> Computer<br />
Science departments and researchers. This paper analyzes<br />
the knowledge production process in Computer Science in<br />
different geographical regions, using a social network approach.<br />
This paper is organized as follows. Section 2 shows some<br />
related work. Section 3 lists the graduate programs addressed<br />
in our study and describes the data gathering process.<br />
In sequence, Section 4 describes the characteristics <strong>of</strong><br />
the networks for the three sets <strong>of</strong> countries and Section 5<br />
discusses the results <strong>of</strong> the temporal evolution analysis <strong>of</strong><br />
these three networks. A study <strong>of</strong> the interrelationship between<br />
subfields is presented in Section 6. Lastly, Section 7<br />
presents our conclusions.<br />
2. RELATED WORK<br />
In this section, we present a brief overview <strong>of</strong> some recent<br />
work on coauthorship networks. Newman [13] compares<br />
graph characteristics <strong>of</strong> several scientific communities,<br />
including Biomedicine, Physics and Computer Science. In<br />
general, their clustering coefficient is high and their characteristic<br />
path length is short. Collaboration network features<br />
<strong>of</strong> the digital library community are studied in [10], in<br />
which the authors conduct connected component measurements,<br />
clustering coefficient measurements, among others.<br />
A similar analysis for the Data and <strong>Knowledge</strong> Engineering<br />
journal, the s<strong>of</strong>tware reverse engineering community, and<br />
the SIGMOD conference is presented in [4], [6], and [12]<br />
respectively.<br />
Barabasi et al [1] analyze coauthorship graphs using a<br />
database containing relevant journals in Mathematics and<br />
Neuroscience for an 8-year period (1991−1998). The authors<br />
infer the dynamic and the structural mechanisms that<br />
govern the evolution and topology <strong>of</strong> this two scientific fields.<br />
The results indicate that the network is scale-free and that<br />
the network evolution is governed by preferential attach-<br />
5 http://www.informatik.uni-trier.de/∼ley/db/.<br />
6 http://citeseer.ist.psu.edu/.<br />
7 http://scholar.google.com/.<br />
8 http://libra.msra.cn/.<br />
ment, affecting both internal and external links.<br />
Böner et al [2] analyze the impact <strong>of</strong> coauthorship teams<br />
based on the number <strong>of</strong> publications and their citations on<br />
a local and global scale. The authors use a weighted graph<br />
representation that encodes coupled author-paper networks<br />
as a weighted coauthorship graph. This weighted graph representation<br />
is applied to a dataset comprising <strong>of</strong> 614 articles<br />
published by 1,036 unique authors between 1974 and 2004.<br />
The reference characterizes the properties and evolution <strong>of</strong><br />
a new subfield <strong>of</strong> science: Information Visualization.<br />
Wuchty et al [19] study the evolution <strong>of</strong> the number <strong>of</strong> authors<br />
(team sizes) in publications from science and engineering,<br />
social sciences, the arts and humanities, and patents,<br />
showing that teams increasingly dominate solo authors in<br />
the production <strong>of</strong> knowledge in the four datasets.<br />
In [8], the authors use the same data source adopted in<br />
this paper to study the quality <strong>of</strong> the top 8 Brazilian graduate<br />
programs in Computer Science. They compare the scientific<br />
production <strong>of</strong> the top Brazilian programs with that<br />
<strong>of</strong> reputable North-American and European programs. Furthermore,<br />
they also observe a ratio <strong>of</strong> more than 2 conference<br />
papers for each journal article in all programs in Brazil,<br />
North-America and Europe, which appears to be an important<br />
characteristic <strong>of</strong> the field.<br />
3. DATA GATHERING<br />
Our study addresses the Computer Science graduate programs<br />
from the same 30 institutions reported in [8], being 8<br />
from Brazil, 16 from North America (3 from Canada and 13<br />
from the United States), and 6 from Europe (2 from France,<br />
1 from Switzerland and 3 from the United Kingdom). The<br />
sample was based on the ease <strong>of</strong> accessing information about<br />
the institutions, but all are included in top positions <strong>of</strong> existing<br />
Computer Science program rankings. They are listed<br />
below.<br />
• Brazil: Federal University <strong>of</strong> Minas Gerais, Federal<br />
University <strong>of</strong> Pernambuco, Federal University <strong>of</strong> Rio<br />
de Janeiro, Federal University <strong>of</strong> Rio Grande do Sul,<br />
Pontifical Catholic University <strong>of</strong> Rio de Janeiro, University<br />
<strong>of</strong> Campinas, University <strong>of</strong> São Paulo at São<br />
Paulo, and University <strong>of</strong> São Paulo at São Carlos.<br />
• Canada: University <strong>of</strong> British Columbia, University<br />
<strong>of</strong> Toronto, and University <strong>of</strong> Waterloo.<br />
• France: École Polytechnique and Université Pierre et<br />
Marie Curie − Paris VI.<br />
• Switerland: ETH Zürich.<br />
• United Kingdom: Cambridge University, Imperial<br />
College, and Oxford University.<br />
• United States: Brown University, California Technology<br />
Institute, Carnegie Mellon University, Cornell<br />
University, Harvard University, University <strong>of</strong> Illinois at<br />
Urbana-Champaign, Massachusetts Institute <strong>of</strong> Technology,<br />
Princeton University, Stanford University, University<br />
<strong>of</strong> California at Berkeley, University <strong>of</strong> Texas<br />
at Austin, University <strong>of</strong> Washington, and University<br />
<strong>of</strong> Wisconsin.<br />
The data gathering process for our study involved three<br />
main steps. In the first step, we extracted from the home
pages <strong>of</strong> the respective institutions the names <strong>of</strong> the faculty<br />
members <strong>of</strong> the 30 graduate programs. In the second step,<br />
using the names <strong>of</strong> these faculty members, we collected from<br />
DBLP their respective pages, the pages <strong>of</strong> their coauthors,<br />
and the pages <strong>of</strong> the coauthors <strong>of</strong> these coauthors, extracting<br />
from them the corresponding publication data. All this<br />
data was stored in a relational database in order to provide<br />
us with a flexible querying environment. Finally, in<br />
the third step, we associated each publication venue (conference<br />
or journal) in the database to a specific Computer<br />
Science subfield. For this, we used a list <strong>of</strong> 30 Computer<br />
Science subfields that reflect the special interest groups <strong>of</strong><br />
the Brazilian Computer Society, as shown in Table 1.<br />
This data gathering process summed up 176,537 authors<br />
and 352,766 publications (conference papers and journal articles),<br />
distributed among 2,176 distinct venues. The data<br />
was collected from the DBLP repository on June 27, 2007,<br />
and refer to articles published between 1954 and 2007. These<br />
numbers are summarized in Table 2. Figure 1 shows the<br />
number <strong>of</strong> authors and the number <strong>of</strong> publications over a<br />
period <strong>of</strong> 12 years, from 1994 to 2006. Notice that the number<br />
<strong>of</strong> papers grows faster than the number <strong>of</strong> authors in the<br />
period, since older authors continue to establish connections<br />
over time.<br />
Table 1: Computer Science Subfields<br />
Algorithms and Theory Applied Computing<br />
Artificial Intelligence Bioinformatics<br />
Circuit Conception Computer Architecture<br />
Computer Graphics<br />
Computer Networks and<br />
Distributed Systems<br />
Computer Vision Data Mining<br />
Databases<br />
Formalisms, Logics and<br />
Semantics<br />
Geoinformatics<br />
Embedded Systems and<br />
Real-Time Systems<br />
Games and<br />
Entertainment<br />
Human-Computer<br />
Interaction<br />
Informatics in Education Information Retrieval<br />
Information Systems Machine Learning<br />
Modelling and<br />
Simulation<br />
Operation Systems<br />
Programming Languages<br />
Natural Language<br />
Processing<br />
Operational Research<br />
and Optimization<br />
Robotics, Automation<br />
and Control<br />
Security and Privacy S<strong>of</strong>tware Engineering<br />
Ubiquitous Computing<br />
Web, Hypermedia<br />
Systems, Multimedia<br />
4. COAUTHORSHIP NETWORKS<br />
In this section we describe the three coauthorship networks,<br />
generated from data gathered from DBLP, and present<br />
some statistics about them. Before that, we discuss some so-<br />
Number <strong>of</strong> Items<br />
350000<br />
300000<br />
250000<br />
200000<br />
150000<br />
100000<br />
50000<br />
Authors<br />
Papers<br />
Table 2: Data Summary<br />
Programs 30<br />
Authors 176,537<br />
Publications 352,766<br />
Venues 2,176<br />
0<br />
1994 1996 1998 2000<br />
Time (years)<br />
2002 2004 2006<br />
Figure 1: Number <strong>of</strong> Authors and Number <strong>of</strong> Papers<br />
over Time<br />
cial network fundamentals.<br />
4.1 Fundamentals<br />
Collaboration social networks are modeled as undirected,<br />
unweighted graphs, in which there is an edge between two<br />
actors if they have collaborated at least once during a certain<br />
period <strong>of</strong> time. In a coauthorship network, nodes represent<br />
authors, and two authors are connected by an edge if they<br />
have coauthored one or more papers, as shown in Figure 2.<br />
Figure 2: A Coauthorship Network<br />
The modelling <strong>of</strong> a coauthorship network as a graph allows<br />
the use <strong>of</strong> some interesting measures. A possibility is the<br />
connected component analysis, which consists in measuring<br />
the size <strong>of</strong> the giant component (or the largest connected<br />
component) [15]. A connected component is a maximal connected<br />
subgraph. Two vertices are in the same connected<br />
component if and only if there exists a path between them.<br />
The measure consists in computing the fraction <strong>of</strong> graph<br />
vertices that are part <strong>of</strong> the giant component.<br />
The distance between two nodes <strong>of</strong> a network is the length<br />
<strong>of</strong> the shortest path between them. The average distance
over all pairs <strong>of</strong> nodes represents the average separation <strong>of</strong><br />
the coauthorship network and characterizes its interconnectedness.<br />
Another measure is the graph diameter, which is the<br />
longest distance between any two vertices <strong>of</strong> the graph. If<br />
we think <strong>of</strong> an edge as a means for conducting information<br />
between actors, the information can be spread more rapidly<br />
among actors in a graph with smaller diameter.<br />
A measure related to the graph diameter is the graph<br />
characteristic path size [15] (or average path size) calculated<br />
by computing the shortest path between every pair <strong>of</strong> vertices<br />
and calculating their average. A graph with a smaller<br />
characteristic path size can also conduct information faster<br />
than a graph with a long characteristic path size.<br />
Social networks typically have a small characteristic path<br />
size, which classify them as small-world networks. The small<br />
world phenomenon was identified for the first time in [11], in<br />
which the author obtained evidence that any two individuals<br />
in the United States are separated by a path formed by 6<br />
individuals, on average. This phenomenon was later called<br />
the six degrees <strong>of</strong> separation phenomenon. In this context, a<br />
small characteristic path size is orders <strong>of</strong> magnitude smaller<br />
than the number <strong>of</strong> graph vertices.<br />
In the context <strong>of</strong> a coauthorship social network, the clustering<br />
coefficient measures the degree <strong>of</strong> transitivity in the<br />
publishes with relationship that defines the graph. As an<br />
example, if the clustering coefficient is high, there is a high<br />
probability that a relationship between authors A and B,<br />
and another relationship between authors B and C will induce<br />
a relationship also between authors A and C. In other<br />
words, the clustering coefficient <strong>of</strong> a node in the coauthorship<br />
network indicates how much an author’s collaborators<br />
are willing to collaborate with each other. In this sense, the<br />
clustering coefficient indicates the existence <strong>of</strong> ordering in a<br />
local level [17]. More formally, the clustering coefficient <strong>of</strong> a<br />
node i can be defined as<br />
Ci =<br />
Number <strong>of</strong> triangles connected to vertex i<br />
Number <strong>of</strong> triples centered on vertex i .<br />
The global clustering coefficient is the average clustering<br />
coefficient <strong>of</strong> all nodes in the network, which can take values<br />
between 0 and 1 [18].<br />
The assortative mixing <strong>of</strong> a network refers to the preference<br />
<strong>of</strong> vertices with high degree to be connected to other<br />
vertices with high degree. The assortative mixing <strong>of</strong> a network<br />
can be quantified using a connected degree-degree correlation<br />
function [3], in which a positive number indicates<br />
an assortative network, a negative number indicates a disassortative<br />
network (i.e., vertices with high degree connect<br />
to other vertices with low degree), and 0 indicates a network<br />
without assortativity. Social networks are known to<br />
be assortatively mixed, while technological and biological<br />
networks tend to be disassortative [14].<br />
4.2 Statistics <strong>of</strong> the Three Networks<br />
The three generated networks represent Brazilian, North-<br />
American and European programs, from now on referred to<br />
as Br, Ca-US and Fr-Sw-UK networks, respectively. The basic<br />
statistics <strong>of</strong> these networks are summarized in Table 3.<br />
The largest network is the Ca-US network with 1,008 authors<br />
and 40,039 papers over a 12-year period. The number<br />
<strong>of</strong> papers per author is much larger for researchers in US and<br />
Canada, dwarfing the two other networks. The number <strong>of</strong><br />
papers per author was calculated by averaging the number<br />
<strong>of</strong> papers for each author in the dataset. Notice that this<br />
is different from simply calculating the division between the<br />
number <strong>of</strong> papers and the number <strong>of</strong> authors, since each paper<br />
can have more than one author. The Ca-US network<br />
has the highest number <strong>of</strong> papers per author (45.89), much<br />
higher than the the Fr-Sw-UK (19.85) and the Br (16.06)<br />
measurements.<br />
The number <strong>of</strong> authors per paper exhibit a similar pattern<br />
for the three networks, ranging from 2.87 to 3.21. It is worthnoting<br />
that these numbers vary significantly across different<br />
subject areas. In [16], the number <strong>of</strong> author per papers in<br />
Biology, Physics and Mathemetics vary from 5.1 to 6.9, reflecting<br />
differences in the way research is done in those fields.<br />
The number <strong>of</strong> callaborators an author has in the Br and<br />
Fr-Sw-Ok networks are very close (18.64 and 17.78, respectively),<br />
whereas in the Ca-Us network this number is more<br />
than two times higher (42.11). This is presumably a result <strong>of</strong><br />
the way computer scientists work in US and Canada, where<br />
there exists many links among universities and companies.<br />
Table 3: Statistics for the Br, Ca-US and Fr-Sw-UK<br />
Networks<br />
Br Ca-US Fr-Sw-UK<br />
Number <strong>of</strong> Authors 357 1,008 488<br />
Number <strong>of</strong> Papers 4,405 40,039 8,764<br />
Papers per Author 16.06 45.89 19.85<br />
Authors per Paper 3.21 2.87 2.77<br />
Average<br />
Collaborators<br />
18.64 42.11 17.78<br />
Giant Component<br />
Average Giant<br />
78.15% 78.27% 26.17%<br />
Component for<br />
Isolated Programs<br />
67,41% 56,46% 30,01%<br />
Average Path<br />
Length<br />
6.47 4.42 6.18<br />
Diameter 16 12 15<br />
Clustering<br />
Coefficient<br />
0.30 0.20 0.38<br />
αDegreeDistribution 1.51 1.77 1.89<br />
Assortativity 0.25 0.35 0.38<br />
Now we present a comparative analysis <strong>of</strong> structural features<br />
<strong>of</strong> the three networks, by comparing measurements<br />
that characterize the network structure. The number <strong>of</strong><br />
nodes <strong>of</strong> the the giant component plays an important role<br />
in coauthorship networks, since it represents the portion <strong>of</strong><br />
the authors that are connected via collaboration. Any author<br />
in the giant component can be reached from any other<br />
by traversing a path <strong>of</strong> intermediate coauthors. The figure<br />
<strong>of</strong> 78% for the size <strong>of</strong> giant component in Ca-US and<br />
Br indicates that the majority <strong>of</strong> Computer Science authors<br />
in these regions are connected, avoiding the proliferation <strong>of</strong><br />
small isolated communities.<br />
In contrast, the giant component size in Fr-Sw-UK is only<br />
26%. One possible explanation is the existence <strong>of</strong> graduate<br />
programs from different countries (with different languages)
in this network, which makes the integration between different<br />
communities more difficult. However, we have also<br />
measured the size <strong>of</strong> the giant component inside isolated<br />
graduate programs, disconsidering relationships with other<br />
programs, and we have found that the average size <strong>of</strong> the<br />
giant component inside the programs in the Fr-Sw-UK network<br />
is also considerably smaller when compared with Br<br />
and Ca-US networks. This may be an indication that the<br />
formation <strong>of</strong> isolated communities is an intrinsic characteristic<br />
<strong>of</strong> scientific collaboration in the Fr-Sw-UK network.<br />
According to [16], the average distance over all pairs <strong>of</strong><br />
nodes in Biology is 4.6 whereas in Mathematics is 7.6. Likewise,<br />
our three networks show an average distance that varies<br />
from 4.4 to 6.4, much smaller than their size, indicating the<br />
presence <strong>of</strong> “small world” effects [11]. The diameter <strong>of</strong> the<br />
three networks, i.e., the largest shortest path <strong>of</strong> the networks,<br />
is between 12 and 16.<br />
The average clustering coefficient over the Ca-US network<br />
is 0.20, whereas the clustering coefficient in the Fr-Sw-UK<br />
network is higher, at 0.38. Both values are typical <strong>of</strong> social<br />
networks [15]. The low clustering coefficient <strong>of</strong> the Ca-US<br />
network indicates a high level <strong>of</strong> collaboration between authors,<br />
which is likely a sign <strong>of</strong> both the increasing in the<br />
number <strong>of</strong> nodes and the multidisciplinarity <strong>of</strong> the authors,<br />
since it is likely that two collaborators that do not collaborate<br />
among themselves belong to different fields.<br />
The presence <strong>of</strong> positive assortative mixing (i.e., positive<br />
degree correlations) between adjacent nodes suggests that<br />
coauthorship networks can be largely understood in terms <strong>of</strong><br />
the organization <strong>of</strong> nodes into communities <strong>of</strong> collaboration,<br />
a feature that can explain, to some extent, the observed<br />
values for the clustering coefficient and assortativity.<br />
A network metric that has been much studied for various<br />
networks is the degree distribution, P(k), giving the fraction<br />
<strong>of</strong> nodes that have k edges. Figure 3 characterizes the<br />
degree k distribution for the Ca-US network as a power law<br />
P(k) ∝ 1/k α , with exponent α = 1.77. Br and Fr-Sw-UK<br />
networks follow similar distributions with exponents α =<br />
1.51 and 1.89, respectively. Networks for which P(k) has a<br />
power-law tail are known as scale-free networks, indicating<br />
that a small number <strong>of</strong> authors concentrate a very large<br />
number <strong>of</strong> collaborations whereas a large number <strong>of</strong> authors<br />
have a few coauthors. The largest is α, the largest is the<br />
difference between the more frequent and the less frequent<br />
degree values.<br />
5. TEMPORAL EVOLUTION<br />
We performed an analysis <strong>of</strong> the Br, Fr-Sw-UK and Ca-<br />
US networks over a span <strong>of</strong> 12 years, from 1994 to 2006.<br />
Our data was obtained in June 2007, which means the last<br />
complete year in our dataset is 2006. We considered that a<br />
period <strong>of</strong> 12 years is enough to show the recent trends in the<br />
evolution <strong>of</strong> these networks.<br />
5.1 Evolution <strong>of</strong> the Three Networks<br />
Our first step was to measure the cumulative number <strong>of</strong><br />
vertices over time in the three networks. The number <strong>of</strong><br />
vertices for each year is the union <strong>of</strong> the active vertices for<br />
that year and for every year that precedes it. An author<br />
that published a paper during a given year is represented by<br />
a vertice in the network relative to that year. The results<br />
are shown in Figure 4. Notice that the number <strong>of</strong> vertices<br />
in the Ca-US network is always greater than the number <strong>of</strong><br />
Frequency<br />
1<br />
0.1<br />
0.01<br />
Ca-US<br />
Linear Regression<br />
0.001<br />
1 10<br />
Degree<br />
100<br />
Figure 3: Degree Distribution for Ca-US Network<br />
(Log-Log Scale)<br />
vertices in the two other networks. In addition, in 1998 the<br />
Br and Fr-Sw-UK curves cross over, reflecting a faster increase<br />
in the number <strong>of</strong> vertices in the Br network between<br />
1996 and 2000. One possible reason is the increased effort<br />
in the assessment <strong>of</strong> the quality <strong>of</strong> the Brazilian programs in<br />
the period, lead by CAPES 9 , a Brazilian Ministry <strong>of</strong> Education’s<br />
agency, which encouraged Brazilian authors to publish<br />
in international venues. The popularization <strong>of</strong> the Web may<br />
also have had an influence in this increase. The cumulative<br />
number <strong>of</strong> edges for the three networks is shown in Figure<br />
5, which shows a close resemblance to Figure 4.<br />
Cumulative Number <strong>of</strong> Vertices<br />
900<br />
800<br />
700<br />
600<br />
500<br />
400<br />
300<br />
200<br />
100<br />
Br<br />
Ca-US<br />
Fr-Sw-UK<br />
0<br />
1994 1996 1998 2000<br />
Time (years)<br />
2002 2004 2006<br />
Figure 4: Cumulative Number <strong>of</strong> Vertices for Br,<br />
Fr-Sw-UK and Ca-US Networks in the Period<br />
Figure 6 plots the number <strong>of</strong> vertices versus the number <strong>of</strong><br />
edges for the three networks. Each point <strong>of</strong> the log-log graph<br />
represents the number <strong>of</strong> edges and vertices at year t. Notice<br />
that the number <strong>of</strong> edges grows faster than the number <strong>of</strong><br />
vertices with time, which shows that the formation <strong>of</strong> new<br />
relations benefits not only from the inclusion <strong>of</strong> new vertices<br />
in the network, but also from the existing structure <strong>of</strong> the<br />
9 http://www.capes.gov.br
Cumulative Number <strong>of</strong> Edges<br />
2500<br />
2000<br />
1500<br />
1000<br />
500<br />
Br<br />
Ca-US<br />
Fr-Sw-UK<br />
0<br />
1994 1996 1998 2000<br />
Time (years)<br />
2002 2004 2006<br />
Figure 5: Cumulative Number <strong>of</strong> Edges for Br, Fr-<br />
Sw-UK and Ca-US Networks in the Period<br />
network, formed by vertices previously inserted. This faster<br />
growth is more evident in the Ca-US network, with inclination<br />
α = 1.84, followed by the Br network, with inclination<br />
α = 1.39, and by the Fr-Sw-UK network, with inclination<br />
α = 1.23. In particular, the densification <strong>of</strong> the networks is<br />
not arbitrary; as the coauthorship evolves over time, they<br />
follow a version <strong>of</strong> the relation e(t) ∼ n(t) α , where e(t) and<br />
n(t) denote the number <strong>of</strong> edges and nodes <strong>of</strong> the graph at<br />
time t and α is the exponent. In this case, α is larger than<br />
1, indicating a deviation from linear growth, which means<br />
that the number <strong>of</strong> relations grows faster than the number<br />
<strong>of</strong> authors [9].<br />
Edges<br />
10000<br />
1000<br />
100<br />
Br<br />
Ca-US<br />
Fr-Sw-UK<br />
10<br />
10 100<br />
Vertices<br />
1000<br />
Figure 6: Evolution <strong>of</strong> Number <strong>of</strong> Edges versus<br />
Number <strong>of</strong> Vertices for the Br (α = 1.39), Ca-US<br />
(α = 1.84) and Fr-Sw-UK (α = 1.23) Networks (Log-<br />
Log Scale)<br />
The relative giant component size for Br, Ca-US and Fr-<br />
Sw-UK networks can be seen in Figure 7. The moderated<br />
growth <strong>of</strong> the Ca-US giant component (81% in 1994 to 96%<br />
in 2006) contrasts with the fast growth <strong>of</strong> the Br and Fr-Sw-<br />
UK giant component in the period. In special, the growth<br />
<strong>of</strong> the giant component in the Br network has been steep<br />
starting from 1999 (28% to 98%). The networks considered<br />
in the evolution study are formed by active faculty members<br />
in the period, which means there are no isolated vertices<br />
in the networks. Furthermore, in our study we chose only<br />
highly-ranked graduate programs, which justifies the giant<br />
component covering almost the whole network.<br />
The Fr-Sw-UK giant component covers only 42% <strong>of</strong> the<br />
network in 2006, which may reflect the fact that its programs<br />
are from different countries, with different languages.<br />
However, a smaller giant component is also evident inside<br />
isolated programs, as shown in Table 3. As stated before,<br />
this may indicate that this event may not be only due to the<br />
diversity <strong>of</strong> countries, but also from an intrinsic characteristic<br />
<strong>of</strong> these programs.<br />
Giant Component Size (Relative Number <strong>of</strong> Vertices)<br />
1<br />
0.8<br />
0.6<br />
0.4<br />
0.2<br />
Br<br />
Ca-US<br />
Fr-Sw-UK<br />
0<br />
1994 1996 1998 2000<br />
Time (years)<br />
2002 2004 2006<br />
Figure 7: Giant Component for Br, Ca-US and Fr-<br />
Sw-UK Cumulative Networks in the Period<br />
The average path length for the three cumulative networks<br />
is show in Figure 8. We observe that the growth <strong>of</strong> the Br<br />
and Fr-Sw-UK path lengths happens during the same period<br />
(1998 to 2002), which coincides with the accelerated<br />
growth <strong>of</strong> the giant component (Figure 7). When the graph<br />
components start to merge together, they are still weakly<br />
connected, and thus the average path length grows. As time<br />
passes, the two groups become more knit together, causing<br />
the reduction <strong>of</strong> the giant component and the average path<br />
length. For example, the Fr-Sw-UK giant component is still<br />
growing, as well as its path length. This is also seen in [5].<br />
Despite the growth <strong>of</strong> the Br and Fr-Sw-UK path lengths, we<br />
see that the curve <strong>of</strong> Ca-US decreases steadily. This phenomenon,<br />
called shrinking diameter, reflects the fact that<br />
the effective shortest path decreases as the network grows,<br />
and has been observed in [9] in a range <strong>of</strong> real networks.<br />
Figure 9 shows the average clustering coefficient over time<br />
for the three cumulative networks. From 1996 to 2006 the<br />
Br clustering coefficient has been continuously reduced (0.59<br />
to 0.26), which may be related to the inclusion <strong>of</strong> new authors<br />
into the network and to the increased collaboration<br />
between authors <strong>of</strong> different communities. The Fr-Sw-UK<br />
clustering coefficient has remained relatively steady over the<br />
period, while the Ca-US clustering coefficient has slightly<br />
reduced. The Fr-Sw-UK network has the highest clustering<br />
coefficient, which reflects its smaller giant component,<br />
meaning that there are isolated communities collaborating<br />
internally with intensity.
Characteristic Path Lenght<br />
8<br />
7<br />
6<br />
5<br />
4<br />
3<br />
2<br />
1<br />
Br<br />
Ca-US<br />
Fr-Sw-UK<br />
0<br />
1994 1996 1998 2000<br />
Time (years)<br />
2002 2004 2006<br />
Figure 8: Characteristic Path Lenght for Br, Ca-US<br />
and Fr-Sw-UK Cumulative Networks in the Period<br />
Clustering Coefficient<br />
1<br />
0.8<br />
0.6<br />
0.4<br />
0.2<br />
Br<br />
Ca-US<br />
Fr-Sw-UK<br />
0<br />
1994 1996 1998 2000<br />
Time (years)<br />
2002 2004 2006<br />
Figure 9: Clustering Coefficient for Br, Ca-US and<br />
Fr-Sw-UK Cumulative Networks in the Period<br />
The average number <strong>of</strong> authors per papers for the three<br />
networks is shown in Figure 10. The increase over time in<br />
the average number <strong>of</strong> authors collaborating on papers indicates<br />
that in recent years researchers tend to participate<br />
in teams <strong>of</strong> increasing size. In [19] the authors observed an<br />
increase in the research team sizes <strong>of</strong> the science and engineering<br />
field, the social sciences field, and the arts and humanities<br />
field. They also observed an increase in the number<br />
<strong>of</strong> inventors per patent during the last decades. A possible<br />
reason is the reduction <strong>of</strong> communication costs with the rise<br />
and growth <strong>of</strong> the Internet.<br />
The Br network had a sudden increase in the average number<br />
<strong>of</strong> authors per paper from 1998 to 1999, which is due<br />
to a shift in the Brazilian governmental policy towards research<br />
support at the time, favoring team financing instead<br />
<strong>of</strong> individual financing. Furthermore, the incresing preasure<br />
to publish more in national and international high-quality<br />
vehicles is likely to have intensified collaboration in Brazil.<br />
5.2 Evolution <strong>of</strong> Computer Science Subfields<br />
In the next step, we studied the evolution <strong>of</strong> Computer<br />
Average Number <strong>of</strong> Authors per Paper<br />
4.5<br />
4<br />
3.5<br />
3<br />
2.5<br />
2<br />
1.5<br />
1<br />
0.5<br />
Br<br />
Ca-US<br />
Fr-Sw-UK<br />
0<br />
1994 1996 1998 2000<br />
Time (years)<br />
2002 2004 2006<br />
Figure 10: Average Number <strong>of</strong> Authors Per Paper<br />
for Br, Ca-US and Fr-Sw-UK Networks for Each<br />
Year<br />
Science subfields over time (see Table 1), observing two wellestablished<br />
subfields, namely, Computer Architecture and<br />
Databases, and two emerging ones, namely, Bioinformatics<br />
and Geoinformatics. Figure 11 displays the evolution in the<br />
number <strong>of</strong> vertices per field over time. All the four subfields<br />
have continuously grown from 1994 until 2006. In special,<br />
Bioinformatics had a great relative growth in the period,<br />
from 147 vertices in 1994 to 1,394 vertices in 2006. Geoinformatics<br />
has also grown (50 to 177 vertices), however, its<br />
reduced proportion makes this difficult to visualize in the<br />
graph. The same is true for the evolution in the number <strong>of</strong><br />
edges for the four subfields, shown in Figure 12. Notice that<br />
Bioinformatics had a fast increase in the number <strong>of</strong> edges<br />
from 1999 onwards, indicating the establishment <strong>of</strong> many<br />
new connections between authors in this period.<br />
Cumulative Number <strong>of</strong> Vertices<br />
6000<br />
5000<br />
4000<br />
3000<br />
2000<br />
1000<br />
Computer Architecture<br />
Databases<br />
Bioinformatics<br />
Geoinformatics<br />
0<br />
1994 1996 1998 2000<br />
Time (years)<br />
2002 2004 2006<br />
Figure 11: Cumulative Number <strong>of</strong> Vertices per Field<br />
in the Period<br />
The clustering coefficient evolution for Computer Architecture,<br />
Databases, Bioinformatics and Geoinformatics is<br />
shown in Figure 13. The clustering coefficient measure reflects<br />
the division between well-established and emerging
Cumulative Number <strong>of</strong> Edges<br />
18000<br />
16000<br />
14000<br />
12000<br />
10000<br />
8000<br />
6000<br />
4000<br />
2000<br />
Computer Architecture<br />
Databases<br />
Bioinformatics<br />
Geoinformatics<br />
0<br />
1994 1996 1998 2000<br />
Time (years)<br />
2002 2004 2006<br />
Figure 12: Cumulative Number <strong>of</strong> Edges per Sub-<br />
Area in the Period<br />
subfields: the Computer Architecture and Databases subfields<br />
show a slight increase in the clustering coefficient measure<br />
with time, while the Bioinformatics and Geoinformatics<br />
subfields have a much faster increase. Moreover, the increase<br />
in the measure indicates a process <strong>of</strong> densification <strong>of</strong><br />
these subfields, in which more edges are being inserted into<br />
their networks. This increase contrasts with the decrease observed<br />
in the clustering coefficient <strong>of</strong> networks which involve<br />
all subfields (see Figure 9).<br />
Clustering Coefficient<br />
1<br />
0.8<br />
0.6<br />
0.4<br />
0.2<br />
Computer Architecture<br />
Databases<br />
Bioinformatics<br />
Geoinformatics<br />
0<br />
1994 1996 1998 2000<br />
Time (years)<br />
2002 2004 2006<br />
Figure 13: Clustering Coefficient per Field in the<br />
Period<br />
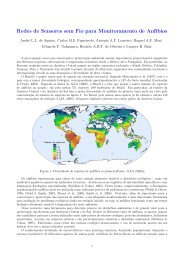
Figure 14 displays the average number <strong>of</strong> subfields in which<br />
each author publishes in a given single year. These values<br />
are not cumulative over time. The graph shows clearly a<br />
trend <strong>of</strong> diversification, i.e., an increase in the number <strong>of</strong><br />
subfields per author over time. Furthermore, in general, the<br />
number <strong>of</strong> subfields per author is larger for the Ca-US network<br />
and smaller for the Br network.<br />
6. MAPPING COMPUTER SCIENCE SUB-<br />
FIELDS<br />
Number <strong>of</strong> Fields per Author<br />
2.8<br />
2.6<br />
2.4<br />
2.2<br />
2<br />
1.8<br />
1.6<br />
1.4<br />
Br<br />
Ca-US<br />
Fr-Sw-UK<br />
1.2<br />
1994 1996 1998 2000<br />
Time (years)<br />
2002 2004 2006<br />
Figure 14: Average Number <strong>of</strong> Fields per Author for<br />
Br, Ca-US and Fr-Sw-UK Networks for Each Year<br />
In the final part <strong>of</strong> our study we analyzed the interrelationship<br />
between Computer Science subfields. If we consider<br />
a subfield as a set <strong>of</strong> authors who publish in it, the proximity<br />
between subfield A and subfield B can be computed as<br />
follows:<br />
PAB = |R X AB|<br />
|RAK| + |R X AB|<br />
K<br />
K<br />
|RBK|<br />
Lets define the union <strong>of</strong> the edges incident to elements<br />
<strong>of</strong> A as I(A). Then, RAB is the intersection between I(A)<br />
and I(B). Intuitively, the first part <strong>of</strong> the addition is the<br />
fraction <strong>of</strong> external relationships <strong>of</strong> A which involves B, and<br />
the second part is the fraction <strong>of</strong> external relationships <strong>of</strong> B<br />
which involves A. We excluded all edges with PAB < 0.08.<br />
We used the algorithm described in [7] and implemented in<br />
Pajek 10 for the generation <strong>of</strong> a graph for visualization <strong>of</strong> the<br />
interrelationships. The vertices represent Computer Science<br />
subfields, edges represent relationships between them, and<br />
the edge weights are computed using the proximity function<br />
between fields, P.<br />
Figure 15 presents the interrelationship among the 30 subfields<br />
considered. The size <strong>of</strong> the vertices is an indication <strong>of</strong><br />
the number <strong>of</strong> authors in the community representing each<br />
subfield. The smallest community is Geoinformatics, with<br />
177 authors, and the largest is Computer Architecture, with<br />
5,239 authors. The distance between vertices denotes the intensity<br />
<strong>of</strong> the inter-relationship among subfields. Notice that<br />
there is a clear division <strong>of</strong> the graph into two sets <strong>of</strong> subfields.<br />
For example, the upper part <strong>of</strong> the figure displays subfields<br />
related to Computer Systems, such as Computer Networks,<br />
Computer Architecture, and Operating Systems. S<strong>of</strong>tware<br />
Engineering and Algorithms and Theory also belong to this<br />
group. In turn, the bottom part <strong>of</strong> the figure shows subfields<br />
which are closely related to Databases, such as Web, Hypermedia<br />
and Multimedia, Information Retrieval, Data Mining,<br />
and Information Systems. It also includes subfields related<br />
to Artificial Intelligence, Computer Graphics and Computer<br />
Vision.<br />
10 Pajek − Program for Large Network <strong>Analysis</strong>.
7. CONCLUSIONS<br />
In this paper, we used collaboration networks to analyze<br />
the scientific production in Computer Science. We formed<br />
networks for 30 Computer Science graduate programs in<br />
three regions and studied their characteristics, using several<br />
metrics. Furthermore, we defined 30 different subfields and<br />
studied the characteristics <strong>of</strong> their collaboration networks.<br />
A temporal study was also performed, using a period <strong>of</strong> 12<br />
years, from 1994 to 2006. Next, we visually studied the<br />
inter-relationship between different Computer Science subfields.<br />
The Ca-US network has shown a much larger number <strong>of</strong><br />
papers per author and <strong>of</strong> collaborators per author. It also<br />
has the lowest clustering coefficient, indicating diversified<br />
collaboration and a low transitivity. The Fr-Sw-UK network<br />
has a small giant component size when compared to<br />
the other two networks, which could be related to the existence<br />
<strong>of</strong> programs from different countries in this network,<br />
but also could be a characteristic intrinsic to the Fr-Sw-UK<br />
programs, as shown in Table 3. The average path length and<br />
diameter in the Ca-US network is smaller, which demonstrates<br />
it is a denser network, since it is also the largest in<br />
number <strong>of</strong> vertices. Furthermore, the degree distribution<br />
suggests a smaller difference from the authors that publish<br />
more to the authors that publish less.<br />
The temporal evolution has shown a rapid increase in the<br />
scientific production <strong>of</strong> Br programs from 1997 until 2000,<br />
which may be due to Brazilian government agencies’ increased<br />
efforts to assess the production <strong>of</strong> the country’s researchers<br />
in the period. In addition, the Br and Fr-Sw-UK<br />
networks have shown a fast increase in the size <strong>of</strong> their giant<br />
component and in the size <strong>of</strong> their average path length from<br />
1998 onwards, especially in the former. The Br network has<br />
Figure 15: Interrelationship Between Fields<br />
also shown a significant reduction in its clustering coefficient<br />
in the period.<br />
An analysis <strong>of</strong> the evolution <strong>of</strong> two well-established Computer<br />
Science subfields (Computer Architecture and Databases)<br />
and two emerging subfields (Bioinformatics and Geoinformatics)<br />
was also performed. The study has shown a significant<br />
increase in the size <strong>of</strong> the Bioinformatics network in<br />
the period. The two emerging subfields have also had an increase<br />
in the clustering coefficient measure, indicating they<br />
are becoming denser in a fast pace.<br />
Finally, we generated a graph for visualization <strong>of</strong> the interrelationships<br />
between subfields, in which vertices represent<br />
subfields, the vertice size represents the size <strong>of</strong> the<br />
subfield in number <strong>of</strong> authors, and the proximity between<br />
vertices represents the intensity <strong>of</strong> the interrelationship between<br />
these vertices. A visual analysis showed a division<br />
<strong>of</strong> Computer Science into separated sets <strong>of</strong> subfields. For<br />
instance, subfields related to Computer Systems, such as<br />
Computer Networks, Computer Architecture, and Operating<br />
Systems, are displayed in a set, while subfields related<br />
to Databases, such as Web, Hypermedia and Multimedia,<br />
Information Retrieval, Data Mining, and Information Systems,<br />
are displayed in another. However, it should be noticed<br />
that this division does not necessarily imply that these<br />
subfields are related to each other, but only that their researchers<br />
are more likely to work together.<br />
8. ACKNOWLEDGEMENTS<br />
This reserach is partially supported by the Brazilian National<br />
Institute <strong>of</strong> Science and Technology for the Web (grant<br />
MCT/CNPq 573871/2008-6), by the InfoWeb project (grant<br />
MCT /CNPq/CT-INFO 550874/2007-0), and by the authors’<br />
individual grants from CNPq.
9. REFERENCES<br />
[1] A. L. Barabasi, H. Jeong, Z. Neda, E. Ravasz,<br />
A. Schubert, and T. Vicsek. Evolution <strong>of</strong> the social<br />
network <strong>of</strong> scientific collaborations. PHYSICA A,<br />
311:3, 2002.<br />
[2] K. Börner, L. Dall’Asta, W. Ke, and A. Vespignani.<br />
Studying the emerging global brain: Analyzing and<br />
visualizing the impact <strong>of</strong> co-authorship teams:<br />
Research articles. Complex., 10(4):57–67, 2005.<br />
[3] D. S. Callaway, J. E. Hopcr<strong>of</strong>t, J. M. Kleinberg,<br />
M. E. J. Newman, and S. H. Strogatz. Are randomly<br />
grown graphs really random? Physical Review E,<br />
64:041902, 2001.<br />
[4] C. Chen, I.-Y. Song, X. Yuan, and J. Zhang. The<br />
thematic and citation landscape <strong>of</strong> data and<br />
knowledge engineering (1985-2007). Data Knowl.<br />
Eng., 67(2):234–259, 2008.<br />
[5] E. Elmacioglu and D. Lee. On six degrees <strong>of</strong><br />
separation in dblp-db and more. SIGMOD Rec.,<br />
34(2):33–40, 2005.<br />
[6] J. Huang, Z. Zhuang, J. Li, and C. L. Giles.<br />
Collaboration over time: characterizing and modeling<br />
network evolution. In WSDM ’08: Proceedings <strong>of</strong> the<br />
international conference on Web search and web data<br />
mining, pages 107–116, New York, NY, USA, 2008.<br />
ACM.<br />
[7] T. Kamada and S. Kawai. An algorithm for drawing<br />
general undirected graphs. Inf. Process. Lett.,<br />
31(1):7–15, 1989.<br />
[8] A. H. F. Laender, C. J. P. Lucena, J. C. Maldonado,<br />
E. Souza e Silva, and N. Ziviani. Assessing the<br />
Research and Education Quality <strong>of</strong> the Top Brazilian<br />
Computer Science Graduate Programs. ACM SIGCSE<br />
Bulletin, 40:135–145, June 2008.<br />
[9] J. Leskovec, J. Kleinberg, and C. Faloutsos. Graphs<br />
over time: densification laws, shrinking diameters and<br />
possible explanations. In Proceedings <strong>of</strong> the eleventh<br />
ACM SIGKDD International Conference on<br />
<strong>Knowledge</strong> Discovery in Data Mining, pages 177–187,<br />
New York, NY, USA, 2005. ACM.<br />
[10] X. Liu, J. Bollen, M. L. Nelson, and H. Van de<br />
Sompel. Co-authorship networks in the digital library<br />
research community. Inf. Process. Manage.,<br />
41(6):1462–1480, December 2005.<br />
[11] S. Milgram. The small world problem. Psychology<br />
Today, 2:60–67, 1967.<br />
[12] M. A. Nascimento, J. Sander, and J. Pound. <strong>Analysis</strong><br />
<strong>of</strong> SIGMOD’s co-authorship graph. SIGMOD Rec.,<br />
32(3):8–10, 2003.<br />
[13] M. E. Newman. The structure <strong>of</strong> scientific<br />
collaboration networks. Proc. Nat’l Acad. Sci. <strong>of</strong> the<br />
United States <strong>of</strong> America, 98(2):404–409, January<br />
2001.<br />
[14] M. E. Newman. Assortative mixing in networks.<br />
Physical Review Letters, 89(20):208701, October 2002.<br />
[15] M. E. Newman. The structure and function <strong>of</strong><br />
complex networks. SIAM Review, 45(2):167–256, 2003.<br />
[16] M. E. Newman. Coauthorship networks and patterns<br />
<strong>of</strong> scientific collaboration. In Proc. Nat’l Acad. Sci. <strong>of</strong><br />
the United States <strong>of</strong> America, pages 5200–5205, 2004.<br />
[17] D. Watts. Networks, dynamics, and the small-world<br />
phenomenon. American Journal <strong>of</strong> Sociology,<br />
105(2):493–527, September 1999.<br />
[18] D. J. Watts and S. H. Strogatz. Collective dynamics <strong>of</strong><br />
”small-world” networks. Nature, 393(6684):440–442,<br />
June 1998.<br />
[19] S. Wuchty, B. F. Jones, and B. Uzzi. The increasing<br />
dominance <strong>of</strong> teams in production <strong>of</strong> knowledge.<br />
Science, 316(5827):1036–1039, May 2007.