chemical composition and assessment of drinking water quality
chemical composition and assessment of drinking water quality
chemical composition and assessment of drinking water quality

Create successful ePaper yourself
Turn your PDF publications into a flip-book with our unique Google optimized e-Paper software.
Proceedings <strong>of</strong> ECOpole<br />
Vol. 3, No. 2 2009<br />
Magnuss VIRCAVS 1<br />
CHEMICAL COMPOSITION AND ASSESSMENT<br />
OF DRINKING WATER QUALITY: LATVIA CASE STUDY<br />
SKŁAD CHEMICZNY I OCENA JAKOŚĆ WODY PITNEJ.<br />
STUDIUM PRZYPADKU: ŁOTWA<br />
Abstract: Assessment <strong>of</strong> <strong>drinking</strong> <strong>water</strong> <strong>quality</strong> in seven largest Latvia <strong>drinking</strong> <strong>water</strong> supply systems (Riga,<br />
Daugavpils, Liepaja, Ventspils, Jelgava, Jurmala, <strong>and</strong> Rezekne) in 2008 using mathematical statistical processing<br />
<strong>of</strong> <strong>chemical</strong> <strong>composition</strong> data is carried out. In all analyzed <strong>drinking</strong> <strong>water</strong> the concentrations <strong>of</strong> Hg, Cd, Pb, Cu,<br />
Ni, Cr (total),<br />
−<br />
BrO 3 <strong>and</strong> trihalomethanes (total) were observed in the level <strong>of</strong> their quantification or less than it or<br />
concentration changes were observed only in some cases that are significantly less than their maximum<br />
permissible values (MPV). The processed data show that higher concentrations <strong>of</strong> sulphate in Jelgava <strong>and</strong> Jurmala<br />
<strong>drinking</strong> <strong>water</strong> were observed. In Jelgava <strong>drinking</strong> <strong>water</strong> sulphate concentration exceed the accepted MPV for<br />
97 mg/dm 3 <strong>and</strong> in Jurmala - for 26 mg/dm 3 . Besides, high values <strong>of</strong> total iron (1.15±0.54 mg/dm 3 ) <strong>and</strong> turbidity<br />
(14.2±7.2 nephelometric turbidity units) were obtained also in Jelgava <strong>drinking</strong> <strong>water</strong>. Relative high concentration<br />
<strong>of</strong> aluminium in Liepaja <strong>drinking</strong> <strong>water</strong> (0.2 mg/dm 3 ) takes place that achieves the MPV. Confidence intervals <strong>of</strong><br />
mean values were calculated using Chebyshev's ine<strong>quality</strong>. The processed data testify well even very well <strong>quality</strong><br />
<strong>of</strong> the analyzed largest Latvia <strong>drinking</strong> <strong>water</strong> supply systems.<br />
Keywords: <strong>drinking</strong> <strong>water</strong> <strong>quality</strong>, <strong>chemical</strong> <strong>composition</strong>, mathematical statistics, Latvia<br />
Introduction<br />
Provision <strong>of</strong> a qualitative <strong>drinking</strong> <strong>water</strong> is an important precondition for improvement<br />
<strong>of</strong> the life <strong>quality</strong>. Drinking <strong>water</strong> <strong>quality</strong> directly affects human health. The impacts reflect<br />
the level <strong>of</strong> contamination <strong>of</strong> whole <strong>drinking</strong> <strong>water</strong> supply system (raw <strong>water</strong>, treatment<br />
facilities <strong>and</strong> distribution network to consumers). The primary goals <strong>of</strong> environmental<br />
especially <strong>drinking</strong> <strong>water</strong> management are to provide safe <strong>drinking</strong> <strong>water</strong> supply in<br />
international <strong>and</strong> national scale. The international organizations, eg World Health<br />
Organization (WHO) have major functions to propose regulations, guidelines, <strong>and</strong><br />
recommendations in order to realize human right to have access to an adequate <strong>of</strong> safe<br />
<strong>drinking</strong> <strong>water</strong> independently <strong>of</strong> their stage <strong>of</strong> development <strong>and</strong> their social <strong>and</strong> economic<br />
conditions.<br />
Latvia has rich <strong>water</strong> resources, especially fresh<strong>water</strong>, which well exceeds current <strong>and</strong><br />
planned consumption. In general <strong>chemical</strong> structure <strong>of</strong> raw <strong>water</strong> resources ensure to meet<br />
adequacy requirements <strong>of</strong> <strong>drinking</strong> <strong>water</strong> <strong>quality</strong> determined by Council Directive<br />
98/83/EC <strong>of</strong> 3 November 1998 on the <strong>quality</strong> <strong>of</strong> <strong>water</strong> intended for human consumption<br />
<strong>and</strong> Republic <strong>of</strong> Latvia Cabinet Regulation No. 235 “M<strong>and</strong>atory harmlessness <strong>and</strong> <strong>quality</strong><br />
requirements for <strong>drinking</strong> <strong>water</strong>, <strong>and</strong> the procedures for monitoring <strong>and</strong> control there<strong>of</strong>”<br />
(adopted 29 April 2003).<br />
Management <strong>of</strong> <strong>drinking</strong> <strong>water</strong> <strong>quality</strong> is a matter <strong>of</strong> great importance in Latvia.<br />
Implementation <strong>of</strong> the State Investment Program 800+, <strong>drinking</strong> <strong>water</strong> regular <strong>and</strong> audit<br />
monitoring as well as other environmental projects are integral part <strong>of</strong> public health <strong>and</strong><br />
environmental protection.<br />
1 Faculty <strong>of</strong> Geography & Earth Sciences, University <strong>of</strong> Latvia, Alberta str. 10, Rīga, LV-1010, Latvia
268<br />
Magnuss Vircavs<br />
The present study is devoted to <strong>assessment</strong> <strong>of</strong> <strong>drinking</strong> <strong>water</strong> <strong>quality</strong> in seven largest<br />
Latvia <strong>drinking</strong> <strong>water</strong> supply systems in 2008 using mathematical statistical processing <strong>of</strong><br />
<strong>chemical</strong> <strong>composition</strong> data.<br />
Materials <strong>and</strong> methods<br />
Quality <strong>assessment</strong> <strong>of</strong> Latvia <strong>drinking</strong> <strong>water</strong> is carried out using <strong>chemical</strong> <strong>composition</strong><br />
data <strong>of</strong> <strong>drinking</strong> <strong>water</strong> obtained from the Public Health Agency <strong>of</strong> the Ministry <strong>of</strong> Health.<br />
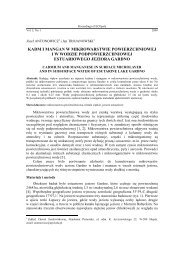
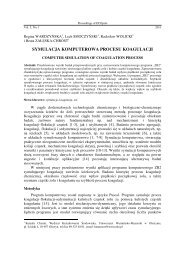
Drinking <strong>water</strong> was analyzed in 2008 in seven largest Latvia <strong>drinking</strong> <strong>water</strong> systems - Riga,<br />
Daugavpils, Liepaja, Ventspils, Jelgava, Jurmala, <strong>and</strong> Rezekne (Fig. 1).<br />
Fig. 1. Latvia administrative map. The largest <strong>drinking</strong> <strong>water</strong> systems: Riga, Daugavpils, Liepaja, Ventspils,<br />
Jelgava, Jurmala, <strong>and</strong> Rezekne<br />
Drinking <strong>water</strong> was sampled from the site <strong>of</strong> consumers <strong>and</strong> analyses were carried out<br />
considering the requirements (testing methods, sampling frequency, the necessary precision<br />
<strong>and</strong> accuracy, maximum permissible values (MPV) <strong>of</strong> the variables) in Republic <strong>of</strong> Latvia<br />
Cabinet Regulations No. 235 “M<strong>and</strong>atory harmlessness <strong>and</strong> <strong>quality</strong> requirements for<br />
<strong>drinking</strong> <strong>water</strong>, <strong>and</strong> the procedures for monitoring <strong>and</strong> control there<strong>of</strong>” (adopted 29 April<br />
2003) <strong>and</strong> in Cabinet Regulations No. 118 adopted on March 12, 2002 “Regulations<br />
regarding the Quality <strong>of</strong> Surface Waters <strong>and</strong> Ground<strong>water</strong>s” (with amendments). Drinking<br />
<strong>water</strong> <strong>quality</strong> was evaluated by the following variables: color, turbidity, pH, conductivity,<br />
aluminium, iron (total), fluorides, sulphates, ammonium, nitrates(V), nitrites(III), mercury,<br />
cadmium, lead, copper, nickel, chromium, bromates, trihalomethanes (total).<br />
Data processing <strong>of</strong> <strong>drinking</strong> <strong>water</strong> <strong>chemical</strong> <strong>composition</strong> includes mathematical<br />
statistical calculations. The Q-test was applied for suitability estimation <strong>of</strong> <strong>drinking</strong> <strong>water</strong><br />
data set. The mean <strong>and</strong> the confidence interval <strong>of</strong> <strong>chemical</strong> <strong>composition</strong> variables <strong>of</strong><br />
<strong>drinking</strong> <strong>water</strong> was expressed using Chebyshev’s ine<strong>quality</strong> (confidence level α = 0.06):<br />
0 – 4s/ n ≤ µ ≤ 0 + 4s/ n , where µ - mathematical expectation, 0 - mean, <strong>and</strong> s -<br />
st<strong>and</strong>ard deviation, <strong>and</strong> 4s/ n - st<strong>and</strong>ard error <strong>of</strong> mean [1]. Rezekne <strong>drinking</strong> <strong>water</strong> supply
Chemical <strong>composition</strong> <strong>and</strong> <strong>assessment</strong> <strong>of</strong> <strong>drinking</strong> <strong>water</strong> <strong>quality</strong>: Latvia case study<br />
system was characterized only by two measurements <strong>of</strong> the variables. Availability <strong>of</strong> the<br />
data for further their processing was evaluated using also Chebyshev's ine<strong>quality</strong>: |x1 – x2| <<br />
4s (where x1 <strong>and</strong> x2 - results <strong>of</strong> measurements). It was used for estimation <strong>of</strong> Al, Fe, F – , pH,<br />
turbidity, <strong>and</strong> conductivity values. Assessment <strong>of</strong> differences between sample means was<br />
carried out using Bartlett’s test criterion.<br />
Characteristic <strong>of</strong> Latvia <strong>drinking</strong> <strong>water</strong> supply<br />
Latvia has rich <strong>water</strong> resources, especially fresh<strong>water</strong>, which well exceeds current <strong>and</strong><br />
planned consumption. Water resources allow providing high <strong>quality</strong> <strong>drinking</strong> <strong>water</strong> for all<br />
population - 70% is composed from artesian <strong>and</strong> 30% from surface <strong>water</strong> sources (rivers<br />
<strong>and</strong> lakes). Total amount <strong>of</strong> surface <strong>water</strong>s comprises 13,300 m 3 per capita but in European<br />
Union (EU) it comprises at an average 7,250 m 3 per capita [2]. In most <strong>water</strong> supply<br />
systems hydrogen-carbonate calcium <strong>water</strong> with mineralization 0.3÷0.4 g/dm 3 is used.<br />
Chemical structure <strong>of</strong> rock <strong>and</strong> infiltration <strong>water</strong> is caused by hydrogen-carbonate calcium<br />
<strong>water</strong>.<br />
Mostly artesian <strong>water</strong>s are used for the centralized <strong>water</strong> supply in Latvia towns. They<br />
are better protected than ground<strong>water</strong> table. Drinking <strong>water</strong> sources for the capital <strong>of</strong> Latvia<br />
Riga comprise a mixture <strong>of</strong> surface, natural ground<strong>water</strong>, <strong>and</strong> artificially recharged<br />
ground<strong>water</strong> from Lake Mazais Baltezers that is the main source for artificial recharge plant<br />
supplying up to 25% <strong>of</strong> Riga <strong>drinking</strong> <strong>water</strong> [3]. Reservoir <strong>of</strong> Riga hydro-power plant on<br />
the Daugava River is used as a surface <strong>water</strong> source. The Daugava Waterworks is the<br />
largest surface <strong>water</strong> treatment plant in Latvia that purifies more than 100 000 m 3 per day<br />
using alum as a coagulant [4]. However, <strong>quality</strong> <strong>of</strong> <strong>water</strong> taken from the reservoir <strong>of</strong> Riga<br />
hydro-power plant depends on transboundary pollution that enters into the Daugava River<br />
from Russia <strong>and</strong> Belarus. In the period from 1990 to 2007 three large accidents happened in<br />
the river Daugava basin. In November 1990 during filling a railroad tank in a <strong>chemical</strong><br />
plant “Polimir”, Novopolock (Belarus) spill <strong>of</strong> acetone cyanohydrin (ACH operates on<br />
respiratory centers) occurred. Significant amount <strong>of</strong> ACH leaked into the Daugava River.<br />
Due to the pollution mass fish deaths were observed in the river. Therefore during one<br />
week <strong>water</strong> supply from the Daugava River was interrupted in Riga. The second accident<br />
involved sanitation leakage from Belarus in the middle <strong>of</strong> 1990s. The last accident,<br />
disruption <strong>of</strong> oil pipe line Unecha - Ventspils (enterprise „Zapad-Transnefteprodukt”,<br />
Russia), caused the Daugava River ecosystem contamination with diesel fuel that happened<br />
23 March 2007. Diesel fuel <strong>of</strong> 4,171 Mg entered into the territory <strong>of</strong> Latvia, but ~ 90% was<br />
collected from the Daugava River <strong>water</strong>s. The noted accidents can originate <strong>and</strong> affect Riga<br />
<strong>drinking</strong> <strong>water</strong> <strong>quality</strong> [5].<br />
Statistical description <strong>of</strong> <strong>drinking</strong> <strong>water</strong> <strong>chemical</strong> <strong>composition</strong><br />
The analyzed <strong>drinking</strong> <strong>water</strong> data <strong>of</strong> seven largest Latvia <strong>drinking</strong> <strong>water</strong> supply<br />
systems are conditionally divided into two groups. The first group involves the variables<br />
whose values do not change. They are the concentrations <strong>of</strong> Hg, Cd, Pb, Cu, Ni, Cr (total),<br />
−<br />
3<br />
BrO <strong>and</strong> trihalomethanes (total). These variables were observed in the level <strong>of</strong> their<br />
determination or less than it or concentration changes were observed only in some cases.<br />
The lowest observed concentrations are the following (in µg/dm 3 ): Hg - 0.1, Cd - 0.5, Pb -<br />
269
270<br />
1.0, Cu - 0.2, Ni - 2.0, Cr (total) - 1.0,<br />
Magnuss Vircavs<br />
−<br />
BrO 3 - 1.0, <strong>and</strong> trihalomethanes (total) - 10.0.<br />
Besides, the exceptions comprised total Cr concentration in Daugavpils <strong>drinking</strong> <strong>water</strong> -<br />
20.0 µg/dm 3 <strong>and</strong> Ni concentration in Jelgava <strong>drinking</strong> <strong>water</strong> - 5.4 µg/dm 3 (1 measurement).<br />
Total concentrations <strong>of</strong> trihalomethanes <strong>of</strong> Riga <strong>drinking</strong> <strong>water</strong> varied in the wide range <strong>of</strong><br />
0.1÷50.1 µg/dm 3 (mean <strong>and</strong> st<strong>and</strong>ard error <strong>of</strong> mean 23.8±0.35 µg/dm 3 ). The same statistics<br />
for total concentrations <strong>of</strong> trihalomethanes <strong>of</strong> Liepaja <strong>drinking</strong> <strong>water</strong> are the following:<br />
range <strong>of</strong> 0.10÷1.14 µg/dm 3 , mean <strong>and</strong> st<strong>and</strong>ard error <strong>of</strong> mean - 0.54±0.21 µg/dm 3 . All noted<br />
concentrations are less than their MPV. Drinking <strong>water</strong> color modified in the range <strong>of</strong><br />
5÷10 units <strong>of</strong> Pt/Co scale with the exception <strong>of</strong> 20 units <strong>of</strong> Pt/Co scale in Daugavpils <strong>and</strong><br />
Jurmala <strong>drinking</strong> <strong>water</strong> (1 measurement).<br />
pH units<br />
8<br />
7,8<br />
7,6<br />
7,4<br />
7,2<br />
7<br />
6,8<br />
Riga<br />
Daugavpils<br />
Average pH values<br />
Ventspils<br />
Jurmala<br />
Jelgava<br />
Drinking <strong>water</strong> systems<br />
Value; sulphates, mg/l;<br />
conductivity, µS/cm<br />
Rezekne<br />
pH<br />
16<br />
14<br />
12<br />
10<br />
8<br />
6<br />
4<br />
2<br />
0<br />
Riga<br />
Average values <strong>of</strong> turbidity<br />
Daugavpils<br />
Average values <strong>of</strong> sulphate<br />
concentrations <strong>and</strong> conductivity<br />
1400<br />
1200<br />
1000<br />
800<br />
600<br />
400<br />
200<br />
0<br />
Riga<br />
Daugavpils<br />
Fig. 2. Average values <strong>of</strong> Al, NH , Fe (total), F – ,<br />
+<br />
4<br />
Latvia <strong>drinking</strong> <strong>water</strong> systems<br />
Liepaja<br />
Ventspils<br />
Nephelometric turbidity units<br />
Jurmala<br />
Jelgava<br />
Rezekne<br />
Drinking <strong>water</strong> systems<br />
−<br />
NO 3 ,<br />
2−<br />
4<br />
Liepaja<br />
Ventspils<br />
Jurmala<br />
Jelgava<br />
Drinking <strong>water</strong> systems<br />
Sulphates<br />
Conductivity<br />
Rezekne<br />
Series1<br />
SO , conductivity, turbidity, <strong>and</strong> pH in the largest
Chemical <strong>composition</strong> <strong>and</strong> <strong>assessment</strong> <strong>of</strong> <strong>drinking</strong> <strong>water</strong> <strong>quality</strong>: Latvia case study<br />
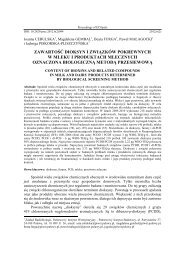
The second group includes the variables whose value changes were observed -<br />
turbidity, pH, <strong>and</strong> conductivity, concentrations <strong>of</strong> Al, Fe (total), F – 2−<br />
, SO ,<br />
4<br />
+<br />
NH 4 ,<br />
271<br />
−<br />
NO 3 <strong>and</strong><br />
−<br />
2<br />
NO . The obtained data <strong>of</strong> processing are summarized in Figure 2. Data set distribution<br />
character was estimated only for Riga <strong>drinking</strong> <strong>water</strong> variables (sample size n = 18) <strong>and</strong> its<br />
inadequacy to normal distribution was obtained. Therefore Chebyshev's ine<strong>quality</strong> was<br />
applied to calculate confidence intervals <strong>of</strong> variable means because Chebyshev's theorem<br />
could be used to r<strong>and</strong>om variables <strong>of</strong> any distribution.<br />
Comparison <strong>of</strong> variable mean <strong>and</strong> median shows that these statistics are not equal for<br />
all variables. Median is a statistic that is sensitive to data set symmetric or asymmetric<br />
distribution. Data symmetric distribution is observed if the mean <strong>and</strong> median are equal but<br />
in the opposite case - asymmetric distribution. Considering the diversity <strong>of</strong> sample sizes<br />
from n = 2 to n = 18 evaluation <strong>of</strong> data distribution character was not carried out.<br />
Comparison <strong>of</strong> differences between sample means at confidence level α = 0.05 using<br />
Bartlett’s test criterion testifies on the following assurance.<br />
In all analyzed <strong>drinking</strong> <strong>water</strong> systems nitrate(III) <strong>and</strong> fluoride concentrations do not<br />
significantly differ. Mean concentration <strong>of</strong> aluminium in Liepaja <strong>drinking</strong> <strong>water</strong> system<br />
(0.2 mg/dm 3 ) significantly differs from its concentration in other <strong>drinking</strong> <strong>water</strong> systems<br />
that have statistically equal value 0.02 mg/dm 3 . Concentration <strong>of</strong> aluminium in Liepaja<br />
<strong>drinking</strong> <strong>water</strong> is equal with MPV.<br />
Total iron concentration (1.15±0.54 mg/dm 3 ) in Jelgava <strong>drinking</strong> <strong>water</strong> system<br />
significantly differs from total iron concentration <strong>of</strong> other systems but it exceed the MPV.<br />
High iron concentration is an important problem <strong>of</strong> <strong>drinking</strong> <strong>water</strong> <strong>quality</strong> in Latvia that is<br />
caused by high content <strong>of</strong> iron in ground<strong>water</strong> tables. Therefore <strong>drinking</strong> <strong>water</strong> de-ironing<br />
is included in Latvia <strong>drinking</strong> <strong>water</strong> processing.<br />
In Riga <strong>drinking</strong> <strong>water</strong> nitrate concentration has a wide dispersion that is specified by<br />
high st<strong>and</strong>ard deviation (±1.6 mg/dm 3 ). Mean concentration <strong>of</strong> nitrate (1.9 mg/dm 3 ) is<br />
significantly higher than in other <strong>drinking</strong> <strong>water</strong> systems that are in the range from 0.013 to<br />
1.1 mg/dm 3 .<br />
Sulphate concentrations in Jelgava (347±41 mg/dm 3 ) <strong>and</strong> Jurmala (276±32 mg/dm 3 )<br />
<strong>drinking</strong> <strong>water</strong> systems are significantly higher than in <strong>drinking</strong> <strong>water</strong> <strong>of</strong> Riga, Daugavpils,<br />
Liepaja, Ventspils, <strong>and</strong> Rezekne. Leakage from gypsum formations causes high sulphate<br />
concentrations in the noted <strong>drinking</strong> <strong>water</strong> systems. Comparison <strong>of</strong> sulphate concentrations<br />
with the MPV shows that in Jelgava <strong>drinking</strong> <strong>water</strong> average linear deviation is 97 mg/dm 3<br />
<strong>and</strong> in Jurmala - 26 mg/dm 3 .<br />
In all <strong>drinking</strong> <strong>water</strong> systems conductivity mean values have a great dispersion with<br />
significantly high values <strong>of</strong> 1189±315 <strong>and</strong> 944±172 µS/cm in <strong>drinking</strong> <strong>water</strong> <strong>of</strong> Jelgava <strong>and</strong><br />
Jurmala. It could be explained by high concentrations <strong>of</strong> sulphates.<br />
Signinficantly high value <strong>of</strong> turbidity (14.2±7.4 nephelometric turbidity units, NTV)<br />
was observed in Jelgava <strong>drinking</strong> <strong>water</strong>. The Regulations No. 235 testifies turbidity values<br />
as acceptable to consumers <strong>and</strong> no substantial changes. In the case <strong>of</strong> surface <strong>water</strong><br />
treatment, it should be striven to reach that turbidity caused by treatment plants does not<br />
exceed 1.0 (NTV).<br />
Mean <strong>of</strong> <strong>drinking</strong> <strong>water</strong> pH falls in the range from 7.16 (Jurmala) to 7.88 (Daugavpils).<br />
pH <strong>of</strong> Riga <strong>and</strong> Jurmala <strong>drinking</strong> <strong>water</strong> significantly differs from pH <strong>of</strong> Daugavpils,<br />
Ventspils, Rezekne, <strong>and</strong> Jelgava <strong>drinking</strong> <strong>water</strong> owing their data great dispersion. Mean
272<br />
Magnuss Vircavs<br />
values pH st<strong>and</strong>s in the pH range 6.5÷9.5 that satisfy the requirements <strong>of</strong> the Regulations<br />
No 235.<br />
Conclusions<br />
Assessment <strong>of</strong> <strong>chemical</strong> <strong>composition</strong> <strong>of</strong> the analyzed seven largest <strong>drinking</strong> <strong>water</strong><br />
systems shows that <strong>drinking</strong> <strong>water</strong> <strong>quality</strong> satisfies to the harmlessness <strong>and</strong> <strong>quality</strong><br />
requirements testified in the Regulations No. 235 with exception <strong>of</strong> higher concentrations<br />
<strong>of</strong> sulphate than the MPV in Jelgava <strong>and</strong> Jurmala <strong>drinking</strong> <strong>water</strong> as well as high values <strong>of</strong><br />
turbidity <strong>and</strong> total iron in Jelgava <strong>drinking</strong> <strong>water</strong>. In all analyzed <strong>drinking</strong> <strong>water</strong> systems<br />
content <strong>of</strong> Hg, Cd, Pb, Cu, Ni, Cr (total),<br />
−<br />
BrO 3 <strong>and</strong> trihalomethanes (total) are in the level<br />
<strong>of</strong> their determination or less than it or some concentration changes were observed only in<br />
some cases that are significantly less than their MPV.<br />
References<br />
[1] Freund J.E.: Introduction to probability. Dickenson Publishing Company, Inc., Encino - Belmont 1973.<br />
[2] Juhna T.: Atdzelžošanas principi un to pielietojums dzeramā ūdens sagatavošanai. Baltic Environment<br />
Forum, Latvia 2007 (Principles <strong>of</strong> de-ironing <strong>and</strong> their use for <strong>drinking</strong> <strong>water</strong> processing; in Latvian).<br />
[3] Springe G. <strong>and</strong> Juhna T.: Water Supply <strong>and</strong> Sanitation in Riga: Development, Present, <strong>and</strong> Future, 401-410.<br />
[In:] Environmental History <strong>of</strong> Water: Global Views on Community Water Supply <strong>and</strong> Sanitation,<br />
eds. P.S. Juuti, T.S. Katko, H.S. Vuorinen, 2007, 640 pp.<br />
[4] Juhna T. <strong>and</strong> Klavins M.: Water-Quality Changes in Latvia <strong>and</strong> Riga 1980-2000: Possibilities <strong>and</strong><br />
Problems. Ambio, 2001, 30(4-5), 306-314.<br />
[5] Vircavs M.: Development <strong>of</strong> environmental management system in Latvia <strong>and</strong> threats <strong>of</strong> environmental<br />
terrorism. Ecol. Chem. Eng. S, 2009, 16(1), 51-61.<br />
SKŁAD CHEMICZNY I OCENA JAKOŚĆ WODY PITNEJ.<br />
STUDIUM PRZYPADKU: ŁOTWA<br />
Abstrakt: W 2008 r. wykonano statystyczną ocenę jakości wody pitnej pobranej z siedmiu największych<br />
systemów wodociągowych Łotwy (Ryga, Daugavpils, Liepaja, Ventspils, Jelgava, Jurmala i Rezekne) na<br />
podstawie ich składu chemicznego. We wszystkich analizowanych wodach pitnych stęŜenia Hg, Cd, Pb, Cu, Ni,<br />
−<br />
Cr (stęŜenie całkowite), BrO 3 i trihalogenometanów (stęŜenie całkowite) były na granicy oznaczalności lub<br />
poniŜej. Tylko w niektórych przypadkach obserwowano zmiany stęŜeń, ale były one znacznie mniejsze od<br />
dopuszczalnej wartości maksymalnej (MPV). Na podstawie analizy danych stwierdzono zwiększone stęŜenie<br />
siarczanów w wodzie pitnej z Jelgavy i Jurmaly. W wodzie pitnej Jelgavy stęŜenie siarczanów przekraczało<br />
maksymalne wartości dopuszczalne (MPV) o 97 mg/dm 3 , a w Jurmale - 26 mg/dm 3 . W wodzie pitnej z Jelgavy<br />
stwierdzono teŜ duŜe całkowite stęŜenie Ŝelaza (1,15 ± 0,54 mg/dm 3 ) i znaczne zmętnienie (14,2 ± 7,2 NTU).<br />
Stwierdzono stosunkowo duŜe stęŜenie glinu w wodzie pitnej z rzeki Liepaja (0,2 mg/dm 3 ), sięgające MPV.<br />
Przedziały ufności wartości średniej zostały obliczone z wykorzystaniem nierówności Czebyszewa. Analizowane<br />
dane świadczą o bardzo dobrej jakości wody pitnej z badanych sieci wodociągowych Łotwy.<br />
Słowa kluczowe: jakości wody pitnej, skład chemiczny, statystyka matematyczna, Łotwa