Determination of salinity changes in building materials using electric ...
Determination of salinity changes in building materials using electric ...
Determination of salinity changes in building materials using electric ...

You also want an ePaper? Increase the reach of your titles
YUMPU automatically turns print PDFs into web optimized ePapers that Google loves.
Proceed<strong>in</strong>gs <strong>of</strong> ECOpole<br />
Vol. 5, No. 1 2011<br />
Zbigniew SUCHORAB 1 and Marc<strong>in</strong> WIDOMSKI 1<br />
DETERMINATION OF SALINITY CHANGES IN BUILDING<br />
MATERIALS USING ELECTRIC METHODS<br />
POMIARY ZMIAN ZASOLENIA W MATERIAŁACH BUDOWLANYCH<br />
ZA POMOCĄ METOD ELEKTRYCZNYCH<br />
Abstract: Build<strong>in</strong>g <strong>materials</strong> <strong>sal<strong>in</strong>ity</strong> is an important exploitation problem <strong>of</strong> many objects, especially those which<br />
are built without obey<strong>in</strong>g the essential rules connected with perform<strong>in</strong>g <strong>of</strong> waterpro<strong>of</strong> <strong>in</strong>sulation. Porous structure<br />
<strong>of</strong> build<strong>in</strong>g <strong>materials</strong> which form the build<strong>in</strong>g barriers is the cause <strong>of</strong> water capillary rise and thus the movement<br />
<strong>of</strong> salt ions which are the reason extensive barriers destruction. In high concentrations the salt ions crystallize<br />
<strong>in</strong>side the pores <strong>of</strong> build<strong>in</strong>g <strong>materials</strong> and are the reason <strong>of</strong> their destruction. It is especially visible <strong>in</strong> the form <strong>of</strong><br />
dropp<strong>in</strong>g external layers from the walls - plasters, which are ma<strong>in</strong>ly vulnerable on the <strong>sal<strong>in</strong>ity</strong> phenomenon.<br />
Simulations and measurements <strong>of</strong> <strong>sal<strong>in</strong>ity</strong> change processes <strong>in</strong> build<strong>in</strong>g <strong>materials</strong> give the possibility to evaluate<br />
the threat and may help to choose the suitable renovation method. The paper presents measurements <strong>of</strong> water<br />
desorption <strong>in</strong> aerated concrete sample and also the simultaneous process <strong>of</strong> <strong>sal<strong>in</strong>ity</strong> change <strong>in</strong> particular layers <strong>of</strong><br />
the material. The measurements <strong>of</strong> the above mentioned processes are done us<strong>in</strong>g TDR probes (Time Doma<strong>in</strong><br />
Reflectometry) which enable constant monitor<strong>in</strong>g <strong>of</strong> water flow and thus <strong>sal<strong>in</strong>ity</strong> <strong>changes</strong>.<br />
Keywords: <strong>sal<strong>in</strong>ity</strong>, monitor<strong>in</strong>g, resistance, capillary rise<br />
Many build<strong>in</strong>g objects both historical and currently built suffer the problem <strong>of</strong><br />
excessive moisture which is ma<strong>in</strong>ly caused by their porous structure [1, 2] and the strong<br />
capillary parameters. In 2010 year the problem <strong>of</strong> water presence <strong>in</strong> build<strong>in</strong>g barriers<br />
became even more important because <strong>of</strong> the strong <strong>in</strong>undations which were noticed <strong>in</strong> the<br />
very extensive range <strong>of</strong> Poland and Central Europe. The problem which is directly<br />
connected with water presence <strong>in</strong>side the build<strong>in</strong>g <strong>materials</strong> structure is <strong>sal<strong>in</strong>ity</strong>. This is<br />
caused by the fact, that water is a great salts solvent which are <strong>of</strong>ten capillary risen from the<br />
soil or from the ra<strong>in</strong> waters (acid ra<strong>in</strong>s). Sal<strong>in</strong>ity is the problem which leads to the build<strong>in</strong>g<br />
material structure and particularly to the external plasters demolition. This is ma<strong>in</strong>ly caused<br />
by the gradual ions concentration which leads to the <strong>in</strong>ternal crystallization and then<br />
material destruction. As it was mentioned before the problem is the most important <strong>in</strong><br />
external layers, where the rate <strong>of</strong> water evaporation is the highest and the crystallization<br />
phenomenon the biggest. These salt crystals <strong>in</strong>crease their volume and may destroy the air<br />
gaps and then decrease material’s strength and <strong>in</strong>sulation parameters.<br />
In case <strong>of</strong> many old build<strong>in</strong>gs it is even visible several years after the renovation<br />
processes, where the destruction and plasters demolition occurs. Sal<strong>in</strong>ity presence can be<br />
also noticed <strong>in</strong> the form <strong>of</strong> splashes <strong>in</strong> the external parts <strong>of</strong> red brick masonries.<br />
The problem <strong>of</strong> extensive <strong>sal<strong>in</strong>ity</strong> presence <strong>in</strong> build<strong>in</strong>g barriers and <strong>materials</strong> is<br />
presented <strong>in</strong> the follow<strong>in</strong>g papers [3-5].<br />
All above mentioned problems are the reason to run <strong>in</strong>vestigations which may help to<br />
detect and predict the water and <strong>sal<strong>in</strong>ity</strong> presence <strong>in</strong> build<strong>in</strong>g barriers and <strong>materials</strong>.<br />
Methods which may be used for the above-mentioned tasks are the model<strong>in</strong>g and<br />
monitor<strong>in</strong>g.<br />
1 Faculty <strong>of</strong> Environmental Eng<strong>in</strong>eer<strong>in</strong>g, Lubl<strong>in</strong> University <strong>of</strong> Technology, ul. Nadbystrzycka 40B, 20-618 Lubl<strong>in</strong>,<br />
phone 81 538 43 22, email: Z.Suchorab@wis.pol.lubl<strong>in</strong>.pl, M.Widomski@wis.pol.lubl<strong>in</strong>.pl
122<br />
Zbigniew Suchorab and Marc<strong>in</strong> Widomski<br />
This paper it is an attempt to model and quantitatively determ<strong>in</strong>e the process <strong>of</strong><br />
moisture <strong>changes</strong> <strong>in</strong> a sample <strong>of</strong> aerated concrete. Aerated concrete was applied for our<br />
<strong>in</strong>vestigations because it is one <strong>of</strong> the most popular build<strong>in</strong>g material <strong>in</strong> Polish market [6].<br />
Its structure is representative for any porous build<strong>in</strong>g material. Other <strong>in</strong>terest<strong>in</strong>g parameters<br />
<strong>of</strong> this <strong>materials</strong> have been presented <strong>in</strong> the follow<strong>in</strong>g literature items: [2, 7].<br />
In this paper we present the possibility <strong>of</strong> monitor<strong>in</strong>g <strong>of</strong> water desorption and <strong>sal<strong>in</strong>ity</strong><br />
<strong>changes</strong> <strong>in</strong> the sample <strong>of</strong> aerated concrete us<strong>in</strong>g the standard TDR (Time Doma<strong>in</strong><br />
Reflactometry) equipment.<br />
Materials and methods<br />
The experimental setup used for experiment consisted <strong>of</strong> the follow<strong>in</strong>g elements:<br />
• TDR Soil Multimeter (Easy Test),<br />
• LP/mts TDR probes (Easy Test)<br />
• PC computer controll<strong>in</strong>g the TDR device,<br />
• aerated concrete sample (SOLBET Lubartow), bulk density 700 kg/m 3 .<br />
As a sample we used the block <strong>of</strong> aerated concrete produced by the local manufacturer<br />
SOLBET Lubartow. The sample dimensions were the follow<strong>in</strong>g: 60×240×240 mm. The<br />
sample was <strong>in</strong>itially poured <strong>in</strong>to the 0.5% mass solution <strong>of</strong> KCl (Potassium Chloride).<br />
After 5 days <strong>of</strong> moisturiz<strong>in</strong>g the obta<strong>in</strong>ed volumetric water content was about 27% vol.<br />
(maximum water content is estimated for 30% vol.) what was the <strong>in</strong>itial value for the<br />
desorption experiment. Then the sample was covered with the bitumen layer to isolate it<br />
from the external environment parameters. Only the upper surface rema<strong>in</strong>ed not isolated. In<br />
such a prepared sample a set <strong>of</strong> TDR probes was <strong>in</strong>stalled. For the experiment we used<br />
LP/mts probes by EasyTest, Lubl<strong>in</strong>. LP/mts (Laboratory Probes for moisture, temperature<br />
and <strong>sal<strong>in</strong>ity</strong>) enable constant monitor<strong>in</strong>g <strong>of</strong> moisture and <strong>sal<strong>in</strong>ity</strong>. Moisture determ<strong>in</strong>ation<br />
was done us<strong>in</strong>g the TDR method (the determ<strong>in</strong>ed parameter was time <strong>of</strong> signal propagation<br />
along the sensors [ps] and thus di<strong>electric</strong> permittivity and moisture). To determ<strong>in</strong>e water<br />
content <strong>of</strong> aerated concrete the follow<strong>in</strong>g calibration formula was used, previously<br />
developed by the authors <strong>of</strong> this article [8]:<br />
θ700 = –7.0·10 –4 ε 2 + 3.29·10 –2 ε – 1.05·10 –2<br />
where: θ700 - volumetric water <strong>of</strong> aerated concrete with bulk density 700 kg/m 3 ,<br />
ε - di<strong>electric</strong> permittivity read by the TDR device.<br />
Sal<strong>in</strong>ity was determ<strong>in</strong>ed with <strong>electric</strong>al conductivity sensors which are built <strong>in</strong> the<br />
applied TDR probes and after the suitable calibration can determ<strong>in</strong>e sal<strong>in</strong>e ions<br />
concentration.<br />
Calibration was conducted for each <strong>of</strong> four applied probes with the follow<strong>in</strong>g KCl<br />
solutions: 0.5, 0.3, 0.1% and distilled water.<br />
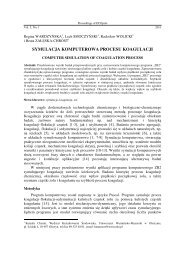
The TDR probes were <strong>in</strong>vasively <strong>in</strong>stalled <strong>in</strong>side the structure <strong>of</strong> the material with the<br />
distance <strong>of</strong> 5 cm between each probe. The position <strong>of</strong> the first probe was 5 cm below the<br />
upper surface <strong>of</strong> the probe. The scheme <strong>of</strong> the experiment presents Figure 1. The<br />
experiment was conducted <strong>in</strong> isothermal conditions - 23°C (±0.5°C) dur<strong>in</strong>g the period <strong>of</strong><br />
30 days (650 hours).
Fig. 1. Experiment setup<br />
Results<br />
<strong>Determ<strong>in</strong>ation</strong> <strong>of</strong> <strong>sal<strong>in</strong>ity</strong> <strong>changes</strong> <strong>in</strong> build<strong>in</strong>g <strong>materials</strong> us<strong>in</strong>g <strong>electric</strong> methods<br />
With the calibration <strong>of</strong> the LP/mts for <strong>sal<strong>in</strong>ity</strong> determ<strong>in</strong>ation the follow<strong>in</strong>g formulas<br />
were obta<strong>in</strong>ed:<br />
where: S - <strong>sal<strong>in</strong>ity</strong> [% mass], U - voltage [mV].<br />
Calibration formulas for <strong>sal<strong>in</strong>ity</strong> determ<strong>in</strong>ation<br />
Probe No. Formula<br />
1 S = 5E -09 U 2 - 3E -06 U + 0.0018<br />
2 S = 6E -09 U 2 - 2E -05 U + 0.0195<br />
3 S = 5E -09 U 2 - 6E -06 U + 0.0063<br />
4 S = 1E -09 U 2 + 3E -05 U – 0.0479<br />
123<br />
Table 1<br />
The process <strong>of</strong> water desorption is presented <strong>in</strong> Figure 2.<br />
From the diagram it is visible that dur<strong>in</strong>g the period <strong>of</strong> 30 days water did not<br />
completely evaporated. The amount <strong>of</strong> water decreased for about 14% vol. - from the <strong>in</strong>itial<br />
26÷27% vol. to about 12% vol. The process progress <strong>in</strong>dicates comparable desorption rate<br />
at each altitude. The differences can be recognized by some displacement <strong>of</strong> all 4 curves.<br />
Assum<strong>in</strong>g that the method accuracy is about 0.5% vol. it is hard to predict if those<br />
displacements are caused by measurement errors or differences <strong>in</strong> process progress. The<br />
reason <strong>of</strong> such a situation may be the <strong>sal<strong>in</strong>ity</strong> ions presence which may reduce the TDR<br />
signal voltage and flatten the signal peaks from which the di<strong>electric</strong> permittivity is<br />
determ<strong>in</strong>ed. It will not <strong>in</strong>fluence the moisture readouts but may decrease the measurement<br />
accuracy.
124<br />
Fig. 2. Desorption process determ<strong>in</strong>ed us<strong>in</strong>g TDR probes<br />
Zbigniew Suchorab and Marc<strong>in</strong> Widomski<br />
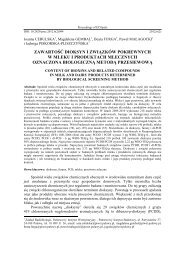
Fig. 3. Sal<strong>in</strong>ity <strong>changes</strong> <strong>in</strong> sample determ<strong>in</strong>ed <strong>in</strong> described experiment
<strong>Determ<strong>in</strong>ation</strong> <strong>of</strong> <strong>sal<strong>in</strong>ity</strong> <strong>changes</strong> <strong>in</strong> build<strong>in</strong>g <strong>materials</strong> us<strong>in</strong>g <strong>electric</strong> methods<br />
The results <strong>of</strong> <strong>sal<strong>in</strong>ity</strong> measurement are presented on Figure 3. The diagram below<br />
presents <strong>sal<strong>in</strong>ity</strong> change at each altitude <strong>of</strong> the sample. The curves symboliz<strong>in</strong>g readouts on<br />
probes 1-4 start at the ord<strong>in</strong>ate axis between 0.09 and 0.13% mass which can be <strong>in</strong>terpreted<br />
as unequal location <strong>of</strong> salt ions <strong>in</strong>side the sample. The experiment <strong>in</strong>dicates cont<strong>in</strong>uous<br />
decrease <strong>of</strong> <strong>sal<strong>in</strong>ity</strong> value on each probe to a f<strong>in</strong>al value 0.1% mass at the end <strong>of</strong> experiment<br />
at each probes.<br />
Laboratory experiment confirmed that ions concentration with<strong>in</strong> the material is<br />
comb<strong>in</strong>ed with moisture. At low states <strong>of</strong> water content the <strong>sal<strong>in</strong>ity</strong> value is also very low<br />
(0.01%) and does not change with moisture <strong>changes</strong> anymore.<br />
Conclusions<br />
• Sal<strong>in</strong>ity presence may <strong>in</strong>fluence the measurement accuracy but does not <strong>in</strong>fluence<br />
moisture value read by the device. Application <strong>of</strong> moisture measurement method us<strong>in</strong>g<br />
capacitance or resistance probes would run to big measurement errors or even make it<br />
impossible to cont<strong>in</strong>ue with the measurements.<br />
• If volumetric water content <strong>of</strong> aerated concrete is below 10% vol. material <strong>sal<strong>in</strong>ity</strong> read<br />
by the described devices is close to zero.<br />
• Time Doma<strong>in</strong> Reflectometry (TDR) method enables constant quantitative monitor<strong>in</strong>g <strong>of</strong><br />
simultaneous processes <strong>of</strong> water and <strong>sal<strong>in</strong>ity</strong> flows.<br />
Acknowledgement<br />
This work was supported by the M<strong>in</strong>istry <strong>of</strong> Science and Higher Education <strong>of</strong> Poland,<br />
No. 4952/B/T02/2008/34.<br />
References<br />
[1] Roels S., Sermijn J. and Carmeliet J.: Modell<strong>in</strong>g unsaturated moisture transport <strong>in</strong> autoclaved aerated<br />
concrete: microstructural approach. Build. Phys. 2002 - 6th Nordic Symp. (Norway 2002), 167-174.<br />
[2] Narayanan N. and Ramamurthy K.: Structure and properties <strong>of</strong> aerated concrete: a review. Cement &<br />
Concrete Composit., 2000, 22, 321-329.<br />
[3] Topp G.C., Davis J.L. and Annan A.P.: Electromagnetic determ<strong>in</strong>ation <strong>of</strong> soil water content: Measurements<br />
<strong>in</strong> coaxial transmission l<strong>in</strong>es. Water Resour. Res., 1980, 16, 574-582.<br />
[4] Suchorab Z., Deneka B., Łagód G. and Sobczuk H.: Możliwość pomiaru zasolenia w materiałach<br />
budowlanych za pomocą metody TDR. Proc. ECOpole, 2009, 3(1), 199-205.<br />
[5] Pavlik Z., Suchorab Z. and Sobczuk H.: Two-rods sensor <strong>in</strong>stallation method and its effect on applicalibity <strong>of</strong><br />
TDR method for moisture and salt concentration measurement. 18th Annual CTU University-Wide Sem<strong>in</strong>ar,<br />
Special Issue, Part A, 13, February 2009, 58-59.<br />
[6] Rokiel M.: Hydroizolacje w budownictwie. Wyd. Medium, Warszawa 2006.<br />
[7] Siejko J. and Babiński Z.: Co to jest beton komórkowy? Budowanie z betonu komórkowego.<br />
Poradnik-Katalog. Stowarzyszenie Producentów Betonów SBPB, 2005, 11-59.<br />
[8] Gaw<strong>in</strong> D., Kosny J. and Desjarlais A.: Effect <strong>of</strong> moisture on thermal performance and energy efficiency <strong>of</strong><br />
build<strong>in</strong>gs with lightweight concrete walls. Proc. Summer Study on Energy Efficiency <strong>in</strong> Build<strong>in</strong>gs Efficiency<br />
& Susta<strong>in</strong>ability, Pacific Grove. California, USA, 2000, 149-160.<br />
[9] Sobczuk H. and Suchorab Z.: Calibration <strong>of</strong> TDR <strong>in</strong>struments for moisture measurement <strong>of</strong> aerated concrete,<br />
Monitor<strong>in</strong>g and Modell<strong>in</strong>g the properties <strong>of</strong> soil as porous medium. Institute <strong>of</strong> Agrophysics Polish Academy<br />
<strong>of</strong> Sciences, Lubl<strong>in</strong> 2005, 158-165.<br />
125
126<br />
Zbigniew Suchorab and Marc<strong>in</strong> Widomski<br />
POMIARY ZMIAN ZASOLENIA W MATERIAŁACH BUDOWLANYCH<br />
ZA POMOCĄ METOD ELEKTRYCZNYCH<br />
Wydział Inżynierii Środowiska, Politechnika Lubelska<br />
Abstrakt: Zasolenie przegród budowlanych jest znaczącym problemem eksploatacyjnym wielu obiektów,<br />
w szczególności tych wzniesionych bez zachowania podstawowych zasad obowiązujących przy wykonywaniu<br />
zabezpieczeń przeciwwilgociowych i przeciwwodnych. Porowata struktura materiałów budowlanych, z których<br />
wzniesiono przegrody, sprzyja zjawisku podciągania kapilarnego wody, wraz z którą przenoszone są jony soli<br />
będące przyczyną przyspieszonego niszczenia przegród. W dużych stężeniach jony soli krystalizują wewnątrz<br />
porów materiałów budowlanych i są przyczyną ich niszczenia. Szczególnie jest to widoczne w postaci<br />
odpadających zewnętrznych powłok przegród budowlanych - tynków, które są najbardziej narażone na zjawisko<br />
zasolenia. Symulacje i pomiary przebiegu procesów zmian zasolenia przegród budowlanych dają możliwość oceny<br />
zagrożenia tym zjawiskiem i mogą być podstawą doboru właściwych zabiegów renowacyjnych. Artykuł<br />
przedstawia pomiary zjawiska desorpcji w modelowej próbce betonu komórkowego i następującą równolegle<br />
zmianę zasolenia w poszczególnych warstwach próbki wskutek powyższego zjawiska. Badania powyżej<br />
wymienionego procesu wykonano z wykorzystaniem sond TDR (Time Doma<strong>in</strong> Reflectometry), które umożliwią<br />
jednoczesny monitor<strong>in</strong>g zjawiska przepływu wody oraz zmian zasolenia.<br />
Słowa kluczowe: zasolenie, monitor<strong>in</strong>g, pomiary rezystancyjne, podciąganie kapilarne