Engineering Application of Exergy Analysis - circe - Universidad de ...
Engineering Application of Exergy Analysis - circe - Universidad de ...
Engineering Application of Exergy Analysis - circe - Universidad de ...

You also want an ePaper? Increase the reach of your titles
YUMPU automatically turns print PDFs into web optimized ePapers that Google loves.
The exergy <strong>of</strong> gas which is recovered in the<br />
gashol<strong>de</strong>r is shown in Fig. 3. In this figure and in<br />
the following ones, two families <strong>of</strong> points are plot:<br />
the absolute value (left axis) and the relative value<br />
(according to 5 or 6) in the right axis. Due to<br />
quality requirements <strong>of</strong> gas to be stored (e. g.<br />
minimum amount <strong>of</strong> CO), gas recovery only takes<br />
place during part <strong>of</strong> the cycle. It should be noted<br />
that the exergy <strong>of</strong> this gas represents between 50<br />
and more than 80% <strong>of</strong> exergy <strong>of</strong> flow 1.<br />
B[10] (kW)<br />
300000<br />
250000<br />
200000<br />
150000<br />
100000<br />
50000<br />
0<br />
B[10] (kW) eta[10] (‐)<br />
0 200 400 600 800 1000 1200<br />
Time (s)<br />
Fig. 3. <strong>Exergy</strong> <strong>of</strong> recovered gas.<br />
B[9] (kW)<br />
250000<br />
200000<br />
150000<br />
100000<br />
50000<br />
0<br />
B[9] (kW) phi_flare (‐)<br />
0 200 400 600 800 1000 1200<br />
Fig. 4. <strong>Exergy</strong> <strong>of</strong> flared gas.<br />
Time (s)<br />
1<br />
0.9<br />
0.8<br />
0.7<br />
0.6<br />
0.5<br />
0.4<br />
0.3<br />
0.2<br />
0.1<br />
0<br />
1.0<br />
0.9<br />
0.8<br />
0.7<br />
0.6<br />
0.5<br />
0.4<br />
0.3<br />
0.2<br />
0.1<br />
0.0<br />
The part <strong>of</strong> the gas which is flared is represented<br />
in Fig. 4. This amount represents more than 50%<br />
<strong>of</strong> flow 1 before the recovery but falls at the end <strong>of</strong><br />
the cycle. This result indicates that it is very<br />
interesting to extend the duration <strong>of</strong> the recovery<br />
as much as possible and to flare gas only when this<br />
is the only possibility.<br />
As explained previously, the system not only<br />
recovers gas, but also produces steam. Figure 5<br />
shows the evolution <strong>of</strong> exergy <strong>of</strong> steam used in<br />
several steel treatments (flow 104). This amounts<br />
eta [10] (‐)<br />
phi_flare (‐)<br />
around 12 MW, which corresponds to less than<br />
10% <strong>of</strong> the exergy <strong>of</strong> converter gas.<br />
B[104] (kW)<br />
14000<br />
12000<br />
10000<br />
8000<br />
6000<br />
4000<br />
2000<br />
0<br />
B[104] (kW) eta[104] (‐)<br />
0 200 400 600 800 1000 1200<br />
Time (s)<br />
Fig. 5. <strong>Exergy</strong> <strong>of</strong> steam to steel treatments.<br />
0.5<br />
0.45<br />
0.4<br />
0.35<br />
0.3<br />
0.25<br />
0.2<br />
0.15<br />
0.1<br />
0.05<br />
0<br />
<strong>Exergy</strong> <strong>of</strong> steam exported to the steam net <strong>of</strong><br />
steelworks is presented in Fig. 6. First, the system<br />
exports 1.5 MW <strong>of</strong> steam, which are progressively<br />
reduced and afterwards more than 2 MW are<br />
imported (negative value). These amounts are less<br />
than 2% <strong>of</strong> the exergy <strong>of</strong> flow 1.<br />
B[135] (kW)<br />
2000<br />
1500<br />
1000<br />
500<br />
0<br />
‐500<br />
‐1000<br />
‐1500<br />
‐2000<br />
‐2500<br />
‐3000<br />
B[135] (kW) eta[135] (‐)<br />
0 200 400 600 800 1000 1200<br />
Time (s)<br />
Fig. 6. <strong>Exergy</strong> <strong>of</strong> steam exchanged with the net.<br />
0.06<br />
0.04<br />
0.02<br />
0<br />
‐0.02<br />
‐0.04<br />
‐0.06<br />
‐0.08<br />
‐0.1<br />
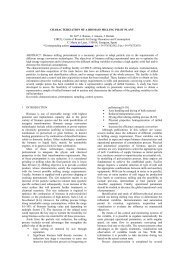
Results presented above have shown the variation<br />
<strong>of</strong> the exergy <strong>of</strong> several flows leaving the system.<br />
However, a key advantage <strong>of</strong> the use <strong>of</strong> exergy is<br />
that it allows one to consi<strong>de</strong>r also losses <strong>of</strong> energy<br />
quality (irreversibilities) taking place insi<strong>de</strong> the<br />
different component.<br />
Figure 7 represents the exergy <strong>de</strong>stroyed in the<br />
combustion process. The low value <strong>of</strong> this variable<br />
(around 2%) can be explained by consi<strong>de</strong>ring two<br />
points. First, only a fraction <strong>of</strong> the CO contained in<br />
the gas is burned (the other part contributes<br />
strongly to the chemical exergy <strong>of</strong> gas which is<br />
either stored or flared, as it can be seen in Fig. 3<br />
http://www.ecos2010.ch 5 14-17th june 2010, Lausanne, Switzerland<br />
eta[104] (‐)<br />
eta[135] (‐)