

2009 Annual Report - ChartNexus
2009 Annual Report - ChartNexus
2009 Annual Report - ChartNexus

Create successful ePaper yourself
Turn your PDF publications into a flip-book with our unique Google optimized e-Paper software.
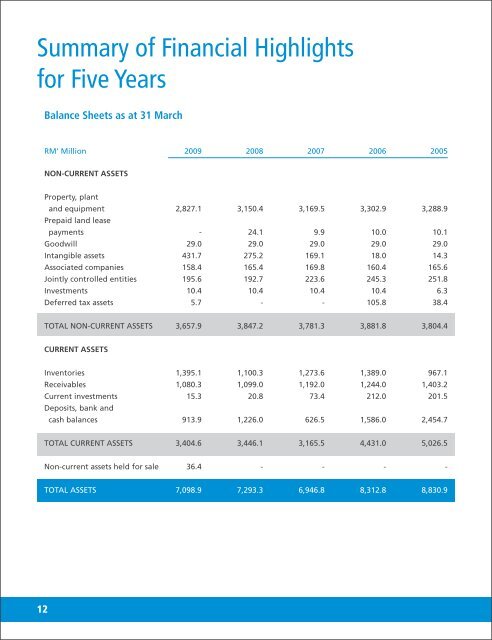
Summary of Financial Highlights<br />
for Five Years<br />
12<br />
Balance Sheets as at 31 March<br />
RM’ Million <strong>2009</strong> 2008 2007 2006 2005<br />
NON-CURRENT ASSETS<br />
Property, plant<br />
and equipment<br />
Prepaid land lease<br />
2,827.1 3,150.4 3,169.5 3,302.9 3,288.9<br />
payments - 24.1 9.9 10.0 10.1<br />
Goodwill 29.0 29.0 29.0 29.0 29.0<br />
Intangible assets 431.7 275.2 169.1 18.0 14.3<br />
Associated companies 158.4 165.4 169.8 160.4 165.6<br />
Jointly controlled entities 195.6 192.7 223.6 245.3 251.8<br />
Investments 10.4 10.4 10.4 10.4 6.3<br />
Deferred tax assets 5.7 - - 105.8 38.4<br />
TOTAL NON-CURRENT ASSETS 3,657.9 3,847.2 3,781.3 3,881.8 3,804.4<br />
CURRENT ASSETS<br />
Inventories 1,395.1 1,100.3 1,273.6 1,389.0 967.1<br />
Receivables 1,080.3 1,099.0 1,192.0 1,244.0 1,403.2<br />
Current investments<br />
Deposits, bank and<br />
15.3 20.8 73.4 212.0 201.5<br />
cash balances 913.9 1,226.0 626.5 1,586.0 2,454.7<br />
TOTAL CURRENT ASSETS 3,404.6 3,446.1 3,165.5 4,431.0 5,026.5<br />
Non-current assets held for sale 36.4 - - - -<br />
TOTAL ASSETS 7,098.9 7,293.3 6,946.8 8,312.8 8,830.9


