Baseline Water Quality Review - Elbert County, Colorado
Baseline Water Quality Review - Elbert County, Colorado
Baseline Water Quality Review - Elbert County, Colorado

Create successful ePaper yourself
Turn your PDF publications into a flip-book with our unique Google optimized e-Paper software.
<strong>Baseline</strong> <strong>Water</strong> <strong>Quality</strong> <strong>Review</strong> -<br />
<strong>Elbert</strong> <strong>County</strong>, <strong>Colorado</strong><br />
May 4, 2012<br />
S.S. PAPADOPULOS & ASSOCIATES, INC.<br />
Boulder, <strong>Colorado</strong><br />
3100 Arapahoe Avenue, Suite 203, Boulder, <strong>Colorado</strong> 80303-1050 • (303) 939-8880
<strong>Baseline</strong> <strong>Water</strong> <strong>Quality</strong> <strong>Review</strong> -<br />
<strong>Elbert</strong> <strong>County</strong>, <strong>Colorado</strong><br />
Prepared for:<br />
<strong>Colorado</strong> Oil and Gas Conservation Commission<br />
Prepared by:<br />
May 4, 2012<br />
S.S. PAPADOPULOS & ASSOCIATES, INC.<br />
Boulder, <strong>Colorado</strong><br />
3100 Arapahoe Avenue, Suite 203, Boulder, <strong>Colorado</strong> 80303-1050 • (303) 939-8880
TABLE OF CONTENTS<br />
i<br />
S. PAPADOPULOS & ASSOCIATES, INC.<br />
Page<br />
LIST OF FIGURES .................................................................................................................. ii<br />
LIST OF TABLES .................................................................................................................... ii<br />
APPENDICES .......................................................................................................................... ii<br />
1.0 INTRODUCTION .........................................................................................................1<br />
1.1. Objectives ..........................................................................................................1<br />
1.2. Data Sources ......................................................................................................2<br />
2.0 HYDROGEOLOGIC SETTING ...................................................................................4<br />
2.1. Geology ..............................................................................................................4<br />
2.2. Hydrogeology Characteristics ............................................................................5<br />
3.0 WATER QUALITY CONDITIONS .............................................................................7<br />
3.1. Groundwater Geochemical Characterization .....................................................8<br />
3.2. Health and Drinking <strong>Water</strong> Standards ...............................................................9<br />
3.2.1. Inorganic <strong>Water</strong> <strong>Quality</strong> Standards ..................................................................10<br />
3.2.2. Volatile Organic Compounds ..........................................................................11<br />
3.2.3. Methane in Groundwater .................................................................................12<br />
3.3. Gases in water ..................................................................................................13<br />
4.0 CONCLUSIONS..........................................................................................................16<br />
5.0 REFERENCES ............................................................................................................18<br />
Figures<br />
Tables<br />
Appendix
LIST OF FIGURES<br />
ii<br />
S. PAPADOPULOS & ASSOCIATES, INC.<br />
1.1 Site Location Map, <strong>Elbert</strong> <strong>County</strong> and the Denver-Julesburg Basin, <strong>Colorado</strong><br />
1.2 Location of Oil and Gas Production Fields, Sample Locations with <strong>Water</strong> <strong>Quality</strong><br />
Information, and Other Wells in <strong>Elbert</strong> <strong>County</strong> and Surrounding Area<br />
2.1 Hydrogeologic Units in the Denver Basin (from Robson and Banta, 1995)<br />
2.2 Surface Geology (from DWR, 1996; after Robson, 1987) and Aquifer Well<br />
Completion<br />
2.3 Well Depth<br />
2.4 Histogram of Well Depths by Producing Aquifer<br />
3.1a Piper Diagram for Alluvial Wells and Surface <strong>Water</strong> Samples<br />
3.1b Piper Diagram for Wells Completed in the Denver and Dawson Aquifers<br />
3.1c Piper Diagram for Wells Completed in the Arapahoe and Laramie-Fox Hills Aquifers<br />
3.1d Piper Diagram for Produced <strong>Water</strong> from Gas Wells<br />
3.2 Distribution of Geochemical Signatures<br />
3.3a Distribution of Total Dissolved Solids (TDS)<br />
3.3b Distribution of Sulfate<br />
3.3c Distribution of Manganese<br />
3.3d Distribution of Iron<br />
3.4a Plots of TDS versus Major Cations (Sodium, Calcium, Magnesium, and Potassium)<br />
3.4b Plot of TDS versus Major Anions (Bicarbonate, Sulfate, and Chloride)<br />
3.4c Plot of Sodium versus Chloride and Sulfate<br />
3.5 Distribution of Methane<br />
3.6 Carbon and Hydrogen Isotopes of Methane for Domestic Wells (adapted from<br />
Whiticar, 1990)<br />
LIST OF TABLES<br />
3.1 <strong>Water</strong> <strong>Quality</strong> Results: Ions, pH and Total Dissolved Solids<br />
3.2 <strong>Water</strong> <strong>Quality</strong> Results: Drinking <strong>Water</strong> Metals, Halides and Dissolved Methane<br />
3.3 Summary of Gas Composition and Stable Isotope Analytes<br />
A Sample Location Information<br />
APPENDICES
Report
1.0 INTRODUCTION<br />
1<br />
S. PAPADOPULOS & ASSOCIATES, INC.<br />
The <strong>Colorado</strong> Oil and Gas Conservation Commission (COGCC) is conducting a<br />
baseline water quality study for <strong>Elbert</strong> <strong>County</strong>, <strong>Colorado</strong> (Figure 1.1), to characterize<br />
groundwater conditions in an area where oil and gas drilling activity has been relatively idle<br />
for the last several years, but where drilling activity may increase in the near future. The<br />
water quality conditions of the Denver Basin aquifers are the primary focus of the study since<br />
these hydrologic units provide the majority of water for domestic, livestock watering, and<br />
irrigation purposes throughout <strong>Elbert</strong> <strong>County</strong>, including in the northwestern portion of the<br />
county where COGCC sampling has been concentrated.<br />
S. S. Papadopulos and Associates, Inc. (SSPA) has been retained by the COGCC to<br />
review water quality sample results and stable isotope data previously collected from water<br />
wells, springs and surface waters in <strong>Elbert</strong> <strong>County</strong> and to document the general composition<br />
of the native water quality. This report summarizes and briefly evaluates the analytical<br />
results and stable isotope composition for water well samples and gas samples in the study<br />
area.<br />
1.1. Objectives<br />
The objectives of the water quality study are to:<br />
• Develop an electronic database of geographic and geochemical data obtained<br />
from water sampled in the area of interest.<br />
• Evaluate background water quality in <strong>Elbert</strong> <strong>County</strong> based on major ion<br />
analysis and identify areas where quality is impaired (based on drinking water<br />
standards).<br />
• Evaluate water quality in areas where COGCC has sampled, including<br />
background water quality and incidences where drinking water standards are<br />
exceeded.<br />
• Discuss characteristics of water chemistry that could potentially be related to<br />
impacts from oil and gas production activities.
1.2. Data Sources<br />
2<br />
S. PAPADOPULOS & ASSOCIATES, INC.<br />
<strong>Water</strong> quality sample results from wells, surface water, and springs were obtained<br />
from a 2,100 square mile area that encompasses <strong>Elbert</strong> <strong>County</strong>, as well as the western half of<br />
the townships bordering Douglas <strong>County</strong> along Range 65 West and the southern half of the<br />
townships bordering Arapahoe <strong>County</strong> along Township 5 South (Figure 1.2). The primary<br />
area of interest within the study area is the northwestern corner of <strong>Elbert</strong> <strong>County</strong> near<br />
producing oil and gas wells in Township 6 South and Ranges 62 through 65 West. This area<br />
is semi-rural and increasingly being populated with low density residential developments,<br />
unlike most of the county, which is undeveloped or rural. 1 Currently, there are less than 150<br />
producing oil and gas wells in <strong>Elbert</strong> <strong>County</strong>, one approved permit to drill in <strong>Elbert</strong> <strong>County</strong><br />
and no pending permits to drill in <strong>Elbert</strong> <strong>County</strong> (COGCC, May 3, 2012). Within the area of<br />
interest in neighboring counties, there are no approved permits to drill in eastern Douglas<br />
<strong>County</strong>, eleven approved permits to drill in southern Arapahoe <strong>County</strong>, and no pending<br />
permits in either of the neighboring areas.<br />
Groundwater samples for 25 domestic water wells (areas highlighted in yellow on<br />
Figure 1.2) were collected by the COGCC (or its contractor) and analyzed for a suite of<br />
inorganic and organic parameters. Samples were collected between October 2010 and<br />
October 2011 except one sample collected in Arapahoe <strong>County</strong> in November 2002. Reported<br />
analytes vary by sample location and typically include major water quality parameters<br />
(cations and anions), metals, the volatile organic compounds (VOCs), including the<br />
hydrocarbons benzene, toluene, ethylbenzene and xylenes (BTEX), and methane. <strong>Water</strong><br />
from three wells was sampled for gas composition and for carbon and hydrogen stable<br />
isotopes of methane. In addition to water well samples, 59 produced water samples and one<br />
natural gas sample from oil and gas wells in <strong>Elbert</strong> <strong>County</strong> were provided by the COGCC.<br />
Supplemental groundwater and surface water quality data was obtained from the U. S.<br />
Geological Survey National <strong>Water</strong> Inventory System (USGS-NWIS) for the entire area of<br />
interest. This water quality dataset includes results from 1964 to 2011 for 209 groundwater<br />
1 <strong>Elbert</strong> <strong>County</strong> has only three incorporated communities, Elizabeth, Kiowa, and Simla, and a total population<br />
of approximately 23,000 and less than 9,000 households according to the 2010 US Census.
3<br />
S. PAPADOPULOS & ASSOCIATES, INC.<br />
or springs locations and five surface water locations (http://nwis.waterdata.usgs.gov/co/nwis/<br />
qwdata).
2.0 HYDROGEOLOGIC SETTING<br />
2.1. Geology<br />
4<br />
S. PAPADOPULOS & ASSOCIATES, INC.<br />
The Denver Basin is an asymmetric structural trough (more steeply dipping beds on<br />
the west side of the basin than the east) containing Tertiary and Upper Cretaceous<br />
sedimentary rocks that form a major aquifer system east of the <strong>Colorado</strong> Front Range 2 . The<br />
Basin stretches from southern El Paso <strong>County</strong> northward to Greeley in Weld <strong>County</strong>. All of<br />
<strong>Elbert</strong> <strong>County</strong>, except for its eastern border is within the Denver Basin, and the large<br />
majority of the water wells in the county are completed in the bedrock aquifers of the basin.<br />
The water-bearing formations of the Denver Basin, from youngest to oldest, are the Dawson,<br />
Denver, Arapahoe, Laramie, and Fox Hills Sandstone formations. Together, these units are<br />
over 3,000 feet thick in much of the basin. The base of the water-productive Denver Basin is<br />
formed by the Pierre Shale, a widespread, fine-grained formation that is from 2,500 to more<br />
than 4,500 feet thick in <strong>Elbert</strong> <strong>County</strong> (Shurr, 1980).<br />
The Denver Basin, as delineated above, covers an area of 6,700 square miles. The<br />
Denver-Julesburg (D-J) Basin, which encompasses the Denver Basin, but also includes the<br />
underlying Pierre Shale and earlier Cretaceous to Pennsylvanian sedimentary formations,<br />
covers an area of approximately 70,000 square miles and extends from southeastern<br />
Wyoming into western Nebraska and central <strong>Colorado</strong> (Higley and Cox, 2007) (Figure 1.1).<br />
These deeper rocks generally are not productive water-bearing units (e.g., Pierre Shale) or do<br />
not contain fresh water suitable for agricultural or water supply use. The D-J Basin is<br />
important, however, as a hydrocarbon-producing region, with oil and gas production having<br />
occurred in the basin since the late 1800’s. Several hundred oil and gas wells have been<br />
drilled in <strong>Elbert</strong> <strong>County</strong>, and while many of the wells in the county have been plugged and<br />
abandoned, it is expected that a new influx of drilling will occur in the near future as<br />
producers begin to exploit tight low-permeability formations such as the Niobrara Formation<br />
within the D-J Basin.<br />
2 Much of the information provided in this section, especially that related to the Denver Basin is taken from<br />
Topper (2004), an overview paper contained in a Rocky Mountain Association of Geologists volume on the<br />
bedrock aquifers of the Denver Basin.
2.2. Hydrogeology Characteristics<br />
5<br />
S. PAPADOPULOS & ASSOCIATES, INC.<br />
The great majority of the water supply wells in <strong>Elbert</strong> <strong>County</strong> are completed in<br />
Denver Basin bedrock aquifers. The productive units in the Denver Basin are divided into<br />
the Dawson, Denver, Arapahoe, and Laramie-Fox Hills aquifers. The stratigraphic and<br />
hydrogeologic unit characteristics are shown in Figure 2.1 (from Robson and Banta, 1985).<br />
The Denver Basin aquifer units are made up primarily of sandstones and siltstones and are<br />
separated from each other by intervening finer-grained layers. In <strong>Elbert</strong> <strong>County</strong>, the Dawson<br />
formation and aquifer, which is the uppermost of the units, is present at the ground surface<br />
along the western edge of the northern portion of the county (Figure 2.2). The Dawson<br />
aquifer is characterized by conglomeritic, coarse-grained sandstones with minor amounts of<br />
interbedded clay and clay shale. The Dawson aquifer has a saturated thickness of up to 400<br />
feet. The Denver formation and aquifer are present at the ground surface east of the Dawson<br />
to approximately the center of the county. The Denver formation includes interbedded lenses<br />
of shale, claystone, siltstone, sandstone, and scattered coal beds. The water-bearing units of<br />
the Denver aquifer are discontinuous in nature and have a total thickness between 100 and<br />
350 feet. Most of the wells sampled by COGCC in <strong>Elbert</strong> <strong>County</strong> are completed in the<br />
Dawson or the Denver aquifers.<br />
The Arapahoe aquifer lies beneath the Denver aquifer and rocks of the Arapahoe<br />
formation are present at the ground surface in a relatively narrow band trending north-south<br />
through central <strong>Elbert</strong> <strong>County</strong>. The Arapahoe formation consists of interbedded<br />
conglomerate, sandstone, siltstone, and shale, and the aquifer is the most productive of the<br />
Denver Basin aquifers. The lower portion of the Laramie formation and the Fox Hills<br />
sandstone are grouped together as the Laramie-Fox Hills aquifer. The upper portion of the<br />
Laramie formation is dominated by shale layers and is not a water producing unit.<br />
The wells whose water sample results are used in the geochemical analysis for <strong>Elbert</strong><br />
<strong>County</strong> are shown in Figure 2.2. The figure also shows the aquifers that the wells are<br />
completed in based on information obtained from the <strong>Colorado</strong> Division of <strong>Water</strong> Resources<br />
(DWR) and the USGS-NWIS. Where available, the depths of the wells are shown in Figure<br />
2.3 and a stacked histogram summarizing the well information is shown in Figure 2.4. Of the<br />
86 wells shown on Figure 2.3 whose productive horizons were known, only 9 were
6<br />
S. PAPADOPULOS & ASSOCIATES, INC.<br />
completed in younger unconsolidated alluvial deposits above the Denver Basin bedrock<br />
formations and most of these are located just west of <strong>Elbert</strong> <strong>County</strong> in Douglas <strong>County</strong>.<br />
(Many wells in Arapahoe <strong>County</strong> immediately north of the study area are completed in<br />
alluvium; however, because such completions are rare in <strong>Elbert</strong> <strong>County</strong>, the area containing<br />
those wells and further north were excluded from the <strong>Elbert</strong> <strong>County</strong> analysis). While the few<br />
alluvial wells evaluated are all less than 80 feet deep, the wells completed in the bedrock<br />
aquifers are from 100 to 1,000 feet deep (except for one 2,150-foot-deep well completed in<br />
the Arapahoe aquifer in Section 18, Township 8 South, Range 64 West) with the majority of<br />
the wells ranging between 200 and 600 feet deep. Potentiometric surface mapping (Robson,<br />
1987) indicates that the groundwater in the Denver Basin aquifers in <strong>Elbert</strong> <strong>County</strong> flows<br />
predominantly in a northward direction.<br />
Recharge to the Denver Basin aquifers in <strong>Elbert</strong> <strong>County</strong> occurs where each of the<br />
aquifer formations are exposed at the ground surface. Recharge is primarily from<br />
precipitation, which is severely limited by the county’s relatively dry climate, and there is the<br />
potential to over-produce groundwater causing long-term lowering of water levels and<br />
concurrent depletion (or mining) of the groundwater resource. Special rules that are designed<br />
to mitigate the effects of over-production from the bedrock aquifers have been implemented<br />
for the Denver Basin (http://water.state.co.us/DWRDocs/Rules/Pages/CGWCRules.aspx).<br />
To date, all oil and gas production in <strong>Elbert</strong> <strong>County</strong> has occurred beneath the Pierre<br />
Shale, which thickens from 2,500 feet in the southeast corner of the county to greater than<br />
4,500 feet on the western edge of the county (Shurr, 1980). Therefore, the Pierre Shale<br />
provides a barrier of several thousand feet below the deepest water supply wells in the county<br />
and the oil and gas producing horizons below. There is the potential for oil or gas<br />
exploration in the Pierre Shale to be conducted at some point in the future, but at present, the<br />
formation is not known to be productive locally or even to be a target for future exploration.
3.0 WATER QUALITY CONDITIONS<br />
7<br />
S. PAPADOPULOS & ASSOCIATES, INC.<br />
This section summarizes analytical results for both water quality parameters (major<br />
anions and cations, metals, BTEX, MTBE, and dissolved methane) and for gas composition<br />
and methane gas isotopes. The results are considered in relation to state and federal health<br />
and water quality standards and are further evaluated with respect to overall hydrologic<br />
setting and for potential effects from activities that are normally associated with oil and<br />
natural gas production.<br />
For the <strong>Elbert</strong> <strong>County</strong> geochemical evaluation, SSPA developed an electronic<br />
database from analytical results obtained from the COGCC and the USGS-NWIS website.<br />
Analytical sample results were checked for ion balance (a comparison of total anion charges<br />
of the water to total cation charges) and were censored if the ion balance inequality was<br />
greater than 10%. Duplicate sample and laboratory QA/QC results were removed from the<br />
dataset used for geochemical analysis.<br />
Geographic and sample site information for all locations where sample results were<br />
available are provided in Appendix A. A total of 524 water sample results from 239<br />
locations were compiled in the database for the area of interest. Sample results from 145<br />
locations (424 samples) were censored from the geochemical water type analysis, often<br />
because there were no bicarbonates reported in sample results from the USGS-NWIS. Of the<br />
remaining 100 sample results from 94 locations included in the geochemical characteristics<br />
evaluation (Figure 1.2), 21 water samples from domestic wells were collected and reported<br />
by the COGCC and 79 samples from 73 site locations (three sites have data for multiple<br />
sampling events) were obtained from USGS-NWIS. Samples from USGS-NWIS include 65<br />
groundwater wells, seven springs, and one surface water location.<br />
Produced water sample results from oil and gas wells were censored using the same<br />
requirements described above. Of the 59 samples available, 32 were within the ion balance<br />
requirements. Produced water samples are presented in the discussions below as a<br />
comparison for water samples collected from domestic wells, springs or surface water<br />
locations.
3.1. Groundwater Geochemical Characterization<br />
8<br />
S. PAPADOPULOS & ASSOCIATES, INC.<br />
Uncensored groundwater, spring, and surface water analytical results were evaluated<br />
for major ion chemistry and water quality composition. A summary of the inorganic<br />
parameter results for all uncensored samples and for all samples collected by COGCC or<br />
their contractors (whether censored or uncensored) is presented in Table 3.1.<br />
Piper diagrams (also called trilinear plots) were developed to illustrate the overall<br />
geochemical characteristics and trends for the groundwater in <strong>Elbert</strong> <strong>County</strong>. The Piper<br />
diagrams use major cation and anion concentrations to demonstrate relationships among<br />
multiple samples or sample groups (Hem, 1985). In these diagrams the reactive quantities of<br />
the ions (measured in milliequivalents per liter; meq/L) are the basis for the plots rather than<br />
the mass quantities, milligrams/L (mg/L), presented in Table 3.1.<br />
Piper diagrams are presented for each drinking water aquifer in the study area. The<br />
piper diagram for alluvial wells and surface water samples is shown in Figure 3.1a. The<br />
water in almost all of the alluvial wells is dominated by calcium (Ca) cations and bicarbonate<br />
(HCO3) anions (i.e., has a Ca-HCO3 geochemical signature) and by low total dissolved solids<br />
(TDS, a measure of the total ions present in the water) concentrations. This pattern is typical<br />
of shallow unconfined alluvial aquifers that are not recharged by precipitation or by pristine<br />
surface water and are not affected by high dissolved solids surface waters. In the study area<br />
only one 14-foot deep well with TDS of 2820 mg/L and a Ca-SO4 geochemical signature,<br />
located in the far northeast corner of <strong>Elbert</strong> <strong>County</strong>, fell well outside of this norm. The<br />
distribution of geochemical signatures for the samples evaluated for this project is shown in<br />
Figure 3.2.<br />
The Piper diagrams for the Denver and Dawson aquifers (Figure 3.1b) and the<br />
Arapahoe and Laramie Fox Hills aquifers (Figure 3.1c) illustrate the progression from Ca-<br />
HCO3 dominated water for the overlying Dawson formation water as it evolves towards<br />
sodium sulfate (Na-SO4) water in the Denver formation. In general TDS trends upward with<br />
the progression from the Dawson to the Denver aquifer samples. For the wells sampled by<br />
COGCC or their contractors, this change is well illustrated by the inset on Figure 3.2; all of<br />
the southwest cluster of wells are completed in the Dawson aquifer and have TDS
9<br />
S. PAPADOPULOS & ASSOCIATES, INC.<br />
concentrations less than 250 mg/L while all of the northeast cluster of wells are completed in<br />
the Denver aquifer and, with one exception, have TDS concentrations between 250 and 500<br />
mg/L (Figure 3.3a). The pattern is similar for sulfate (Figure 3.3b), where all the wells in the<br />
southwest cluster have concentrations less than 125 mg/L, while the northeast cluster<br />
includes several wells with concentrations between 125 mg/L and 250 mg/L and one well<br />
with a concentration of 270 mg/L.<br />
<strong>Water</strong> from the Arapahoe and Laramie-Fox Hills aquifers extends the same anioncation<br />
trends, although the signal is less clear for the Laramie-Fox Hills wells. Notably, as<br />
shown in the anion base triangle of the Piper diagram (Figure 3.1c), the water from these<br />
lower two aquifers have consistently low proportions of chloride among the total anions,<br />
even compared to samples from the alluvial and other bedrock aquifers. These trends are<br />
also evident in the plots of anions to TDS and cations to TDS shown in Figures 3.4a and 3.4b<br />
and in the plot of chloride and sulfate to sodium shown in Figure 3.4c.<br />
As would be expected, the piper diagram for produced water from natural gas wells in<br />
<strong>Elbert</strong> <strong>County</strong> (Figure 3.1d) shows that the produced waters are dominated by sodium cations<br />
and chloride anions, which are indicative of brackish water and saltwater brines. Only two<br />
samples of the 34 evaluated show mixed signatures, one with bicarbonate and one with both<br />
bicarbonate and sulfate.<br />
Overall, the geochemical characteristics of the water samples from <strong>Elbert</strong> <strong>County</strong> are<br />
typical for water in the Denver Basin aquifers and for other Tertiary and Upper Cretaceous<br />
aquifers in the state of <strong>Colorado</strong>. None of the results indicate impacts from the deeper,<br />
higher salinity water present in the oil and gas producing strata in the Basin.<br />
3.2. Health and Drinking <strong>Water</strong> Standards<br />
All water sample results, including those censored from major ion chemistry analysis,<br />
were included in drinking water health standards evaluations. <strong>Water</strong> quality results for major<br />
ions, metals, halides, and methane sample results are shown in Tables 3.1 and 3.2. Any<br />
compounds that exceed either primary or secondary <strong>Colorado</strong> Basic Groundwater Standards<br />
(CBGWS) are highlighted in the tables.
10<br />
S. PAPADOPULOS & ASSOCIATES, INC.<br />
CBGWS are regulatory human health and drinking water quality standards for<br />
groundwater used for human consumption. The primary or human health standards (same as<br />
federal maximum contaminant levels; MCLs) are established based on potential health<br />
effects resulting from exposure to drinking water containing a given compound while<br />
secondary water quality standards are related to the aesthetic qualities of water, such as odor<br />
and taste.<br />
3.2.1. Inorganic <strong>Water</strong> <strong>Quality</strong> Standards<br />
In the dataset collected for this study, the presence and distribution of wells where<br />
primary and secondary CBGWS are evaluated are biased by sample results from several very<br />
shallow wells (one 60 feet deep and the remainder less than 40 feet deep) located in the far<br />
northeast corner of <strong>Elbert</strong> <strong>County</strong>. Many of these wells, which appear to be part of an<br />
ongoing water quality study (possibly being conducted by the USGS), have been sampled<br />
multiple times (up to a maximum of over 40 times) and all are located in an area with almost<br />
no oil and gas development. The wells appear to be monitoring, irrigation, or livestock wells<br />
and they do not include any drinking water wells. The discussion below does not include the<br />
wells from this study.<br />
For the remainder of the results reviewed for this study, primary CBGWS for<br />
inorganic water quality (major ions, metals, and halides) were exceeded as described below:<br />
• Arsenic (As) concentrations were detected at the primary CBGWS of 0.01<br />
mg/L in two out of 31 locations sampled. No results exceeded 0.011 mg/L.<br />
• Selenium (Se) was detected at 39 locations and selenium concentrations<br />
exceeded the primary CBGWS of 0.05 mg/L in one well located in Section<br />
34, Township 6 South, Range 63 West. This well had a selenium<br />
concentration of 0.06 mg/L; all other results were at or below 0.02 mg/L.<br />
• Nitrate (NO3) concentrations exceeded the primary CBWS of 10 mg/L as N at<br />
two locations sampled. Nitrate is a common indicator of anthropogenic<br />
impacts and is often prevalent in shallow wells in permeable alluvial aquifers.<br />
One of the nitrate exceedances is from a spring located just inside Douglas<br />
<strong>County</strong> at the southwest corner of western <strong>Elbert</strong> <strong>County</strong> (Section 36,<br />
Township 10 South, Range 65 West) and one is from a 100-foot deep well<br />
completed in the Denver formation in Section 32, Township 10 South, Range<br />
61 West. Both locations had nitrate concentrations of 13 mg/L, only slightly<br />
above the CBGWS.
11<br />
S. PAPADOPULOS & ASSOCIATES, INC.<br />
• None of the locations sampled by the COGCC or their contractors had any<br />
inorganic compounds that exceeded primary water quality standards.<br />
Secondary CBGWS for drinking water quality are established as guidelines for water<br />
aesthetics. Concentrations of TDS, sulfate, manganese (Mn), and iron (Fe) exceeded<br />
secondary CBGWS drinking water limits in several of the wells sampled:<br />
• TDS was detected above its nominal secondary standard of 500 mg/L in 22<br />
locations sampled (including only censored results). As discussed above, the<br />
wells with TDS exceedances are primarily those wells completed in the lower<br />
of the Denver Basin aquifers, the Arapahoe and the Laramie-Fox Hills (Figure<br />
3.3a). Only one of the wells sampled by COGCC or its contractors contained<br />
TDS above the CBGWS secondary standard.<br />
• Sulfate (SO4) was detected above its secondary standard of 250 mg/L in 18<br />
locations sampled. As shown in Figure 3.3b, and as would be expected based<br />
on the positive correlation between TDS and sulfate in the geochemical<br />
evolution of groundwater in the Denver Basin, most of the wells where sulfate<br />
exceeds CBGWS are completed in the Arapahoe and the Laramie-Fox Hills<br />
aquifers. Only one of the wells sampled by COGCC or its contractors<br />
contained sulfate above the CBGWS secondary standard.<br />
• Manganese (Mn) was detected above its secondary standard of 0.05 mg/L in<br />
27 of 78 locations sampled, and iron (Fe) was detected above its secondary<br />
standard of 0.3 mg/L in 13 of 81 locations sampled The wells with detects of<br />
both iron and manganese above CBGWS are spread throughout <strong>Elbert</strong> <strong>County</strong><br />
(Figures 3.3c and 3.3d). With two exceptions, in all of the wells where iron<br />
was present above its standard, manganese was also present above standard.<br />
Of the wells sampled by GOGCC or its contractors, manganese was present at<br />
concentrations slightly above standard at three locations; none of the samples<br />
exceeded standard for iron.<br />
In general, water quality of the drinking water wells in <strong>Elbert</strong> <strong>County</strong> is good and<br />
only a minority of the locations sampled had any exceedances of either primary or secondary<br />
CBGWS.<br />
3.2.2. Volatile Organic Compounds<br />
Volatile organic compounds (VOCs) include those compounds commonly associated<br />
with industrial chemicals and solvents, with some household cleansers and related<br />
compounds, and with petroleum hydrocarbons such as gasoline, diesel fuel, and unrefined<br />
crude oil and natural gas liquid condensates. Frequently, sampling of suburban or rural
12<br />
S. PAPADOPULOS & ASSOCIATES, INC.<br />
domestic wells does not include the broad spectrum of VOCs normally associated with<br />
industrial processes; instead selected constituents of petroleum hydrocarbons are monitored.<br />
These include benzene, toluene, ethylbenzene, and xylenes (BTEX), and the former gasoline<br />
additive MTBE. For the <strong>Elbert</strong> <strong>County</strong> study area, 43 locations were sampled for BTEX<br />
(including all the wells sampled by COGCC or their contractors) and except a single well<br />
with a detection of 0.47 micrograms/Liter (µg/L) of toluene, there were no measureable<br />
concentrations of BTEX detected in any of the samples. This concentration is well below the<br />
primary CBGWS of 560 µg/L. Only one sample was analyzed for MTBE (in Arapahoe<br />
<strong>County</strong> in 2002) and that sampled was a non-detect.<br />
All of the samples from <strong>Elbert</strong> <strong>County</strong> collected by COGCC or their contractors were<br />
analyzed for an extensive list of VOCs. Except for the single toluene detect discussed above,<br />
there were no VOCs detected in any of the samples.<br />
3.2.3. Methane in Groundwater<br />
Methane is an odorless and tasteless gas and does not present a known health hazard<br />
to humans; however, it can create flammable or explosive conditions when it occurs in<br />
groundwater at elevated concentrations, especially if it is allowed to accumulate within<br />
confined areas. As such, concentrations below 1 mg/L are considered harmless, with concern<br />
for hazards increasing at concentrations in well water at or above 7 mg/L.<br />
The COGCC analyzed groundwater samples for dissolved methane at 24 well<br />
locations in the area of interest in the northwestern portion of <strong>Elbert</strong> <strong>County</strong> and in one<br />
sample from 2002 from southern Arapahoe <strong>County</strong>. Dissolved methane was detected in 15<br />
of the locations sampled; although at four locations the detects were less than 0.001 mg/L,<br />
above the detection limit, but below the reporting limit (quantitation limit) of 0.005 mg/L for<br />
the laboratory analyses (Table 3.2). All but three of the samples concentrations were below 1<br />
mg/L. The distribution of dissolved methane in groundwater is shown in Figure 3.5. All<br />
three of the wells with groundwater dissolved methane concentrations above 1 mg/L are<br />
completed in the Denver aquifer and are completed at depths ranging from 460 to 905 feet<br />
deep.
13<br />
S. PAPADOPULOS & ASSOCIATES, INC.<br />
COGCC will normally resample wells where dissolved methane concentrations in<br />
groundwater exceed 1 mg/L, and will analyze the samples for compositional gases and for<br />
hydrogen and carbon isotopes of methane (see the next section) to help evaluate the source of<br />
the methane. When concentrations in groundwater exceed 2 mg/L, a regular sampling<br />
program is recommended and mitigation of methane buildup may be necessary. For the<br />
<strong>Elbert</strong> <strong>County</strong> samples collected under COGCC direction, three of the methane detections<br />
were above 2 mg/L concentration and two were above 7 mg/L, which is considered to be a<br />
level above which mitigation efforts should be undertaken.<br />
3.3. Gases in water<br />
Isotech Laboratories in Champaign, Illinois, analyzed water or headspace gas samples<br />
from three wells with methane groundwater concentrations above 1 mg/L for atmospheric<br />
and hydrocarbon gas composition and stable isotopes of methane. The results are<br />
summarized in Table 3.3. Gas composition results are reported as the molar percentage of<br />
each gas (where total gases equal 100 percent). The detection limits for common gases<br />
nitrogen (N2), oxygen (O2), carbon dioxide (CO2), and argon (Ar) are 30-50 ppm in undiluted<br />
samples of headspace gas.<br />
For the carbon stable isotopes analyses, the results are given as the parts per thousand<br />
(permil or ‰; 1 permil = 1/1000) ratio of the stable carbon isotopes ( 13 C/ 12 C) 3 .from the<br />
sample compared to the ratio in an industry-accepted marine carbonate standard. (This value<br />
is indicated in literature using the abbreviation δ 13 C). Specifically, δ 13 C is defined as:<br />
δ C<br />
13<br />
RS<br />
− R<br />
=<br />
R<br />
PDB<br />
PDB<br />
× 1000<br />
where R denotes the ratio of the heavy to light isotope ( 13 C/ 12 C), and RS and RPDB are the<br />
ratios in the sample and standard, respectively. The reference standard for carbon (PDB) is a<br />
calcite (CaCO3), which by definition has a δ 13 C value of 0. A positive δ value means that the<br />
isotopic ratio of the sample is higher (i.e. has more of the heavy isotope) than the standard; a<br />
negative δ value means that the isotopic ratio of the sample is lower (i.e. has less of the heavy<br />
3 That is, the ratio of carbon with a seventh neutron in the nucleus to carbon with the normal six neutrons.
14<br />
S. PAPADOPULOS & ASSOCIATES, INC.<br />
isotope) than the standard. For example, a δ 13 C value of -20 per mil means that the 13 C/ 12 C<br />
ratio of the sample is 20 parts per thousand or 2.0 % lower than that of the PDB standard.<br />
Isotopes of hydrogen in methane are determined similarly. The two isotopes measured are<br />
hydrogen with a molecular weight of 1 (H1) and the deuterium (D or H2) isotope which has a<br />
molecular weight of 2 grams/mole. The permil ratio is for D/H1 and is referred to as δD,<br />
where the reference standard has been established as VSMOW (or Vienna Standard Mean<br />
Ocean <strong>Water</strong>).<br />
The compositional gases and isotope results for the three samples collected for<br />
COGCC are shown in Table 3.3. Methane groundwater concentrations for these wells were<br />
elevated, ranging from 5.9 to 11 mg/L. Even though the Skoglund well had the highest<br />
groundwater methane concentration of the three wells, it had atmospheric gas concentrations<br />
that more closely resembled atmospheric air concentrations and a significantly lower<br />
methane (C1) gas concentration than the samples from the Allen and Purvis wells (4.03%<br />
versus 29.73% and 29.12%, respectively). Notably, for all three wells, the concentrations of<br />
the heavier hydrocarbon gases ethane (C2) and propane (C3) were very low or below<br />
detection limit, resulting in C1/(C2+C3) ratios of 1600 to 2000, which is a strong indicator<br />
(in conjunction with other measures) of gases that are biogenic in origin. Thermogenic<br />
methane from conventional oil and natural gas deposits normally has a C1/(C2+C3) ratio of<br />
less than 100 (Whiticar, 1990).<br />
The stable isotopes of methane, δ 13 C and δD were determined for all three gas<br />
samples (Table 3.3). As demonstrated in Figure 3.6, results show that both that δ 13 C and δD<br />
values are characteristic of biogenic methane and not thermogenic methane that is associated<br />
with conventional oil and natural gas deposits or with coalbed gases. The δ 13 C values for the<br />
three <strong>Elbert</strong> <strong>County</strong> water wells were all less than (i.e., isotopically lighter and more negative<br />
than) -86 ‰ and δD values were less than -319 ‰. Thermogenic methane from conventional<br />
oil or gas deposits, in contrast, is considerably heavier, with δ 13 C generally being greater than<br />
(i.e., less negative than) -50 ‰, and δD values greater than approximately -250 ‰ (Whiticar,<br />
1990).
15<br />
S. PAPADOPULOS & ASSOCIATES, INC.<br />
For the three samples, the combination of the hydrocarbon gas concentrations and<br />
C1/(C2+C3) ratios and the very low methane isotopic values indicates the methane in the<br />
wells is biogenic in origin and in absence of nearby anthropogenic sources such as landfills,<br />
is likely a naturally occurring phenomenon.
4.0 CONCLUSIONS<br />
16<br />
S. PAPADOPULOS & ASSOCIATES, INC.<br />
SSPA evaluated 25 groundwater samples collected by the COGCC or their<br />
contractors, and augmented the evaluation by incorporating 209 groundwater and springs<br />
locations, and 5 surface water samples obtained through the USGS on-line NWIS database in<br />
order to allow a broader assessment of groundwater conditions in <strong>Elbert</strong> <strong>County</strong> to be<br />
conducted. Parameters evaluated included major ions, metals, halides, methane, and BTEX<br />
in water, and compositional gases and isotopes of methane for three gas samples.<br />
Conclusions of this evaluation are provided below.<br />
• The large majority of the samples evaluated were groundwater from water wells<br />
(spring samples were included and considered to be representative of groundwater<br />
from the formations they emanated from).<br />
• Most of the water supply wells are completed in one of the Denver Basin bedrock<br />
aquifers. Excluding an area in the far northeast corner of <strong>Elbert</strong> <strong>County</strong> where a<br />
shallow groundwater quality study is apparently being conducted, only 9 of the<br />
wells were completed in alluvium; all of those wells are in Douglas <strong>County</strong> and<br />
are less than 80 feet deep. In contrast, the majority of the bedrock wells were<br />
between 200 and 600 feet deep.<br />
• Geochemical analysis of major ion groundwater results indicate that the<br />
groundwater present in the alluvial aquifers has low TDS and mixed cation and<br />
anion concentration with the majority of the samples having a Ca-HCO3<br />
geochemical signature. The results are consistent with shallow groundwater that is<br />
not affected by elevated TDS surface water influences.<br />
• Geochemical signature of the bedrock aquifer samples indicate an overall<br />
evolution from Ca-HCO3 water towards a Na-SO4 end member; probably as<br />
flowpaths within the bedrock aquifers increase and naturally soluble sodium and<br />
sulfate are leached into the water from the bedrock itself.<br />
• Chloride concentrations were relatively low in all the groundwater samples, and<br />
there was no suggestion of any trend of increasing chloride with increasing TDS or<br />
sodium in the samples.<br />
• There are very few wells with any inorganic compound primary groundwater<br />
standards exceedances (two wells for arsenic and nitrate, and one for selenium).<br />
Similarly, BTEX, was nearly absent from the samples, with only one sample<br />
having a very low concentration of toluene.<br />
• Secondary groundwater standards were exceeded in a minority of the groundwater<br />
samples analyzed for inorganic parameters. Exceedances of TDS, sulfate,<br />
manganese, and/or iron were reported in 89 of the 239 locations evaluated for this<br />
study.
17<br />
S. PAPADOPULOS & ASSOCIATES, INC.<br />
• Dissolved methane in groundwater was present at detectable concentrations in 15<br />
of the 24 wells sampled. Concentrations were below 1 mg/L in all wells but three.<br />
Gas composition and methane stable isotopes were sampled for the three wells<br />
with elevated groundwater methane concentrations. In all three wells, both the<br />
ratios of the C1 through C6 range hydrocarbon gases and the carbon and hydrogen<br />
stable isotopes of methane indicated a biogenic origin for the methane in the wells.<br />
• Generally, groundwater quality in the wells sampled for this study is good. There<br />
is no evidence that water quality has been impacted by activities related to oil and<br />
natural gas exploration or production activities.
5.0 REFERENCES<br />
18<br />
S. PAPADOPULOS & ASSOCIATES, INC.<br />
Hem, J. D., 1985. Study and Interpretation of the Chemical Characteristics of Natural <strong>Water</strong>,<br />
Third Edition. U. S. Geological Survey <strong>Water</strong>-Supply Paper 2254. 263 pp.<br />
Higley, D. K., and D. O. Cox, 2007. Oil and Gas Exploration and Development along the<br />
Front Range in the Denver Basin of <strong>Colorado</strong>, Nebraska, and Wyoming. In Higley, D.<br />
K., ed., Petroleum Systems and Assessment of Undiscovered Oil and Gas in the Denver<br />
Basin Province, <strong>Colorado</strong>, Kansas, Nebraska, South Dakota, and Wyoming—USGS<br />
Province 39. U. S. Geological Survey Digital Data Series DDS-69-P, Version 1.0.<br />
Chapter 2.<br />
Robson, S. G., 1987. Bedrock Aquifers in the Denver Basin, <strong>Colorado</strong>—A Quantitative<br />
<strong>Water</strong>-Resources Appraisal. U. S. Geological Survey Professional Paper 1257. 73 pp.<br />
Robson, S.G. and E.R. Banta, 1995. Groundwater Atlas of the United States- Arizona,<br />
<strong>Colorado</strong>, New Mexico, Utah. U. S. Geological Survey Hydrologic Investigations Atlas<br />
730-C. Figure 83.<br />
Shurr, G. W., 1980. Geologic Setting of the Pierre Shale, Northern Great Plains. U. S.<br />
Geological Survey, Open-File Report 80-675. 8 pp.<br />
Topper, R., 2004. Aquifers of the Denver Basin, <strong>Colorado</strong>. In Raynolds, R. G., and M.<br />
Reynolds, eds., A Special Issue on Bedrock Aquifers of the Denver Basin. The Mountain<br />
Geologist, October 2004, V. 41, No. 4. pp. 145-152.<br />
US Census Bureau State and <strong>County</strong> QuickFacts, March 15, 2003. (http://quickfacts.census.<br />
gov/qfd/states/08/08039.html,)<br />
Whiticar, M. J., 1990. A geochemical perspective of natural gas and atmospheric methane.<br />
Advances in Organic Geochemistry, vol. 16, nos. 1-3, pp. 531-547.
Figures
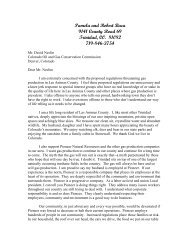
Study Area<br />
<strong>Elbert</strong> <strong>County</strong><br />
Denver-Julesburg (D-J) Basin<br />
Figure 1.1 Site Location Map, <strong>Elbert</strong> <strong>County</strong> and the Denver-Julesburg Basin, <strong>Colorado</strong><br />
0 25450<br />
100<br />
Miles
T 4 S<br />
T 5 S<br />
T 6 S<br />
T 7 S<br />
T 8 S<br />
T 9 S<br />
T 10 S<br />
R 65 W<br />
<strong>Water</strong> <strong>Quality</strong> Sample Locations<br />
!( From COGCC<br />
!( From USGS-NWIS<br />
R 64 W<br />
Censored Sample Locations<br />
(limited or insufficient sample results)<br />
") From COGCC<br />
") From USGS-NWIS<br />
! Area Sampled by COGCC<br />
Oil & Gas Well Status<br />
k Producing<br />
k Shut in<br />
A Plugged, Dry, or Abandoned<br />
!( Produced <strong>Water</strong> Samples<br />
Producing Oil/Gas Fields<br />
(COGIS, Feb 2012)<br />
R 63 W<br />
R 62 W<br />
R 61 W<br />
R 60 W<br />
T 11 S<br />
T 12 S<br />
T 13 S<br />
T 14 S<br />
R 59 W<br />
R 58 W<br />
R 57 W<br />
4<br />
0 3 6 12<br />
Figure 1.2 Location of Oil and Gas Production Fields, Sample Locations with <strong>Water</strong> <strong>Quality</strong> Information,<br />
and Other Wells in <strong>Elbert</strong> <strong>County</strong> and Surrounding Area<br />
Miles
Figure 2.1 Hydrogeologic Units in the Denver Basin (from Robson and Banta, 1995)
T 4 S<br />
T 5 S<br />
T 6 S<br />
T 7 S<br />
T 8 S<br />
T 9 S<br />
T 10 S<br />
R 65 W<br />
Aquifer Well Completion<br />
!( Alluvium<br />
!( Dawson<br />
!( Denver<br />
!( Arapahoe<br />
!( Laramie-Fox Hills<br />
!( Unknown<br />
Aquifer (DWR, 1996)<br />
Upper Dawson Aquifer<br />
Lower Dawson Aquifer<br />
Denver Aquifer<br />
Arapahoe Aquifer<br />
Laramie Formation<br />
Laramie-Fox Hills Aquifer<br />
R 64 W<br />
Surface Geology (after Robson, 1987)<br />
Arapahoe<br />
Dawson<br />
Denver<br />
Laramie-Fox Hills<br />
R 63 W<br />
R 62 W<br />
R 61 W<br />
R 60 W<br />
T 11 S<br />
T 12 S<br />
T 13 S<br />
T 14 S<br />
Figure 2.2 Surface Geology (from DWR, 1996; after Robson, 1987) and Aquifer Well Completion<br />
R 59 W<br />
R 58 W<br />
R 57 W<br />
4<br />
0 3 6 12<br />
Miles
T 4 S<br />
T 5 S<br />
T 6 S<br />
T 7 S<br />
T 8 S<br />
T 9 S<br />
T 10 S<br />
Well Depth<br />
(feet bgs)<br />
!( < 80<br />
!( 80 - 200<br />
!( 200 - 400<br />
!( 400 - 600<br />
!( 600 - 800<br />
!( 800 - 1,000<br />
!( > 1,000<br />
R 65 W<br />
Aquifer (DWR, 1996)<br />
Upper Dawson Aquifer<br />
Lower Dawson Aquifer<br />
Denver Aquifer<br />
Arapahoe Aquifer<br />
Laramie Formation<br />
Laramie-Fox Hills Aquifer<br />
Figure 2.3 Well Depth<br />
R 64 W<br />
R 63 W<br />
R 62 W<br />
R 61 W<br />
R 60 W<br />
T 11 S<br />
T 12 S<br />
T 13 S<br />
T 14 S<br />
R 59 W<br />
R 58 W<br />
R 57 W<br />
4<br />
0 3 6 12<br />
Miles
Figure 2.4 Histogram of Well Depths by Producing Aquifer
Figure 3.1a Piper Diagram of Alluvial Wells and Surface <strong>Water</strong> Samples 1<br />
1 Location of wells shown in Figure 2.2
Figure 3.1b Piper Diagram for Wells in the Denver and Dawson Aquifers<br />
1 Location of wells shown in Figure 2.2
Figure 3.1c Piper Diagram for Wells in the Arapahoe and Laramie-Fox Hills Aquifer<br />
1 Location of wells shown in Figure 2.2
Figure 3.1d Piper Diagram for Produced <strong>Water</strong> from Gas Wells<br />
1 Location of wells shown in Figure 2.2
T 4 S<br />
T 5 S<br />
T 6 S<br />
T 7 S<br />
T 8 S<br />
T 9 S<br />
T 10 S<br />
!<br />
! !!<br />
! !!<br />
!(<br />
!(<br />
!(!(!(<br />
!(<br />
!(!(!( !( !(<br />
! !!!! !(<br />
!(<br />
!(<br />
!(<br />
!( !(<br />
!(<br />
!(<br />
!(<br />
!(!(<br />
!(<br />
!(<br />
!(<br />
!( !(<br />
R 65 W<br />
!( !( !(<br />
!(<br />
!(<br />
!(<br />
!(<br />
!(<br />
Geochemical Signature<br />
Major <strong>Water</strong> Type<br />
!( Ca-HCO3<br />
!( Na-HCO3<br />
!( Ca-Cl<br />
!( Ca-SO4<br />
!( Na-SO4<br />
!(<br />
!(<br />
!( Na-SO4HCO3<br />
! Area Sampled by COGCC<br />
!(<br />
R 64 W<br />
Detail<br />
Area<br />
!<br />
!(<br />
!(<br />
!! !<br />
!( ! !!! !( !( !(<br />
!(!(!( !( !( !( !(<br />
!(<br />
!(<br />
!(<br />
!(<br />
!(<br />
!(<br />
!<br />
!(<br />
R 63 W<br />
!(!(<br />
!(<br />
!(<br />
!(<br />
!(<br />
!(<br />
!(<br />
!(!(!(!(<br />
!( !(<br />
!(<br />
!(<br />
R 62 W<br />
!(<br />
!(<br />
!( !(<br />
Figure 3.2 Distribution of Geochemical Signatures<br />
!(!(!(<br />
!(<br />
! !(<br />
! !(<br />
!(<br />
! !! ! !<br />
!<br />
! !(<br />
!<br />
!( !(<br />
!( !(<br />
!(<br />
!(<br />
!(<br />
!(<br />
R 65 W<br />
!(<br />
!(<br />
!(<br />
!(<br />
!(<br />
R 61 W<br />
!(<br />
!(<br />
!(<br />
T 5 S<br />
!(<br />
T 6 S<br />
!(<br />
!(<br />
!(<br />
!(<br />
R 60 W<br />
!(<br />
T 11 S<br />
T 12 S<br />
T 13 S<br />
T 14 S<br />
!(<br />
!(<br />
!(<br />
R 64 W<br />
! ! ! ! !(<br />
!( !(<br />
!(<br />
!(<br />
!(<br />
!( !(<br />
!( !(<br />
!(<br />
R 59 W<br />
!(<br />
R 58 W<br />
!(<br />
R 57 W<br />
4<br />
0 3 6 12<br />
Miles<br />
!(
T 4 S<br />
T 5 S<br />
T 6 S<br />
T 7 S<br />
T 8 S<br />
T 9 S<br />
T 10 S<br />
R 65 W<br />
!<br />
! !!<br />
! !! ! !!!!<br />
Total Dissolved Solids<br />
(mg/L)<br />
75 - 100<br />
100 - 250<br />
250 - 500<br />
500 - 1,000<br />
> 1,000<br />
! Area Sampled by COGCC<br />
R 64 W<br />
Detail<br />
Area<br />
!<br />
T 7 S<br />
!! !<br />
! !!!<br />
Figure 3.3a Distribution of Total Dissolved Solids (TDS)<br />
!<br />
R 63 W<br />
!<br />
!<br />
R 62 W<br />
R 65 W<br />
! !! ! !<br />
!<br />
!<br />
!<br />
R 61 W<br />
T 5 S<br />
T 6 S<br />
R 60 W<br />
T 11 S<br />
T 12 S<br />
T 13 S<br />
T 14 S<br />
R 64 W<br />
! ! ! !<br />
R 59 W<br />
R 58 W<br />
R 57 W<br />
4<br />
0 3 6 12<br />
Miles
T 4 S<br />
T 5 S<br />
T 6 S<br />
T 7 S<br />
T 8 S<br />
T 9 S<br />
T 10 S<br />
R 65 W<br />
!<br />
! !!<br />
! !! ! !!!!<br />
Sulfate<br />
(mg/L)<br />
0 - 125<br />
125 - 250<br />
250 - 500<br />
500 - 1,000<br />
> 1,000<br />
! Area Sampled by COGCC<br />
R 64 W<br />
Detail<br />
Area<br />
!<br />
!! !<br />
! !!!<br />
!<br />
Figure 3.3b Distribution of Sulfate<br />
R 63 W<br />
!<br />
!<br />
R 62 W<br />
R 65 W<br />
! !! ! !<br />
!<br />
!<br />
!<br />
R 61 W<br />
T 5 S<br />
T 6 S<br />
R 60 W<br />
T 11 S<br />
T 12 S<br />
T 13 S<br />
T 14 S<br />
R 64 W<br />
! ! ! !<br />
R 59 W<br />
R 58 W<br />
R 57 W<br />
4<br />
0 3 6 12<br />
Miles
T 4 S<br />
T 5 S<br />
T 6 S<br />
T 7 S<br />
T 8 S<br />
T 9 S<br />
T 10 S<br />
Manganese<br />
(mg/L)<br />
0 - 0.01<br />
0.01 - 0.05<br />
0.05 - 0.5<br />
0.5 - 1.0<br />
R 65 W<br />
!<br />
! !!<br />
! !! ! !!!!<br />
> 1.0<br />
! Area Sampled by COGCC<br />
R 64 W<br />
Detail<br />
Area<br />
!<br />
!! !<br />
! !!!<br />
!<br />
R 63 W<br />
!<br />
Figure 3.3c Distribution of Manganese<br />
!<br />
R 62 W<br />
R 65 W<br />
! !! ! !<br />
!<br />
!<br />
!<br />
R 61 W<br />
T 5 S<br />
T 6 S<br />
R 60 W<br />
T 11 S<br />
T 12 S<br />
T 13 S<br />
T 14 S<br />
R 64 W<br />
! ! ! !<br />
R 59 W<br />
R 58 W<br />
R 57 W<br />
4<br />
0 3 6 12<br />
Miles
Iron<br />
(mg/L)<br />
T 4 S<br />
T 5 S<br />
T 6 S<br />
T 7 S<br />
T 8 S<br />
T 9 S<br />
T 10 S<br />
0.0 - 0.1<br />
0.2 - 0.3<br />
0.4 - 0.6<br />
0.7 - 1.2<br />
R 65 W<br />
!<br />
! !!<br />
! !! ! !!!!<br />
1.3 - 17.7<br />
! Area Sampled by COGCC<br />
R 64 W<br />
Detail<br />
Area<br />
!<br />
!! !<br />
! !!!<br />
Figure 3.3d Distribution of Iron<br />
!<br />
R 63 W<br />
!<br />
!<br />
R 62 W<br />
R 65 W<br />
! !! ! !<br />
!<br />
!<br />
!<br />
R 61 W<br />
T 5 S<br />
T 6 S<br />
R 60 W<br />
T 11 S<br />
T 12 S<br />
T 13 S<br />
T 14 S<br />
R 64 W<br />
! ! ! !<br />
R 59 W<br />
R 58 W<br />
R 57 W<br />
4<br />
0 3 6 12<br />
Miles
Figure 3.4a Plots of TDS versus Major Cations (Sodium, Calcium, Magnesium, and Potassium)
Figure 3.4b Plot of TDS versus Major Anions (Bicarbonate, Sulfate, and Chloride)
Figure 3.4c Plot of Sodium versus Chloride and Sulfate
T 4 S<br />
T 5 S<br />
T 6 S<br />
T 7 S<br />
T 8 S<br />
T 9 S<br />
T 10 S<br />
R 65 W<br />
!<br />
! !!<br />
! !!<br />
?? ? ?<br />
?? ! !!!!<br />
?<br />
??<br />
Methane<br />
(mg/L)<br />
< 1<br />
1 - 7<br />
> 7<br />
? Non Detect<br />
! Area Sampled by COGCC<br />
R 64 W<br />
Detail<br />
Area<br />
!<br />
T 7 S<br />
!! !<br />
! !!!<br />
!<br />
Figure 3.5 Distribution of Methane<br />
R 63 W<br />
!<br />
!<br />
R 62 W<br />
R 65 W<br />
! !! ! !<br />
!<br />
! ?<br />
!<br />
? ?<br />
?<br />
?<br />
?<br />
? ?<br />
R 61 W<br />
T 5 S<br />
T 6 S<br />
R 60 W<br />
T 11 S<br />
T 12 S<br />
T 13 S<br />
T 14 S<br />
R 64 W<br />
! ! ! !<br />
R 59 W<br />
R 58 W<br />
R 63 W<br />
R 57 W<br />
4<br />
0 3 6 12<br />
Miles
3 C of Methane<br />
1<br />
0.00<br />
-20.00<br />
-40.00<br />
-60.00<br />
-80.00<br />
Domestic Well<br />
Sample<br />
Biogenic<br />
Fermentation<br />
Oxidation<br />
Pathway<br />
Thermogenic<br />
-100.00<br />
-450.0 -400.0 -350.0 -300.0 -250.0 -200.0 -150.0 -100.0 -50.0 0.0<br />
D of Methane<br />
Biogenic<br />
Carbonate Reduction<br />
Figure 3.6 Carbon and Hydrogen Isotopes of Methane for Domestic Wells (adapted from Whiticar, 1990)
Tables
Well ID<br />
Sample Date<br />
and Time<br />
Sodium<br />
(mg/L)<br />
Table 3.1<br />
<strong>Water</strong> <strong>Quality</strong> Results: Ions, pH and Total Dissolved Solids<br />
Calcium<br />
(mg/L)<br />
Magnesium<br />
(mg/L)<br />
Potassium<br />
(mg/L)<br />
Chloride<br />
(mg/L)<br />
Sulfate<br />
(mg/L)<br />
Nitrate<br />
Nitrite<br />
(mg/L as<br />
N)<br />
Bicarbonate<br />
(mg/L as<br />
CaCO3)<br />
Flouride<br />
(mg/L)<br />
NOTES: < = Less than, B = compound found in blank and sample, J = result is less than the RL but greater than or equal to the MDL-approximate value shown<br />
pH<br />
Total<br />
Dissolved<br />
Solids<br />
(mg/L)<br />
WATERTYPE<br />
MCL/CO Human Health Standard 10 4<br />
<strong>Colorado</strong> Drinking <strong>Water</strong> Standard 250 250 6.5-8.5<br />
ALLEN 1 5/6/11 11:15 67 24 2.6 4.1 8.5 0.53 < 0.019 210 0.95 8.05 240 Na-HCO3<br />
BAKER 1 5/5/11 10:40 68 53 4.6 5.5 39 150 0.065 140 0.45 7.97 410 Na-SO4<br />
BOYD 1 1/18/11 12:10 10 46 5.3 2.9 8.7 21 2.5 130 0.34 7.09 210 Ca-HCO3<br />
CASWELL 1 6/7/11 14:20 55 32 2.8 4.7 13 25 < 0.019 160 0.59 8.16 Na-HCO3<br />
CORSI 1 5/5/11 12:35 81 95 7.8 7.6 41 270 0.12 160 0.38 7.60 610 Ca-SO4<br />
DICCIARDELLO 1 1/12/11 15:00 8.8 29 2.6 2.8 3.1 8.7 0.29 100 0.4 7.01 160 Ca-HCO3<br />
DORMAN 1 1/12/11 12:10 8.6 31 3.6 2.3 3.6 9.3 0.88 100 0.42 7.09 200 Ca-HCO3<br />
EDWARDS 1 5/6/11 12:10 56 42 3.7 4.7 42 94 < 0.019 110 0.47 8.11 320 Na-SO4<br />
EDWARDS II 5/6/11 12:50 55 45 3.7 5.2 30 99 < 0.019 130 0.49 8.10 320 Na-HCO3<br />
FENNEL 1 5/6/11 9:50 18 52 4.8 2.8 6.9 21 0.82 170 0.77 7.08 250 Ca-HCO3<br />
HAMPTON 1 1/12/11 10:05 7.2 27 4.2 1.7 3.1 5.1 0.79 100 0.3 7.11 150 Ca-HCO3<br />
HARPERWW 12/22/10 12:50 9.6 31 2.8 3.5 3.8 0.71 98 < 0.06 7.25 170 -- Censored --<br />
HATTON 1 1/12/11 13:15 12 30 2.6 3.5 3 9.6 < 0.019 110 0.4 7.22 170 Ca-HCO3<br />
HINDS 1 5/5/11 11:30 67 51 4.6 5.4 42 120 0.46 130 0.49 7.91 380 Na-SO4<br />
IRELAND 1 1/18/11 13:42 7.2 28 3.7 2 3.8 7.2 1.3 90 0.36 7.14 140 Ca-HCO3<br />
JACOBS 1 1/12/11 14:10 8.6 33 4.2 2.3 3.5 7.8 1.1 110 0.43 7.06 160 Ca-HCO3<br />
KNIGHT 1 1/12/11 11:10 12 24 1.9 3.5 3.3 13 < 0.019 83 0.4 7.26 140 Ca-HCO3<br />
KREUTZER 1 1/12/11 15:45 9.2 28 2.3 3 3.4 7.4 0.73 92 0.37 7.08 140 Ca-HCO3<br />
LUKE 1 5/5/11 13:20 77 43 4 5.4 26 110 < 0.019 160 0.69 7.95 360 Na-SO4HCO3<br />
PETTINGER 1 5/5/11 14:50 66 51 4.1 5.6 33 130 < 0.019 130 0.47 8.03 380 Na-SO4<br />
PURVIS 1 5/5/11 9:45 78 35 3.5 4.7 15 55 < 0.019 210 0.92 8.03 320 Na-HCO3<br />
SKOGLUND 1 5/5/11 14:05 78 46 4.1 5.1 23 97 < 0.019 190 0.77 8.02 370 Na-HCO3<br />
VAILWW 10/29/10 10:50 9 31 3.1 0.6 7.15 160 -- Censored --<br />
Weimer 11/14/02 0:00 0.11 0.16 0.027 27.5 534 < 0.056 0.57 1150 -- Censored --<br />
Zlatev <strong>Water</strong> Well 10/13/11 14:06 9.2 30 3.5 2.3 J 4.4 9.2 0.99 B 0.37 J 7.02 160 B -- Censored --<br />
06758700 9/29/75 13:05 160 140 79 7.5 65 640 3.3 294 1.1 8.30 1270<br />
- Surface <strong>Water</strong><br />
-<br />
390316103563801 10/4/78 16:00 6.6 18 4.8 2 1.9 9.4 1.2 78 0.3 6.20 114 Ca-HCO3<br />
390747104424101 5/6/77 10:00 6.4 13 3 3.3 3.1 18 0.06 48 0.1 6.40 98 Ca-HCO3<br />
390748104423600 3/13/73 0:00 8.2 21 3.6 1.8 13 13 5.1 48 0.1 7.10 139 Ca-HCO3<br />
390817104040301 9/21/78 12:20 49 3.4 0.4 0.9 1.6 16 0.26 120 0.5 7.40 150 Na-HCO3
Well ID<br />
Sample Date<br />
and Time<br />
Sodium<br />
(mg/L)<br />
Table 3.1, continued<br />
<strong>Water</strong> <strong>Quality</strong> Results: Ions, pH and Total Dissolved Solids<br />
Calcium<br />
(mg/L)<br />
Magnesium<br />
(mg/L)<br />
Potassium<br />
(mg/L)<br />
Chloride<br />
(mg/L)<br />
Sulfate<br />
(mg/L)<br />
Nitrate<br />
Nitrite<br />
(mg/L as<br />
N)<br />
Bicarbonate<br />
(mg/L as<br />
CaCO3)<br />
Flouride<br />
(mg/L)<br />
NOTES: < = Less than, B = compound found in blank and sample, J = result is less than the RL but greater than or equal to the MDL-approximate value shown<br />
pH<br />
Total<br />
Dissolved<br />
Solids<br />
(mg/L)<br />
WATERTYPE<br />
390821104402901 5/3/77 11:30 14 37 5.4 11 16 25 13 71 0.2 6.50 233 Ca-Cl<br />
390917104154201 5/17/82 13:00 210 18 1.9 2.5 10 290 0.171 268 1.9 8.40 676 Na-SO4<br />
390926104403200 2/17/77 15:30 8.4 23 5.2 3.6 6.7 7.1 1.5 92 0.1 6.50 134 Ca-HCO3<br />
391006104404201 5/5/77 16:00 27 32 6.1 1.9 16 37 0.88 110 0.5 6.90 209 Ca-HCO3<br />
391007103514501 9/21/78 11:35 21 25 4.9 3.1 1.7 18 0.57 130 0.6 7.50 164 Ca-HCO3<br />
391008104421800 11/24/76 12:30 13 34 7.8 12 13 22 0.08 134 0.2 6.60 191 Ca-HCO3<br />
391012104421600 11/24/76 13:00 8.9 25 5.1 3.2 4.7 19 0.01 100 0.2 6.00 145 Ca-HCO3<br />
391028104310701 10/13/78 14:10 7 20 2.4 1.9 2.2 4.7 0.37 85 0.4 6.70 120 Ca-HCO3<br />
391030104374901 10/4/78 10:45 5.3 15 2.7 1.5 2.2 5.3 1 61 0.4 5.80 100 Ca-HCO3<br />
391135104211601 10/4/78 13:00 150 6.6 0.6 2 21 40 0.01 330 2.7 6.90 397 Na-HCO3<br />
391148104294101 12/8/04 10:45 6.24 20.7 3.11 1.52 2.49 6.33 1.25 77 0.32 7.60 126 Ca-HCO3<br />
391204104430000 2/10/77 11:30 4.7 8.4 1.3 0.8 1.4 11 2.4 20 0.1 6.10 75 Ca-HCO3<br />
391234104065201 9/21/78 12:50 350 110 19 5.9 2.5 1000 0.01 160 0.3 7.40 1580 Na-SO4<br />
391253104430000 2/9/77 14:30 19 31 4.6 1.4 8.9 16 0.52 127 0.4 6.90 185 Ca-HCO3<br />
391300104142801 9/21/78 9:00 200 5 0.6 1.4 3.3 220 0.49 230 0.8 8.70 561 Na-SO4<br />
391318104322501 10/4/78 11:35 5.7 15 2.6 1.4 2.5 3.9 1.3 65 0.3 6.00 105 Ca-HCO3<br />
391440104415200 2/10/77 10:00 6.9 21 3.9 2 3.5 8.3 3.1 71 0.3 6.90 129 Ca-HCO3<br />
391441104403600 2/11/77 11:15 8.8 27 4.6 1.5 9.1 17 2.5 82 0.3 6.60 158 Ca-HCO3<br />
391449104404000 2/11/77 12:15 5.5 21 3.8 1.9 5.7 10 2.4 66 0.3 6.50 132 Ca-HCO3<br />
391545104335401 11/22/04 9:50 6.89 23.8 3.31 1.89 2.44 6.31 0.762 93 0.43 7.60 132 Ca-HCO3<br />
391606104392701 12/1/04 10:30 7.25 20.3 3.2 2.06 1.91 7.32 0.886 86 0.39 6.40 118.5 Ca-HCO3<br />
391622104092201 9/21/78 9:35 240 13 1.2 1.9 3.4 400 0.79 180 0.6 8.10 762 Na-SO4<br />
391648104280201 9/18/78 11:10 8.5 25 3.2 1.7 3.6 7.9 0.77 100 0.4 7.40 136 Ca-HCO3<br />
391705104412301 10/13/78 10:20 9.3 30 4.6 2.7 5.9 9 2.5 100 0.5 6.10 158 Ca-HCO3<br />
391719104072301 9/21/78 10:05 95 190 31 7.3 11 580 0.02 280 0.7 7.50 1070 Ca-SO4<br />
391737104185901 9/18/78 9:45 140 5 0.4 1.3 8.2 64 0.07 270 1.7 8.60 369 Na-HCO3<br />
391740104072401 7/14/05 11:30 74.5 199 38 6.97 5.67 655 0.028 166 1.12 7.10 1135 Ca-SO4<br />
391825104272101 9/28/05 13:00 59.4 8.1 0.47 1.83 2.41 15.6 0.03 168 0.97 7.50 174.5 Na-HCO3<br />
391848104261401 12/14/04 12:00 8.32 31.4 5.88 2.03 4.49 11.5 0.77 123 0.4 6.50 172.5 Ca-HCO3<br />
391851104204501 12/29/05 11:50 151 6.24 0.638 1.56 7.37 124 0.03 255 1.63 8.50 445.5 Na-HCO3<br />
391852104391301 11/17/04 9:50 21.4 16.2 1.16 2.76 1.63 9.17 0.068 96 0.53 7.10 137 Na-HCO3<br />
391930104324901 9/18/78 12:00 6.2 24 3.8 1.1 2.1 11 1.7 87 0.5 7.60 137 Ca-HCO3
Well ID<br />
Sample Date<br />
and Time<br />
Sodium<br />
(mg/L)<br />
Table 3.1, continued<br />
<strong>Water</strong> <strong>Quality</strong> Results: Ions, pH and Total Dissolved Solids<br />
Calcium<br />
(mg/L)<br />
Magnesium<br />
(mg/L)<br />
Potassium<br />
(mg/L)<br />
Chloride<br />
(mg/L)<br />
Sulfate<br />
(mg/L)<br />
Nitrate<br />
Nitrite<br />
(mg/L as<br />
N)<br />
Bicarbonate<br />
(mg/L as<br />
CaCO3)<br />
Flouride<br />
(mg/L)<br />
NOTES: < = Less than, B = compound found in blank and sample, J = result is less than the RL but greater than or equal to the MDL-approximate value shown<br />
pH<br />
Total<br />
Dissolved<br />
Solids<br />
(mg/L)<br />
WATERTYPE<br />
391938104123301 5/18/82 9:25 100 100 8.1 7.4 6.1 330 0.165 183 0.5 7.10 659 Ca-SO4<br />
392045104184601 5/18/82 10:55 160 22 2 3.2 6.8 250 0.022 293 0.9 8.30 602 Na-SO4<br />
392050104415000 11/2/76 14:30 8.3 24 3.2 2.4 2.8 10 0.2 99 0.4 6.90 140 Ca-HCO3<br />
392053104181301 9/18/78 9:15 190 13 1.3 2.6 13 180 0.59 280 1 8.20 552 Na-HCO3<br />
392107104430400 11/4/76 9:30 10 25 3.3 3.2 3.9 9.3 0.2 110 0.4 6.90 150 Ca-HCO3<br />
392118104362301 12/27/05 11:00 70.4 2.33 0.408 1.53 1.64 10.5 0.03 168 1.63 7.80 191.5 Na-HCO3<br />
392119104362401 3/11/03 13:00 15 19.5 1.07 2.86 1.42 7.51 0.461 92 0.39 7.50 138.5 Ca-HCO3<br />
392130104251201 9/18/78 10:10 9 27 3.4 2.7 3.7 10 0.65 100 0.5 7.70 143 Ca-HCO3<br />
392244104143201 10/9/78 14:00 110 310 29 9.4 12 880 0.01 200 0.4 7.20 1470 Ca-SO4<br />
392254104305601 12/14/04 12:05 24.5 29 1.46 4.02 2.94 16.8 0.03 173 0.43 6.80 193 Ca-HCO3<br />
392400104150601 7/14/05 15:30 273 66.7 6.3 4.73 4.15 599 0.03 198 0.44 7.50 1075 Na-SO4<br />
392440104420901 6/29/77 15:30 18 58 7.8 2.6 13 46 2.8 160 0.5 7.10 271 Ca-HCO3<br />
392451104205401 10/9/78 14:40 110 12 1.3 3.1 7.7 12 0.02 320 1.9 8.00 316 Na-HCO3<br />
392453104194101 5/18/82 14:00 140 46 7.2 3.2 8.7 170 0.179 317 1.5 7.60 544 Na-HCO3<br />
392528104330601 9/18/78 13:05 13 26 5.3 1.5 5.4 17 1.7 110 0.6 7.50 159 Ca-HCO3<br />
392559104415201 8/25/05 14:00 60 17.3 1.72 2.98 3.08 20.8 0.03 176 1.75 8.20 209.5 Na-HCO3<br />
392616104260601 11/17/04 13:30 50.3 19.9 1.62 3.71 3.69 21.3 0.03 175 1.36 6.90 205.5 Na-HCO3<br />
392635104181901 5/18/82 14:20 200 89 8.7 5.1 9.6 510 0.89 256 0.8 7.90 964 Na-SO4<br />
392639104403001 9/18/78 13:45 5.4 26 3.5 2 2.2 5.5 0.71 100 0.3 7.60 134 Ca-HCO3<br />
392640104040501 10/9/78 13:10 130 1.5 0.1 0.7 15 20 0.36 240 0.9 8.80 324 Na-HCO3<br />
392727104385201 12/28/04 9:50 9.74 36.4 7.06 1.87 3.28 15.4 5.57 117 0.4 7.70 191.5 Ca-HCO3<br />
392741104343101 11/16/04 10:00 28.5 14.3 1.07 3.01 1.66 19.7 0.032 92 0.74 7.60 147.5 Na-HCO3<br />
392743104210901 4/14/77 11:30 140 7.8 1.3 2 7.6 81 0.05 260 1.2 8.50 385 Na-HCO3<br />
392743104210901 5/5/77 13:45 130 7.8 0.8 2.3 12 67 0.02 270 1.5 8.40 364 Na-HCO3<br />
392743104210901 6/30/77 11:15 130 7.9 0.9 2 7.6 77 0.07 270 1.3 8.40 370 Na-HCO3<br />
392743104210901 10/18/77 11:15 130 8.7 1 2 7.4 80 0.4 270 0.5 8.10 383 Na-HCO3<br />
392903104260501 9/19/78 11:45 70 110 6.3 9.5 15 280 0.32 170 0.8 7.40 600 Ca-SO4<br />
392903104260501 5/12/82 9:47 9.4 130 9.1 2.9 14 310 0.048 66 1.5 7.90 513 Ca-SO4<br />
392920104151001 10/9/78 17:15 170 350 86 8.6 8.2 1300 13 300 1.5 8.20 2140 Ca-SO4<br />
393104104392501 9/18/78 14:50 12 30 2.7 3.5 3.7 12 0.11 120 0.5 6.80 164 Ca-HCO3<br />
393156104415501 8/24/64 0:00 13 37 2.4 3.3 5 10 0.09 147 0.2 7.30 182 Ca-HCO3
Well ID<br />
Sample Date<br />
and Time<br />
Sodium<br />
(mg/L)<br />
Table 3.1, continued<br />
<strong>Water</strong> <strong>Quality</strong> Results: Ions, pH and Total Dissolved Solids<br />
Calcium<br />
(mg/L)<br />
Magnesium<br />
(mg/L)<br />
Potassium<br />
(mg/L)<br />
Chloride<br />
(mg/L)<br />
Sulfate<br />
(mg/L)<br />
Nitrate<br />
Nitrite<br />
(mg/L as<br />
N)<br />
Bicarbonate<br />
(mg/L as<br />
CaCO3)<br />
Flouride<br />
(mg/L)<br />
NOTES: < = Less than, B = compound found in blank and sample, J = result is less than the RL but greater than or equal to the MDL-approximate value shown<br />
pH<br />
Total<br />
Dissolved<br />
Solids<br />
(mg/L)<br />
WATERTYPE<br />
393156104415501 9/14/65 0:00 13 36 4.1 3.2 4.9 17 0.361 142 0.6 7.70 181 Ca-HCO3<br />
393156104415501 8/15/66 0:00 62 0.2 1.8 0.6 5 10 0.497 144 0.5 7.90 187 Na-HCO3<br />
393227104343401 11/8/04 11:00 33.5 67.5 3.93 6.9 5.45 59.7 0.03 216 0.58 7.20 327 Ca-HCO3<br />
393300104411901 12/20/04 17:30 9.09 55.5 4.96 2.74 15.4 40.7 3.98 125 0.35 6.40 253 Ca-HCO3<br />
393326104002001 10/9/78 11:50 260 78 17 5 8.3 540 0.05 300 0.1 7.10 1070 Na-SO4<br />
393353104213901 9/19/78 11:10 63 72 11 4.3 7.5 95 0.21 310 0.9 7.70 422 Ca-HCO3<br />
393358103434200 10/11/01 15:30 158 550 90.9 8.8 13.7 1670 0.095 215 0.21 6.90 2820 Ca-SO4<br />
393445104224201 11/29/05 13:40 130 18.8 1.69 2.99 19.6 74.7 0.03 263 1.24 7.90 389 Na-HCO3<br />
393610104300601 5/12/82 10:46 97 130 13 10 24 430 0.129 195 1.1 7.60 817 Ca-SO4<br />
393617104131101 6/29/05 11:30 211 10.6 0.889 1.65 8.08 288 0.03 208 0.8 8.50 635 Na-SO4<br />
393626104104901 10/9/78 10:15 120 1.2 0.4 0.9 8.8 4 0.45 300 0.8 8.10 299 Na-HCO3
Well ID<br />
Sample Date<br />
and Time<br />
Table 3.2<br />
<strong>Water</strong> <strong>Quality</strong> Results: Drinking <strong>Water</strong> Metals, Halides and Dissolved Methane<br />
Arsenic<br />
(mg/L)<br />
Barium<br />
(mg/L)<br />
Cadmium<br />
(mg/L)<br />
Chromium<br />
(mg/L)<br />
NOTES:<br />
< = Less than, ND = non detect, E = Estimated, B = compound found in blank and sample, M = Presence verified but not quantified, J = result is less than the RL but greater than or equal<br />
to the MDL-approximate value shown<br />
Does not include monitoring wells northeast of I-70 within the area of interest<br />
Iron<br />
(mg/L)<br />
Manganese<br />
(mg/L)<br />
Lead<br />
(mg/L)<br />
Selenium<br />
(mg/L)<br />
MCL/CO Human Health Standard 0.01 2 0.005 0.1 0.05 0.05<br />
<strong>Colorado</strong> Drinking <strong>Water</strong> Standard 0.3 0.05<br />
Bromide<br />
(mg/L)<br />
ALLEN 1 5/6/11 11:15 < 0.0044 0.15 < 0.00045 < 0.00066 < 0.022 0.012 0.0026 J < 0.0049 0.19 J 8.7<br />
BAKER 1 5/5/11 10:40 < 0.0044 0.012 < 0.00045 < 0.00066 0.027 J 0.044 < 0.0026 < 0.0049 0.48 0.0074<br />
Methane<br />
(mg/L)<br />
BOYD 1 1/18/11 12:10 < 0.022 0.0006 JB < 0.0049 < 0.00011 < 0.00022<br />
CASWELL 1 6/7/11 14:20 < 0.0044 0.13 B < 0.00045 < 0.00066 0.042 JB 0.036 < 0.0026 < 0.0049 0.2 0.25<br />
CORSI 1 5/5/11 12:35 < 0.0044 0.011 < 0.00045 < 0.00066 < 0.022 0.0063 J 0.0031 J 0.021 0.48 0.00052 J<br />
DICCIARDELLO 1 1/12/11 15:00 < 0.022 0.0012 JB 0.0067 J < 0.00011 < 0.00022<br />
DORMAN 1 1/12/11 12:10 < 0.022 0.0015 JB < 0.0049 < 0.00011 < 0.00022<br />
EDWARDS 1 5/6/11 12:10 < 0.0044 0.082 < 0.00045 < 0.00066 < 0.022 0.041 < 0.0026 < 0.0049 0.39 0.077<br />
EDWARDS II 5/6/11 12:50 < 0.0044 0.036 < 0.00045 < 0.00066 < 0.022 0.056 < 0.0026 0.0061 J 0.36 0.025<br />
FENNEL 1 5/6/11 9:50 0.0084 J 0.068 < 0.00045 < 0.00066 < 0.022 < 0.00025 < 0.0026 0.0093 J 0.13 J 0.00022 J<br />
HAMPTON 1 1/12/11 10:05 < 0.022 0.0068 JB < 0.0049 < 0.00011 0.00035 JP<br />
HARPERWW 12/22/10 12:50 < 0.0044 0.043 < 0.00045 < 0.00066 < 0.022 < 0.00025 < 0.0026 0.02 < 0.00022<br />
HATTON 1 1/12/11 13:15 0.26 0.057 B < 0.0049 < 0.00011 0.00067 J<br />
HINDS 1 5/5/11 11:30 < 0.0044 0.034 < 0.00045 < 0.00066 < 0.022 < 0.00025 < 0.0026 0.0058 J 0.52 0.011<br />
IRELAND 1 1/18/11 13:42 0.029 J 0.00041 JB < 0.0049 < 0.00011 < 0.00022<br />
JACOBS 1 1/12/11 14:10 < 0.022 0.00061 JB 0.0052 J < 0.00011 < 0.00022<br />
KNIGHT 1 1/12/11 11:10 0.031 J 0.031 B < 0.0049 < 0.00011
Well ID<br />
ZLATEV WATER<br />
WELL<br />
Sample Date<br />
and Time<br />
Table 3.2, continued<br />
<strong>Water</strong> <strong>Quality</strong> Results: Drinking <strong>Water</strong> Metals, Halides and Dissolved Methane<br />
Arsenic<br />
(mg/L)<br />
Barium<br />
(mg/L)<br />
Cadmium<br />
(mg/L)<br />
Chromium<br />
(mg/L)<br />
NOTES:<br />
< = Less than, ND = non detect, E = Estimated, B = compound found in blank and sample, M = Presence verified but not quantified, J = result is less than the RL but greater than or equal<br />
to the MDL-approximate value shown<br />
Does not include monitoring wells northeast of I-70 within the area of interest<br />
Iron<br />
(mg/L)<br />
Manganese<br />
(mg/L)<br />
Lead<br />
(mg/L)<br />
Selenium<br />
(mg/L)<br />
Bromide<br />
(mg/L)<br />
Methane<br />
(mg/L)<br />
0.0089 J 0.039 < 0.00045 < 0.00066 < 0.022 < 0.00025 < 0.0026 0.0057 J < 0.00011 < 0.00022<br />
06758700 9/29/75 13:05 0.03 0.01 <<br />
390316103563801 10/4/78 16:00 1.6 0.03<br />
390747104424101 5/6/77 10:00 0.001 2.6 0.25 0.001 <<br />
390748104423600 3/13/73 0:00 0.05 0.01 <<br />
390807103551101 9/6/79 11:55 0.07 0.03<br />
390817104040301 9/21/78 12:20 0.06 0.02<br />
390821104402901 5/3/77 11:30 0.001 0.03 0.01 < 0.003<br />
390904103525201 9/6/79 13:15 0.02 M<br />
390917104154201 5/17/82 13:00 0.02 0.03 M 0.001<br />
390926104403200 2/17/77 15:30 0.001 0.01 < 0.01 < 0.001 <<br />
390935104301001 12/7/04 15:15 0.0058 0.037 0.00004 < 0.0008 < 0.006 < 0.0002 < 0.0004 0.001 0.04<br />
391006104404201 5/5/77 16:00 0.002 0.08 0.04 0.001 <<br />
391007103514501 9/6/79 15:00 0.01 < M<br />
391007103514501 9/21/78 11:35 0.01 < 0.01 <<br />
391008104421800 11/24/76 12:30 0.002 0.4 0.33 0.001 <<br />
391012104421600 11/24/76 13:00 0.001 2 0.26 0.001 <<br />
391017103534801 9/6/79 10:30 2.3 0.62<br />
391028104310701 10/13/78 14:10 0.01 < M<br />
391030104374901 10/4/78 10:45 0.01 < 0.001 <<br />
391135104211601 10/4/78 13:00 0.16 M<br />
391148104294101 12/8/04 10:45 0.0047 0.029 0.00004 < 0.0008 < 0.006 < 0.0002 E 0.00057 0.0024 0.05<br />
391204104430000 2/10/77 11:30 0.001 0.02 0.01 < 0.002<br />
391234104065201 9/21/78 12:50 0.02 0.36<br />
391253104430000 2/9/77 14:30 0.012 0.26 0.03 0.001<br />
391300104142801 9/21/78 9:00 0.1 0.02
Well ID<br />
Sample Date<br />
and Time<br />
Table 3.2, continued<br />
<strong>Water</strong> <strong>Quality</strong> Results: Drinking <strong>Water</strong> Metals, Halides and Dissolved Methane<br />
Arsenic<br />
(mg/L)<br />
Barium<br />
(mg/L)<br />
Cadmium<br />
(mg/L)<br />
Chromium<br />
(mg/L)<br />
NOTES:<br />
< = Less than, ND = non detect, E = Estimated, B = compound found in blank and sample, M = Presence verified but not quantified, J = result is less than the RL but greater than or equal<br />
to the MDL-approximate value shown<br />
Does not include monitoring wells northeast of I-70 within the area of interest<br />
Iron<br />
(mg/L)<br />
Manganese<br />
(mg/L)<br />
391318104322501 10/4/78 11:35 0.02 M<br />
Lead<br />
(mg/L)<br />
Selenium<br />
(mg/L)<br />
391440104415200 2/10/77 10:00 0.002 0.04 0.01 < 0.002<br />
391441104403600 2/11/77 11:15 0.001 0.04 0.01 < 0.002<br />
391449104404000 2/11/77 12:15 0.001 0.02 0.01 < 0.002<br />
391545104335401 11/22/04 9:50 0.0048 0.031 0.00003 E 0.0008 < 0.006 < 0.0002 < 0.00058 0.0013 0.06<br />
391558104193601 8/20/79 12:00 0.08 M<br />
391606104392701 12/1/04 10:30 0.004 0.035 0.00004 < 0.0008 < 0.006 < 0.0002 < 0.00032 0.0014 0.06<br />
391622104092201 9/21/78 9:35 0.16 0.04<br />
391648104280201 9/18/78 11:10 0.03 0.01 <<br />
391705104412301 10/13/78 10:20 0.03 0.01 <<br />
391719104072301 9/21/78 10:05 2.8 0.75<br />
391737104185901 9/18/78 9:45 0.13 0.02<br />
391738104185801 8/20/79 14:00 0.07 0.01 <<br />
391740104072401 7/14/05 11:30 0.0002 < 0.01 0.00004 < 0.0008 < 4.1 0.868 0.00039 0.0003 E 0.05<br />
391740104143201 8/20/79 3:30 0.67 0.12<br />
391822104212501 8/20/79 10:30 1 0.37<br />
391825104272101 9/28/05 13:00 0.00009 E 0.043 0.00004 < 0.00006 0.043 0.0185 0.00062 0.00008 < 0.05<br />
391834104205601 7/1/05 11:00 0.0001 E 0.032 0.00004 < 0.0008 < 0.032 0.0086 0.00008 < 0.0003 E 0.15<br />
391848104261401 12/14/04 12:00 0.0061 0.048 0.00004 < 0.0008 < 0.003 E 0.0002 < 0.00022 0.0037 0.09<br />
391851104204501 12/29/05 11:50 0.00012 < 0.079 0.00002 E 0.00004 0.027 0.0125 0.00008 < 0.00008 < 0.14<br />
391852104391301 11/17/04 9:50 0.0027 0.017 0.00004 < 0.0008 < 0.128 0.021 0.00008 E 0.0011 0.07<br />
391930104324901 9/18/78 12:00 0.04 0.01 <<br />
391938104123301 5/18/82 9:25 0.02 0.11 0.002 < 0.001 <<br />
392021104280000 1/25/01 11:50 0.002 < 0.0404 0.00004 < 0.001 < 0.119 0.0199 0.001 < 0.0004 <<br />
392031104121801 5/18/82 10:10 0.09 0.16 0.002 < 0.001 <<br />
392045104184601 5/18/82 10:55 0.03 0.06 0.002 < 0.001 <<br />
Bromide<br />
(mg/L)<br />
Methane<br />
(mg/L)
Well ID<br />
Sample Date<br />
and Time<br />
Table 3.2, continued<br />
<strong>Water</strong> <strong>Quality</strong> Results: Drinking <strong>Water</strong> Metals, Halides and Dissolved Methane<br />
Arsenic<br />
(mg/L)<br />
Barium<br />
(mg/L)<br />
Cadmium<br />
(mg/L)<br />
Chromium<br />
(mg/L)<br />
NOTES:<br />
< = Less than, ND = non detect, E = Estimated, B = compound found in blank and sample, M = Presence verified but not quantified, J = result is less than the RL but greater than or equal<br />
to the MDL-approximate value shown<br />
Does not include monitoring wells northeast of I-70 within the area of interest<br />
Iron<br />
(mg/L)<br />
Manganese<br />
(mg/L)<br />
Lead<br />
(mg/L)<br />
Selenium<br />
(mg/L)<br />
392050104415000 11/2/76 14:30 0.005 0.05 0.01 < 0.001<br />
392053104181301 9/18/78 9:15 0.05 0.01 <<br />
392055104181201 8/21/79 13:30 0.06 0.02<br />
392107104430400 11/4/76 9:30 0.003 0.06 0.06 0.001<br />
392118104362301 12/27/05 11:00 0.00012 < 0.037 0.00004 < 0.00003 E 0.03 0.0109 0.00071 0.00008 < 0.04<br />
392119104362401 3/11/03 13:00 0.0069 0.029 0.00004 < 0.0008 < 0.01 < 0.0012 0.00004 E 0.0029 0.02<br />
392130104195001 8/21/79 10:30 0.02 0.03<br />
392130104251201 9/18/78 10:10 0.02 0.01 <<br />
392244104143201 10/9/78 14:00 1.3 0.34<br />
392254104305601 12/14/04 12:05 0.0056 0.06 0.00004 < 0.0008 < 0.006 < 0.0501 0.00014 0.0002 E 0.06<br />
392400104150601 7/14/05 15:30 0.0002 < 0.021 0.00004 < 0.0008 < 0.418 0.113 0.00008 < 0.0004 E 0.06<br />
392440104420901 6/29/77 15:30 0.006 0.09 0.07 0.003<br />
392451104205401 10/9/78 14:40 0.14 0.02<br />
392451104205401 5/18/82 14:45 0.08 0.04 0.005 < 0.001 <<br />
392453104194101 5/18/82 14:00 0.05 0.07 0.002 < 0.001 <<br />
392528104330601 9/18/78 13:05 0.05 0.01 <<br />
392559104415201 8/25/05 14:00 0.0002 < 0.071 0.00004 < 0.0008 < 0.264 0.0165 0.00008 < 0.0004 < 0.24<br />
392616104260601 11/17/04 13:30 0.0007 0.039 0.00004 < 0.0008 < 0.006 < 0.0269 0.0002 0.0004 < 0.13<br />
392635104181901 5/18/82 14:20 0.04 0.11 0.001 < 0.001<br />
392639104403001 9/18/78 13:45 0.03 0.01 <<br />
392640104040501 10/9/78 13:10 0.02 0.01 <<br />
392727104385201 12/28/04 9:50 0.0071 0.058 0.00004 < 0.0008 < 0.006 < 0.0002 < 0.00052 0.0025 0.09<br />
392741104343101 11/16/04 10:00 0.0013 0.055 0.00004 < 0.0008 < 0.01 0.0265 0.00098 0.0004 < 0.04<br />
392743104210901 4/14/77 11:30 0.001 < 0.05 0.02 0.001 <<br />
392743104210901 5/5/77 13:45 0.11 0.02<br />
392743104210901 6/30/77 11:15 0.001 < 0.23 0.02 0.001<br />
Bromide<br />
(mg/L)<br />
Methane<br />
(mg/L)
Well ID<br />
Sample Date<br />
and Time<br />
Table 3.2, continued<br />
<strong>Water</strong> <strong>Quality</strong> Results: Drinking <strong>Water</strong> Metals, Halides and Dissolved Methane<br />
Arsenic<br />
(mg/L)<br />
Barium<br />
(mg/L)<br />
Cadmium<br />
(mg/L)<br />
Chromium<br />
(mg/L)<br />
NOTES:<br />
< = Less than, ND = non detect, E = Estimated, B = compound found in blank and sample, M = Presence verified but not quantified, J = result is less than the RL but greater than or equal<br />
to the MDL-approximate value shown<br />
Does not include monitoring wells northeast of I-70 within the area of interest<br />
Iron<br />
(mg/L)<br />
Manganese<br />
(mg/L)<br />
Lead<br />
(mg/L)<br />
Selenium<br />
(mg/L)<br />
392743104210901 10/18/77 11:15 0.001 < 0.16 0.02 0.001 <<br />
392903104260501 9/19/78 11:45 0.04 0.02<br />
392903104260501 5/12/82 9:47 0.02 0.05 0.001 < 0.06<br />
392920104151001 10/9/78 17:15 0.09 0.21<br />
393104104392501 9/18/78 14:50 0.08 0.02<br />
393156104415501 0.12<br />
393227104343401 11/8/04 11:00 0.0107 0.047 0.00004 < 0.0008 < 0.009 0.0367 0.00063 0.0002 E 0.09<br />
393300104411901 12/20/04 17:30 0.0053 0.081 0.00004 < 0.0011 0.006 < 0.0002 < 0.00017 0.003 0.16<br />
393326104002001 10/9/78 11:50 0.04 0.05<br />
393353104213901 9/19/78 11:10 0.06 0.04<br />
393445104224201 11/29/05 13:40 0.00012 < 0.05 0.00004 < 0.00003 E 0.03 0.0183 0.00005 E 0.00008 < 0.29<br />
393610104300601 5/12/82 10:46 0.44 0.18 0.001 < 0.001<br />
393617104131101 6/29/05 11:30 0.0002 < 0.048 0.00004 < 0.0008 < 0.05 0.0293 0.00008 < 0.0002 E 0.13<br />
393626104104901 10/9/78 10:15 0.06 0.01 <<br />
Bromide<br />
(mg/L)<br />
Methane<br />
(mg/L)
Table 3.3<br />
Summary of Gas Compostion and Stable Isotope Analyses<br />
Allen-1 Purvis-1 Skoglund-1<br />
Sample Date 12/5/2011 12/5/2011 12/5/2011<br />
Sample Time 11:20 12:09 12:45<br />
Specific Gravity 0.860 0.863 0.980<br />
BTU 301 295 41<br />
Helium dilution factor * 0.58 0.65 0.77<br />
MS Date 1/6/2012 1/6/2012 1/11/2012<br />
H2S na na na<br />
He na na na<br />
H2 nd nd nd<br />
Ar 1.05 1.14 1.66<br />
O2 5.83 5.17 13.72<br />
CO2 0.58 0.71 0.72<br />
N2 62.80 63.84 79.87<br />
CO nd nd nd<br />
C1 29.73 29.12 4.03<br />
d 13 C1 ‐89.12 -88.88 -86.3<br />
dDC1 ‐331.4 -334.0 -319<br />
C2 0.0148 0.0179 0.0022<br />
C2H4 nd nd nd<br />
C3 nd 0.0003 nd<br />
C3H6 nd nd nd<br />
iC4 nd nd nd<br />
nC4 nd nd nd<br />
iC5 nd nd nd<br />
nC5 nd nd nd<br />
C6+ nd nd 0.0013<br />
Analysis is of gas extracted from water by headspace equilibration. Analysis has been<br />
corrected for helium added to create headspace.<br />
Addition of helium negates the ability to detect native helium and may negate the ability to<br />
detect hydrogen.<br />
nd = not detected, na = not analyzed<br />
** Isotopes obtained online via GC‐C‐IRMS/GC‐P‐IRMS
Appendix
SITE ID Site Name<br />
Appendix A<br />
Sample Location Information<br />
Township<br />
Range<br />
Section<br />
<strong>County</strong> Data Source<br />
ALLEN 1 ALLEN 1 6 S 64 W 2 <strong>Elbert</strong> COGCC GW 460 Denver N<br />
BAKER 1 BAKER 1 6 S 64 W 2 <strong>Elbert</strong> COGCC GW 418 Denver N<br />
BOYD 1 BOYD 1 6 S 65 W 27 <strong>Elbert</strong> COGCC GW 340 Dawson N<br />
CASWELL 1 CASWELL 1 6 S 64 W 2 <strong>Elbert</strong> COGCC GW 430 Denver N<br />
CORSI 1 CORSI 1 6 S 64 W 1 <strong>Elbert</strong> COGCC GW 542 Denver N<br />
DICCIARDELLO 1 DICCIARDELLO 1 6 S 65 W 26 <strong>Elbert</strong> COGCC GW 365 Dawson N<br />
DORMAN 1 DORMAN 1 6 S 65 W 26 <strong>Elbert</strong> COGCC GW 325 Dawson N<br />
EDWARDS 1 EDWARDS 1 6 S 64 W 2 <strong>Elbert</strong> COGCC GW 281 Denver N<br />
EDWARDS II EDWARDS II 6 S 64 W 2 <strong>Elbert</strong> COGCC GW 361 Denver N<br />
FENNEL 1 FENNEL 1 6 S 65 W 10 <strong>Elbert</strong> COGCC GW 357 Dawson N<br />
HAMPTON 1 HAMPTON 1 6 S 65 W 32 Douglas COGCC GW 311 Dawson N<br />
HARPERWW HARPERWW 6 S 65 W 26 <strong>Elbert</strong> COGCC GW 425 Dawson Y<br />
HATTON 1 HATTON 1 6 S 65 W 26 <strong>Elbert</strong> COGCC GW 600 Dawson N<br />
HINDS 1 HINDS 1 6 S 64 W 2 <strong>Elbert</strong> COGCC GW 261 Denver N<br />
IRELAND 1 IRELAND 1 6 S 65 W 35 <strong>Elbert</strong> COGCC GW 425 Dawson N<br />
JACOBS 1 JACOBS 1 6 S 65 W 26 <strong>Elbert</strong> COGCC GW 381 Dawson N<br />
KNIGHT 1 KNIGHT 1 6 S 65 W 26 <strong>Elbert</strong> COGCC GW 402 Dawson N<br />
KREUTZER 1 KREUTZER 1 6 S 65 W 26 <strong>Elbert</strong> COGCC GW 504 Dawson N<br />
LUKE 1 LUKE 1 6 S 64 W 1 <strong>Elbert</strong> COGCC GW 361 Arapahoe N<br />
PETTINGER 1 PETTINGER 1 6 S 64 W 2 <strong>Elbert</strong> COGCC GW 321 Denver N<br />
PURVIS 1 PURVIS 1 6 S 64 W 1 Elb <strong>Elbert</strong> COGCC GW 905 DDenver N<br />
SKOGLUND 1 SKOGLUND 1 6 S 64 W 1 <strong>Elbert</strong> COGCC GW 523 Denver N<br />
VAILWW VAILWW 6 S 65 W 26 <strong>Elbert</strong> COGCC GW 400 Dawson Y<br />
Weimer Weimer 5 S 63 W 20 Arapahoe COGCC GW 590 Dawson Y<br />
ZLATEV WATER WELL ZLATEV WATER WELL 7 S 64 W 28 <strong>Elbert</strong> COGCC GW 410 Denver Y<br />
06758000 KIOWA CREEK AT ELBERT, CO. 10 S 64 W 3 <strong>Elbert</strong> USGS‐NWIS Stream ‐‐ Y<br />
06758100 WEST KIOWA CREEK AT ELBERT, CO. 10 S 64 W 3 <strong>Elbert</strong> USGS‐NWIS Stream ‐‐ Y<br />
06758200 KIOWA CREEK AT KIOWA, CO. 8 S 63 W 20 <strong>Elbert</strong> USGS‐NWIS Stream ‐‐ Y<br />
6758700<br />
MIDDLE BIJOU CREEK TRIBUTARY NR DEER<br />
6 S 61 W 25 <strong>Elbert</strong> USGS‐NWIS Stream ‐‐ N<br />
TRAIL, CO.<br />
390001103592201 SC01205915CDD1 12 S 59 W 15 <strong>Elbert</strong> USGS‐NWIS GW 245 Laramie‐Fox Hills Y<br />
390138103584201 SC01205910AAA1 12 S 59 W 10 <strong>Elbert</strong> USGS‐NWIS GW 250 Laramie‐Fox Hills Y<br />
390316103563801 SC01105936AAC1 11 S 59 W 36 <strong>Elbert</strong> USGS‐NWIS GW 168 Laramie‐Fox Hills N<br />
390442103555201 SC01105819DBB 11 S 58 W 19 <strong>Elbert</strong> USGS‐NWIS GW 151 Laramie‐Fox Hills Y<br />
390530104020201 SC01105918DAA1 11 S 59 W 18 <strong>Elbert</strong> USGS‐NWIS GW 190 Arapahoe Y<br />
390623103533601 SC01105809DBB1 11 S 58 W 9 <strong>Elbert</strong> USGS‐NWIS GW 200 Laramie‐Fox Hills Y<br />
390742104074001 SC01006032DDD1 11 S 60 W 5 El Paso USGS‐NWIS GW 180 Arapahoe Y<br />
390747104424101 SC01006531CDC1 10 S 65 W 31 Douglas USGS‐NWIS Spring Alluvium N<br />
Site<br />
Type<br />
Well<br />
Depth<br />
Aquifer<br />
Censored<br />
Data?
SITE ID Site Name<br />
Appendix A<br />
Sample Location Information<br />
Township<br />
Range<br />
Section<br />
<strong>County</strong> Data Source<br />
390748104423600 SC10‐65‐31CDD 10 S 65 W 31 Douglas USGS‐NWIS GW Dawson N<br />
390753103593301 SC01005934DCA1 10 S 59 W 34 <strong>Elbert</strong> USGS‐NWIS GW 335 Laramie‐Fox Hills Y<br />
390807103551101 DB‐18 10S/58W‐31AAA 10 S 58 W 32 <strong>Elbert</strong> USGS‐NWIS GW Unknown Y<br />
390817104040301 SC01006036BCC1 10 S 60 W 36 <strong>Elbert</strong> USGS‐NWIS GW 438 Laramie‐Fox Hills N<br />
390821104010601 SC01005932ACA1 10 S 59 W 32 <strong>Elbert</strong> USGS‐NWIS GW 438 Laramie‐Fox Hills Y<br />
390821104402901 SC01006533BDB1 10 S 65 W 33 Douglas USGS‐NWIS Spring Alluvium N<br />
390824104021201 SC01006035BAD1 10 S 59 W 31 <strong>Elbert</strong> USGS‐NWIS GW 525 Laramie‐Fox Hills Y<br />
390837103551201 SC01005830DDD1 10 S 58 W 30 <strong>Elbert</strong> USGS‐NWIS GW 348 Laramie‐Fox Hills Y<br />
390901104051101 SC01006026BCC1 10 S 60 W 26 <strong>Elbert</strong> USGS‐NWIS GW Laramie‐Fox Hills Y<br />
390904103525201 DB 19 10S/58W‐27BCC 10 S 58 W 27 <strong>Elbert</strong> USGS‐NWIS GW Unknown Y<br />
390917104154201 SC01006130ABC1 10 S 61 W 30 <strong>Elbert</strong> USGS‐NWIS GW 227 Denver N<br />
390926104403200 SC01006528BAB TED SMITH 10 S 65 W 28 Douglas USGS‐NWIS GW Alluvium N<br />
390935104301001 SC01006424DCD DAWMAS26 10 S 64 W 24 <strong>Elbert</strong> USGS‐NWIS GW 500 Dawson Y<br />
391006104170101 SC01006224BDA1 10 S 62 W 24 <strong>Elbert</strong> USGS‐NWIS GW 527 Arapahoe Y<br />
391006104404201 SC01006521BCA1 10 S 65 W 21 Douglas USGS‐NWIS GW 16.5 Alluvium N<br />
391007103514501 SC01005823BBC1 10 S 58 W 23 <strong>Elbert</strong> USGS‐NWIS GW 200 Laramie‐Fox Hills N<br />
391008104421800 SC01006519ACA DAN JONES SPRING #1 UPPER 10 S 65 W 19 Douglas USGS‐NWIS Spring Unknown N<br />
391011103582501 SC01005923BBB1 10 S 59 W 23 <strong>Elbert</strong> USGS‐NWIS GW 212 Laramie‐Fox Hills Y<br />
391012104421600<br />
SC01006519ABD DAN JONES SPRING #1<br />
LOWER<br />
10 S 65 W 19 Douglas g USGS‐NWIS Spring p g<br />
Unknown N<br />
391016103534101 SC01005821BAB1 10 S 58 W 21 <strong>Elbert</strong> USGS‐NWIS GW 150 Laramie‐Fox Hills Y<br />
391017103534801 DB‐17 10S/58W‐21BBA 10 S 58 W 21 <strong>Elbert</strong> USGS‐NWIS GW Unknown Y<br />
391018104140101 SC01006121BBB1 10 S 61 W 21 <strong>Elbert</strong> USGS‐NWIS GW 510 Arapahoe Y<br />
391028104310701 SC01006414DDC1 10 S 64 W 14 <strong>Elbert</strong> USGS‐NWIS GW 1000 Denver N<br />
391030104374901 SC01006514DCD1 10 S 65 W 14 <strong>Elbert</strong> USGS‐NWIS GW 345 Dawson N<br />
391034104295001 SC01006413DDA1 10 S 64 W 13 <strong>Elbert</strong> USGS‐NWIS GW 385 Dawson Y<br />
391037104054601 SC01006015DBC1 10 S 60 W 15 <strong>Elbert</strong> USGS‐NWIS GW 705 Unknown Y<br />
391047104265201 SC01006316DBB1 10 S 63 W 16 <strong>Elbert</strong> USGS‐NWIS GW 325 Denver Y<br />
391058103572601 SC01005913BCB1 10 S 59 W 14 <strong>Elbert</strong> USGS‐NWIS GW 125 Laramie‐Fox Hills Y<br />
391133104140801 SC01006108DAA1 10 S 61 W 8 <strong>Elbert</strong> USGS‐NWIS GW 305 Arapahoe Y<br />
391135104211601 SC01006208DBB1 10 S 62 W 8 <strong>Elbert</strong> USGS‐NWIS GW 447 Unknown N<br />
391148104114701 SC01006111BCB1 10 S 61 W 11 <strong>Elbert</strong> USGS‐NWIS GW 484 Arapahoe Y<br />
391148104294101 SC01006307BCC DAWMAS27 10 S 63 W 7 <strong>Elbert</strong> USGS‐NWIS GW 475 Dawson N<br />
391204103593601 SC01005903CCC1 10 S 59 W 3 <strong>Elbert</strong> USGS‐NWIS GW 460 Laramie‐Fox Hills Y<br />
391204104430000 SC01006507BBB EMIL ANDERSON SPRING 10 S 65 W 7 Douglas USGS‐NWIS Spring Dawson N<br />
391220104344201 SC01006405DBC1 10 S 64 W 5 <strong>Elbert</strong> USGS‐NWIS GW 298 Dawson Y<br />
391234104065201 SC01006004BDD1 10 S 60 W 4 <strong>Elbert</strong> USGS‐NWIS GW 240 Arapahoe N<br />
Site<br />
Type<br />
Well<br />
Depth<br />
Aquifer<br />
Censored<br />
Data?
SITE ID Site Name<br />
Appendix A<br />
Sample Location Information<br />
Township<br />
Range<br />
Section<br />
<strong>County</strong> Data Source<br />
391253104321501 SC01006403AAB1 10 S 64 W 3 <strong>Elbert</strong> USGS‐NWIS GW 130 Dawson Y<br />
391253104430000 SC01006506BBC EMIL ANDERSON 10 S 65 W 6 Douglas USGS‐NWIS GW Alluvium N<br />
391256104054301 SC00906034DCC1 9 S 60 W 34 <strong>Elbert</strong> USGS‐NWIS GW 165 Arapahoe Y<br />
391300104142801 SC00906132DCD1 9 S 61 W 32 <strong>Elbert</strong> USGS‐NWIS GW 567 Arapahoe N<br />
391318104322501 SC00906434DBA1 9 S 64 W 34 <strong>Elbert</strong> USGS‐NWIS GW 287 Dawson N<br />
391410104121101 SC00906127DBA 9 S 61 W 27 <strong>Elbert</strong> USGS‐NWIS GW 150 Arapahoe Y<br />
391422103554901 SC00905830BDB1 9 S 58 W 30 <strong>Elbert</strong> USGS‐NWIS GW 376 Laramie‐Fox Hills Y<br />
391423104384701 SC00906528ADD1 9 S 65 W 27 <strong>Elbert</strong> USGS‐NWIS GW 228 Dawson Y<br />
391436104085401 SC00906030ABA1 9 S 60 W 30 <strong>Elbert</strong> USGS‐NWIS GW 130 Arapahoe Y<br />
391440104415200 SC00906529BBB DARRELL BELL NO 1 9 S 65 W 29 Douglas USGS‐NWIS GW Alluvium N<br />
391441104403600 SC00906528BBA PATRICK REYNOLDS WELL 9 S 65 W 28 Douglas USGS‐NWIS GW Alluvium N<br />
391449104404000 SC00906521CCD GILLILAND SPRING 9 S 65 W 21 Douglas USGS‐NWIS Spring Dawson N<br />
391514104184201 SC00906223BCC1 9 S 62 W 22 <strong>Elbert</strong> USGS‐NWIS GW 602 Arapahoe Y<br />
391532103565501 SC00905924BAA1 9 S 59 W 24 <strong>Elbert</strong> USGS‐NWIS GW 170 Laramie‐Fox Hills Y<br />
391545104335401 SC00906416CDB DAWMAS22 9 S 64 W 16 <strong>Elbert</strong> USGS‐NWIS GW 360 Dawson N<br />
391558104193601 DB‐7 9S/62W‐15CBB 9 S 62 W 15 <strong>Elbert</strong> USGS‐NWIS GW Unknown Y<br />
391604104354101 SC00906418ACD1 9 S 64 W 18 <strong>Elbert</strong> USGS‐NWIS GW 270 Dawson Y<br />
391606104392701 SC00906515BDC DAWMAS15 9 S 65 W 15 <strong>Elbert</strong> USGS‐NWIS GW 315 Dawson N<br />
391622104092201 SC00906018BBA1 9 S 60 W 18 <strong>Elbert</strong> USGS‐NWIS GW 560 Laramie‐Fox Hills N<br />
391637104335001 SC00906409CDB1 9 S 64 W 9 <strong>Elbert</strong> USGS‐NWIS GW 322 Dawson Y<br />
391648104280201 SC00906308DBB1 9 S 63 W 8 Elb <strong>Elbert</strong> USGS USGS‐NWIS NWIS GW 210 DDawson N<br />
391705104412301 SC00906508ACB1 9 S 65 W 8 Douglas USGS‐NWIS GW 315 Dawson N<br />
391706104412301 SC00906613ACA1 9 S 65 W 8 Douglas USGS‐NWIS GW 380 Dawson Y<br />
391719104072301 SC00906005DDD1 9 S 60 W 4 <strong>Elbert</strong> USGS‐NWIS GW 183 Arapahoe N<br />
391737104185901 SC00906203DBD1 9 S 62 W 3 <strong>Elbert</strong> USGS‐NWIS GW 302 Arapahoe N<br />
391738104185801 DB‐8 9S/62W/3DBB 9 S 62 W 3 <strong>Elbert</strong> USGS‐NWIS GW Unknown Y<br />
391740103550501 SC00905806DAA1 9 S 58 W 5 <strong>Elbert</strong> USGS‐NWIS GW 157 Laramie‐Fox Hills Y<br />
391740104072401 SC00906005DAA ARAPMAS27 9 S 60 W 4 <strong>Elbert</strong> USGS‐NWIS GW 130 Arapahoe N<br />
391740104143201 DB‐9 9S/61W‐5BDD 9 S 61 W 5 <strong>Elbert</strong> USGS‐NWIS GW Unknown Y<br />
391740104143301 SC00906105DBB1 9 S 61 W 5 <strong>Elbert</strong> USGS‐NWIS GW 378 Arapahoe Y<br />
391809103535401 SC00805833CCC1 8 S 58 W 33 <strong>Elbert</strong> USGS‐NWIS GW 165 Laramie‐Fox Hills Y<br />
391809104023601 SC00805931CDC1 8 S 59 W 31 <strong>Elbert</strong> USGS‐NWIS GW 585 Laramie‐Fox Hills Y<br />
391809104095501 SC00806136DCD1 9 S 61 W 1 <strong>Elbert</strong> USGS‐NWIS GW 1047 Laramie‐Fox Hills Y<br />
391815104092101 SC00806031CCA1 8 S 60 W 31 <strong>Elbert</strong> USGS‐NWIS GW 175 Arapahoe Y<br />
391817104221901 SC00806231DCD1 8 S 62 W 31 <strong>Elbert</strong> USGS‐NWIS GW 383 Denver Y<br />
391822104212501 DB00806232CDA 8 S 62 W 32 <strong>Elbert</strong> USGS‐NWIS GW Unknown Y<br />
391825104272101 SC00806333CBD DENMAS06 8 S 63 W 33 <strong>Elbert</strong> USGS‐NWIS GW 963 Denver N<br />
391834104205601 SC00806232DAA ARAPMAS22 8 S 62 W 32 <strong>Elbert</strong> USGS‐NWIS GW 832 Arapahoe Y<br />
Site<br />
Type<br />
Well<br />
Depth<br />
Aquifer<br />
Censored<br />
Data?
SITE ID Site Name<br />
Appendix A<br />
Sample Location Information<br />
Township<br />
Range<br />
Section<br />
<strong>County</strong> Data Source<br />
391848104261401 SC00806334BCA DAWMAS28 8 S 63 W 34 <strong>Elbert</strong> USGS‐NWIS GW 388 Dawson N<br />
391851104204501 SC00806233BBC DENMAS05 8 S 62 W 33 <strong>Elbert</strong> USGS‐NWIS GW 545 Denver N<br />
391852104391301 SC00806534ACB DAWMAS16 8 S 65 W 34 <strong>Elbert</strong> USGS‐NWIS GW 720 Dawson N<br />
391930104324901 SC00806427CAC2 8 S 64 W 27 <strong>Elbert</strong> USGS‐NWIS GW 235 Dawson N<br />
391932104055001 SC00806027BDC1 8 S 60 W 27 <strong>Elbert</strong> USGS‐NWIS GW 240 Arapahoe Y<br />
391938104123301 SC00806127BDB1 8 S 61 W 27 <strong>Elbert</strong> USGS‐NWIS GW 200 Denver N<br />
391951103541301 SC00805924DCC1 8 S 58 W 20 <strong>Elbert</strong> USGS‐NWIS GW 270 Laramie‐Fox Hills Y<br />
392001104285401 SC00806319DDC1 8 S 63 W 19 <strong>Elbert</strong> USGS‐NWIS GW 133 Dawson Y<br />
392013104144901 SC00806120CAB1 8 S 61 W 20 <strong>Elbert</strong> USGS‐NWIS GW 135 Arapahoe Y<br />
392021104280000 SC00806308DBB 8 S 63 W 20 <strong>Elbert</strong> USGS‐NWIS GW 610 Denver Y<br />
392024104305401 SC00806423ADD1 8 S 64 W 23 <strong>Elbert</strong> USGS‐NWIS GW 288 Dawson Y<br />
392031104121801 SC00806122ACB1 8 S 61 W 22 <strong>Elbert</strong> USGS‐NWIS GW 174 Denver Y<br />
392033104083201 SC00806019AAD1 8 S 60 W 19 <strong>Elbert</strong> USGS‐NWIS GW 240 Arapahoe Y<br />
392041104015501 SC00805919AAB1 8 S 59 W 19 <strong>Elbert</strong> USGS‐NWIS GW 150 Arapahoe Y<br />
392045104184601 SC00806222AAB1 8 S 62 W 22 <strong>Elbert</strong> USGS‐NWIS GW 275 Denver N<br />
392050104415000 SC00806520BBA RUSSELVILLE SPRING 8 S 65 W 20 Douglas USGS‐NWIS Spring Unknown N<br />
392053104181301 SC00806214CDC1 8 S 62 W 14 <strong>Elbert</strong> USGS‐NWIS GW 400 Arapahoe N<br />
392055104181201 DB‐11 8S/62W/14CDC 8 S 62 W 14 <strong>Elbert</strong> USGS‐NWIS GW Unknown Y<br />
392107104430400 SC00806518CBC ROBT WELBORN WELL #1 8 S 65 W 18 Douglas USGS‐NWIS GW Unknown N<br />
392107104430401 SC00806518CBC 8 S 65 W 18 Douglas USGS‐NWIS GW 45 Alluvium Y<br />
392108103542001 SC00805817ACC1 8 S 58 W 17 Elb <strong>Elbert</strong> USGS USGS‐NWIS NWIS GW 106 LLaramie‐Fox i F Hills Hill Y<br />
392118104362301 SC00806418BCC ARAPMAS15 8 S 64 W 18 <strong>Elbert</strong> USGS‐NWIS GW 2149 Arapahoe N<br />
392119104362401 SC0086418BCB SWQA‐1 8 S 64 W 18 <strong>Elbert</strong> USGS‐NWIS GW 536 Dawson N<br />
392122104313001 SC00806414BDA1 8 S 64 W 14 <strong>Elbert</strong> USGS‐NWIS GW 232 Dawson Y<br />
392126104363301 SC00806513ADB1 8 S 65 W 13 <strong>Elbert</strong> USGS‐NWIS GW 203 Dawson Y<br />
392130104195001 DB‐10 8S/62W 16AAC 8 S 62 W 16 <strong>Elbert</strong> USGS‐NWIS GW Unknown Y<br />
392130104251201 SC00806314BBC1 8 S 63 W 14 <strong>Elbert</strong> USGS‐NWIS GW 265 Dawson N<br />
392130104341401 SC00806417AAD1 8 S 64 W 17 <strong>Elbert</strong> USGS‐NWIS GW 270 Dawson Y<br />
392131104351701 SC00806417BBC DAWMAS21 8 S 64 W 17 <strong>Elbert</strong> USGS‐NWIS GW 435 Dawson Y<br />
392132104411001 SC00706532DCD1 8 S 65 W 17 Douglas USGS‐NWIS GW 300 Dawson Y<br />
392133104341001 SC00806416BBC1 8 S 64 W 16 <strong>Elbert</strong> USGS‐NWIS GW 328 Dawson Y<br />
392141104395501 SC00806516AAA1 8 S 65 W 16 Douglas USGS‐NWIS GW 452 Dawson Y<br />
392142104145701 SC00806108CCD1 8 S 61 W 8 <strong>Elbert</strong> USGS‐NWIS GW 261 Arapahoe Y<br />
392156104050901 SC00806010DAD1 8 S 60 W 10 <strong>Elbert</strong> USGS‐NWIS GW 100 Arapahoe Y<br />
392205104233801 SC00806312DBB1 8 S 63 W 12 <strong>Elbert</strong> USGS‐NWIS GW 170 Dawson Y<br />
392214104024201 SC00805907BCA1 8 S 59 W 7 <strong>Elbert</strong> USGS‐NWIS GW 90 Arapahoe Y<br />
392221104144801 SC00806108BAC1 8 S 61 W 8 <strong>Elbert</strong> USGS‐NWIS GW 150 Denver Y<br />
392244104143201 SC00806105DBC1 8 S 61 W 5 <strong>Elbert</strong> USGS‐NWIS GW 144 Arapahoe N<br />
Site<br />
Type<br />
Well<br />
Depth<br />
Aquifer<br />
Censored<br />
Data?
SITE ID Site Name<br />
Appendix A<br />
Sample Location Information<br />
Township<br />
Range<br />
Section<br />
<strong>County</strong> Data Source<br />
392249104274801 SC00806305DAC1 8 S 63 W 5 <strong>Elbert</strong> USGS‐NWIS GW 128 Dawson Y<br />
392254104305601 SC00806402DAA DAWMAS29 8 S 64 W 2 <strong>Elbert</strong> USGS‐NWIS GW 280 Dawson N<br />
392307104120501 SC00806103ADB1 8 S 61 W 3 <strong>Elbert</strong> USGS‐NWIS GW 715 Arapahoe Y<br />
392321104161001 SC00806106BBA1 8 S 61 W 6 <strong>Elbert</strong> USGS‐NWIS GW 289 Arapahoe Y<br />
392331104304701 SC00706436CCC1 7 S 64 W 36 <strong>Elbert</strong> USGS‐NWIS GW 285 Dawson Y<br />
392342104341301 SC00706432DAD1 7 S 64 W 32 <strong>Elbert</strong> USGS‐NWIS GW 236 Dawson Y<br />
392357104251301 SC00706335BCA1 7 S 63 W 35 <strong>Elbert</strong> USGS‐NWIS GW 75 Denver Y<br />
392400104150601 SC00706132BBC ARAPMAS28 7 S 61 W 32 <strong>Elbert</strong> USGS‐NWIS GW 434 Arapahoe N<br />
392440104420901<br />
SC00706530DAC1 MIDDLE W DON<br />
7 S 65 W 30 Douglas USGS‐NWIS GW Alluvium N<br />
ROTHSCHOPF<br />
392442103545201 SC00705829BCC1 7 S 58 W 29 <strong>Elbert</strong> USGS‐NWIS GW 197 Laramie‐Fox Hills Y<br />
392451104205401 SC00706229ADA1 7 S 62 W 29 <strong>Elbert</strong> USGS‐NWIS GW 479 Denver N<br />
392453104194101 SC00706227BCB1 7 S 62 W 27 <strong>Elbert</strong> USGS‐NWIS GW 307 Denver N<br />
392455104074801 SC00706029ABC1 7 S 60 W 29 <strong>Elbert</strong> USGS‐NWIS GW 486 Arapahoe Y<br />
392525104001001 SC00705921CAA1 7 S 59 W 21 <strong>Elbert</strong> USGS‐NWIS GW 376 Laramie‐Fox Hills Y<br />
392528104330601 SC00706421DAD1 7 S 64 W 21 <strong>Elbert</strong> USGS‐NWIS GW 395 Dawson N<br />
392548104253701 SC00706322ABD1 7 S 63 W 22 <strong>Elbert</strong> USGS‐NWIS GW 180 Denver Y<br />
392559104415201 SC00706520BBA DENMAS01 7 S 65 W 20 Douglas USGS‐NWIS GW 940 Denver N<br />
392616104260601 SC00706315CAC DAWMAS30 7 S 63 W 15 <strong>Elbert</strong> USGS‐NWIS GW 435 Dawson N<br />
392635104181901 SC00706214BDB1 7 S 62 W 14 <strong>Elbert</strong> USGS‐NWIS GW Unknown N<br />
392639 392639104403001 0 0300 SC00 SC00706516BDB1 06 6 7 S 665 W 16 6 Douglas l USGS‐NWIS SGS S GGW 33133 Dawson N<br />
392640104040501 SC00706014AAD1 7 S 60 W 14 <strong>Elbert</strong> USGS‐NWIS GW 550 Laramie‐Fox Hills N<br />
392650103582601 SC00705910DDD1 7 S 59 W 15 <strong>Elbert</strong> USGS‐NWIS GW 170 Laramie‐Fox Hills Y<br />
392712104182601 SC00706211CBA1 7 S 62 W 11 <strong>Elbert</strong> USGS‐NWIS GW 189 Denver Y<br />
392727104385201 SC00706510ADC DAWMAS17 7 S 65 W 10 <strong>Elbert</strong> USGS‐NWIS GW 295 Dawson N<br />
392741104343101 SC00706408ABA DAWMAS20 7 S 64 W 8 <strong>Elbert</strong> USGS‐NWIS GW 455 Dawson N<br />
392743104210901 SC00706208AAB 7 S 62 W 8 <strong>Elbert</strong> USGS‐NWIS GW 685 Arapahoe N<br />
392745104362201 SC00706512AAA1 USGS 392745104362201 7 S 65 W 12 <strong>Elbert</strong> USGS‐NWIS GW 295 Dawson Y<br />
392748104153501 SC00706106DCD1 7 S 61 W 6 <strong>Elbert</strong> USGS‐NWIS GW 360 Arapahoe Y<br />
392756104040301 SC00706002DAD1 7 S 60 W 2 <strong>Elbert</strong> USGS‐NWIS GW 395 Laramie‐Fox Hills Y<br />
392802104424001 SC00706506BDC1 7 S 65 W 6 Douglas USGS‐NWIS GW 405 Dawson Y<br />
392811104403801 SC00706504DBA1 7 S 65 W 4 Douglas USGS‐NWIS GW 280 Dawson Y<br />
392821104064701 SC00706004ACB1 7 S 60 W 4 <strong>Elbert</strong> USGS‐NWIS GW 155 Arapahoe Y<br />
392825104263901 SC00706304AAC1 7 S 63 W 4 <strong>Elbert</strong> USGS‐NWIS GW 240 Denver Y<br />
392839104210601 SC00606232DDC1 6 S 62 W 32 <strong>Elbert</strong> USGS‐NWIS GW 527 Denver Y<br />
392841104185001 SC00606234DDC1 6 S 62 W 34 <strong>Elbert</strong> USGS‐NWIS GW 363 Arapahoe Y<br />
392858104090101 SC00606031DBB1 6 S 60 W 31 <strong>Elbert</strong> USGS‐NWIS GW 216 Arapahoe Y<br />
Site<br />
Type<br />
Well<br />
Depth<br />
Aquifer<br />
Censored<br />
Data?
SITE ID Site Name<br />
Appendix A<br />
Sample Location Information<br />
Township<br />
Range<br />
Section<br />
<strong>County</strong> Data Source<br />
392903104260501 SC00606334CAB1 6 S 63 W 34 <strong>Elbert</strong> USGS‐NWIS GW 155 Denver N<br />
392914104381501 SC00606535BDB1 6 S 65 W 35 <strong>Elbert</strong> USGS‐NWIS GW 310 Dawson Y<br />
392920104151001 SC00606132BBC 6 S 61 W 32 <strong>Elbert</strong> USGS‐NWIS GW 100 Denver N<br />
392927104395101 SC00606533AAB1 6 S 65 W 33 Douglas USGS‐NWIS GW 318 Dawson Y<br />
392936104340801 SC00606428CCC1 6 S 64 W 28 <strong>Elbert</strong> USGS‐NWIS GW 225 Dawson Y<br />
392953104212801 SC00606229CAA1 6 S 62 W 29 <strong>Elbert</strong> USGS‐NWIS GW 205 Denver Y<br />
393012103592501 SC00605928ABC1 6 S 59 W 27 <strong>Elbert</strong> USGS‐NWIS GW 265 Laramie‐Fox Hills Y<br />
393018104024201 SC00605930BBB1 6 S 59 W 30 <strong>Elbert</strong> USGS‐NWIS GW 460 Laramie‐Fox Hills Y<br />
393022103571101 SC00605924CCC1 6 S 59 W 24 <strong>Elbert</strong> USGS‐NWIS GW 170 Laramie‐Fox Hills Y<br />
393024103432800 SC00605724CDD DTX3 BEAVER CREEK 6 S 57 W 24 <strong>Elbert</strong> USGS‐NWIS GW 16.01 Alluvium Y<br />
393025104093901 SC00606124DDD1 6 S 61 W 24 <strong>Elbert</strong> USGS‐NWIS GW 872 Laramie‐Fox Hills Y<br />
393039104061901 SC00606021DAA1 6 S 60 W 21 <strong>Elbert</strong> USGS‐NWIS GW 180 Arapahoe Y<br />
393043104243101 SC00606323DBA1 6 S 63 W 23 <strong>Elbert</strong> USGS‐NWIS GW 298 Denver Y<br />
393100104182101 SC00606223BBD1 6 S 62 W 23 <strong>Elbert</strong> USGS‐NWIS GW 83 Arapahoe Y<br />
393104104392501 SC00606515CAA1 6 S 65 W 22 <strong>Elbert</strong> USGS‐NWIS GW 380 Dawson N<br />
393108104072301 SC00606021BBB1 6 S 60 W 20 <strong>Elbert</strong> USGS‐NWIS GW 730 Laramie‐Fox Hills Y<br />
393128104064301 SC00606016DBC1 6 S 60 W 16 <strong>Elbert</strong> USGS‐NWIS GW 620 Laramie‐Fox Hills Y<br />
393137104405001 SC00606517DAD1 6 S 65 W 17 Douglas USGS‐NWIS GW 440 Dawson Y<br />
393138103543401 SC00605817CAB1 6 S 58 W 17 <strong>Elbert</strong> USGS‐NWIS GW 60 Laramie‐Fox Hills Y<br />
393151104343001 SC00606417ACA1 6 S 64 W 17 <strong>Elbert</strong> USGS‐NWIS GW 300 Dawson Y<br />
393156104415501 SC00606518ADA USGS 393156104415501 6 S 65 W 18 Douglas USGS‐NWIS GW 409 Unknown N<br />
393207103544800 SC00605808CCC D21 6 S 58 W 8 <strong>Elbert</strong> USGS‐NWIS GW 18 Unknown Y<br />
393224104362701 SC00606512DAC1 6 S 65 W 12 <strong>Elbert</strong> USGS‐NWIS GW 500 Denver Y<br />
393227104343401 SC00606408DBB DAWMAS19 6 S 64 W 8 <strong>Elbert</strong> USGS‐NWIS GW 320 Dawson N<br />
393247103543800 SC00605808BAC D20 6 S 58 W 8 <strong>Elbert</strong> USGS‐NWIS GW 20 Unknown Y<br />
393253103473201 SC0060570BABA1 SOUTH‐1 6 S 57 W 8 <strong>Elbert</strong> USGS‐NWIS Lake ‐‐ Y<br />
393300104411901 SC00606508ABB DAWMAS18 6 S 65 W 8 Douglas USGS‐NWIS GW 190 Dawson N<br />
393307103515900 SC00605803DCA D22 6 S 58 W 3 <strong>Elbert</strong> USGS‐NWIS GW 37 Unknown Y<br />
393307103545500 SC00605805CBB D16 6 S 58 W 6 <strong>Elbert</strong> USGS‐NWIS GW 23 Unknown Y<br />
393311103541800 SC00605805DBC D19 MUDDY CREEK 6 S 58 W 5 <strong>Elbert</strong> USGS‐NWIS GW 28 Unknown Y<br />
393321104400801 SC00606504DBC1 6 S 65 W 4 Douglas USGS‐NWIS GW 425 Dawson Y<br />
393326104002001 SC00605904BCD1 6 S 59 W 4 <strong>Elbert</strong> USGS‐NWIS GW 242 Laramie‐Fox Hills N<br />
393327103541200 SC00605805BDB D17 MUDDY CREEK 6 S 58 W 5 <strong>Elbert</strong> USGS‐NWIS GW 20 Unknown Y<br />
393330103545300 SC00605806AAD D23 6 S 58 W 6 <strong>Elbert</strong> USGS‐NWIS GW 13.5 Unknown Y<br />
393336104383801 SC00606503ADB1 6 S 65 W 3 <strong>Elbert</strong> USGS‐NWIS GW 510 Denver Y<br />
393353104213901 SC00506232CCC1 5 S 62 W 32 Arapahoe USGS‐NWIS GW 186 Denver N<br />
393358103434200 SC00605701BAB DTX4 BEAVER CREEK 5 S 57 W 35 <strong>Elbert</strong> USGS‐NWIS GW 14.02 Alluvium N<br />
Site<br />
Type<br />
Well<br />
Depth<br />
Aquifer<br />
Censored<br />
Data?
SITE ID Site Name<br />
Appendix A<br />
Sample Location Information<br />
Township<br />
Range<br />
Section<br />
<strong>County</strong> Data Source<br />
393358103454800 SC00605703BAB DTX5 BEAVER CREEK 6 S 57 W 3 <strong>Elbert</strong> USGS‐NWIS GW 18.5 Alluvium Y<br />
393358103464800 SC00605704BAA DTX6 BEAVER CREEK 6 S 57 W 4 <strong>Elbert</strong> USGS‐NWIS GW 36.5 Alluvium Y<br />
393422104035501 SC00506035DAB1 5 S 60 W 35 Arapahoe USGS‐NWIS GW 495 Laramie‐Fox Hills Y<br />
393439104300801 SC00506436BAA1 5 S 64 W 36 Arapahoe USGS‐NWIS GW 340 Denver Y<br />
393441104410501 SC00506532ABD1 5 S 65 W 32 Arapahoe USGS‐NWIS GW 435 Dawson Y<br />
393445104224201 SC00506230CCC ARAPMAS21 5 S 62 W 30 Arapahoe USGS‐NWIS GW 282 Arapahoe N<br />
393449104004301 SC00505932ABA1 5 S 59 W 32 Arapahoe USGS‐NWIS GW 337 Laramie‐Fox Hills Y<br />
393451104202901 SC00506228DDA1 5 S 62 W 28 Arapahoe USGS‐NWIS GW 340 Arapahoe Y<br />
393529103565101 SC00505925BCB1 5 S 59 W 25 Arapahoe USGS‐NWIS GW 260 Laramie‐Fox Hills Y<br />
393605104425601 SC00506519CBB1 5 S 65 W 19 Arapahoe USGS‐NWIS GW 449 Dawson Y<br />
393610104300601 SC00506424BDA 5 S 64 W 24 Arapahoe USGS‐NWIS GW 156 Denver N<br />
393612104015701 SC00505919ACC1 5 S 59 W 19 Arapahoe USGS‐NWIS GW 320 Laramie‐Fox Hills Y<br />
393617104131101 SC00506121ABC ARAPMAS29 5 S 61 W 21 Arapahoe USGS‐NWIS GW 420 Arapahoe N<br />
393622104274501 SC00706512AAA1 USGS 393622104274501 5 S 63 W 20 Arapahoe USGS‐NWIS GW 295 Unknown Y<br />
393625104244501 SC00506323BBA1 5 S 63 W 23 Arapahoe USGS‐NWIS GW Denver Y<br />
393626104104901 SC00506123ABB1 5 S 61 W 23 Arapahoe USGS‐NWIS GW 890 Laramie‐Fox Hills N<br />
393638104300501 SC00506413CDA1 5 S 64 W 13 Arapahoe USGS‐NWIS GW 203 Denver Y<br />
Site<br />
Type<br />
Well<br />
Depth<br />
Aquifer<br />
Censored<br />
Data?