INTERNATIONAL MEDICAL CORPS - PFEDA / Page d'accueil PFEDA
INTERNATIONAL MEDICAL CORPS - PFEDA / Page d'accueil PFEDA
INTERNATIONAL MEDICAL CORPS - PFEDA / Page d'accueil PFEDA

Create successful ePaper yourself
Turn your PDF publications into a flip-book with our unique Google optimized e-Paper software.
<strong>INTERNATIONAL</strong> <strong>MEDICAL</strong> <strong>CORPS</strong><br />
EL BERDE AND RABDURE DISTRICTS<br />
BAKOOL REGION<br />
SOMALIA<br />
HEALTH AND NUTRITION SURVEY<br />
17 August 2000 – 22 August 2000
TABLE OF CONTENTS<br />
<strong>Page</strong><br />
Executive Summary 3<br />
Introduction 5<br />
IMC El Berde and Rabdure Districts 6<br />
Survey objectives 6<br />
Methodology 7<br />
Questionnaire 7<br />
Sample size 7<br />
Enumerators and data collection 8<br />
Activities 8<br />
Indicators and guidelines 9<br />
Limitations 9<br />
Results<br />
Demographics 10<br />
Disease prevention knowledge 11<br />
EPI coverage 11<br />
Child Vitamin A supplementation 12<br />
Maternal health 12<br />
Tetanus Toxoid coverage 12<br />
Antenatal care 12<br />
Micronutrient supplementation 12<br />
Delivery location and attendant 12<br />
Postnatal care 13<br />
Number of pregnancies 13<br />
Pregnancy outcome 13<br />
Child morbidity 13<br />
Child mortality 13<br />
Child feeding practices 13<br />
Child nutrition 15<br />
Discussion 18<br />
List of Tables and Figures 21<br />
Bibliography 22<br />
Appendix 1: English survey form<br />
Appendix 2: Somali survey form<br />
Appendix 3: Local Calendar<br />
Appendix 4: District Village Data<br />
2
Executive Summary<br />
Survey Objectives<br />
The Bakool region survey was conducted to establish baseline information for new program<br />
goals set in the April 1, 2000 to March 31, 2001 grant period.<br />
Methodology<br />
A two-stage cluster design was used for sampling in the El Berde/Rabdure District survey.<br />
Households with mothers of children under 5 years old were surveyed. The sample size for<br />
EPI was 332, for KAP information 209, and the sample size for anthropometric assessment<br />
was 874.<br />
Results<br />
Demographics<br />
• 90.9% permanent residents<br />
• 37.8% farmers<br />
• mean household size 7.4<br />
• mean number of children under 5 = 1.8<br />
Disease Prevention Knowledge<br />
84.3% of mothers were aware of at least one vaccine preventable disease<br />
78.0% named at least one effective method for cholera prevention<br />
94.7% knew at least one form of malaria prevention<br />
Maternal Health<br />
• 81.8 % mothers delivered their last child with an untrained TBA<br />
• 52.2% mothers have had 5 or more pregnancies<br />
Antenatal Postnatal<br />
Received care 14.4 % 11.0 %<br />
Received 2 or more consultations by<br />
trained TBA/midwife 11.5 % 7.7 %<br />
Ferrous folic tablets 19.5 % 14.4 %<br />
Vitamin A 13.5 %<br />
Received 2 doses of TT 30.6 % (report)<br />
14.4 % (card)<br />
3
EPI Coverage<br />
Mother’s Report Confirmed with Confirmed with<br />
Card<br />
Scar<br />
DPT3 23.2 % 16.0 %<br />
OPV3 25.0 % 17.2 %<br />
Measles 59.2 % 44.7 %<br />
BCG 65.4 % 48.8 % 62.7 %<br />
Child Morbidity/Mortality<br />
• 25.6 % of children had diarrhea in the past two weeks<br />
• 55.6 % of children had a respiratory infection in the past two weeks<br />
• Under 5 mortality calculated to be 65.2/1000/year<br />
• Diarrhea, malnutrition, and malaria are the leading causes of mortality<br />
Feeding Practices<br />
• 64.0% of children were exclusively breastfed for the first six months after birth<br />
• 43.9% of children between 7 and 24 months do not have breast milk in their diet<br />
Child Nutrition<br />
In children 6 – 59 months:<br />
Global Severe<br />
W/H Z-score and/or oedema 13.7 % 3.8 %<br />
W/H % of median and/or oedema 7.9 % 1.0 %<br />
Discussion<br />
IMC has proposed the implementation of PHC services in an effort to mitigate common and<br />
preventable illnesses such as malnutrition, outbreaks of vaccine-preventable diseases, locally<br />
endemic diseases, maternal health crises, and hygiene-related illnesses – all causes of<br />
morbidity and mortality in this community. Through health education, training, guidance,<br />
supervision, medical supplies and community management of common health issues, IMC<br />
strives to empower the community to assume responsibility for the health of their residents<br />
and to have a positive impact on the health status of this population.<br />
4
Introduction<br />
After the ousting of Mohamed Siad Barre in January 1991, Somalia plunged into a costly<br />
civil war. Hundreds of thousands of Somalis were forced to flee their homes, and civil<br />
unrest, compounded with a severe drought and famine, caused the deaths of tens of thousands<br />
of Somalis. Regions and districts throughout Somalia remain under the control of various<br />
faction leaders, resulting in unofficial mini-states, which lack the resources, services, and<br />
infrastructure that come with economic, political, and military stability.<br />
Central Somalia remains in a precarious condition as a result of continued civil unrest and<br />
periodic environmental disasters. A collapsed socio-economic infrastructure that cannot<br />
adequately address chronic food insecurity and communicable disease epidemics characterize<br />
the magnitude of the complex emergency in this region. Water and sanitation in both urban<br />
and rural areas are compromised, and yearly outbreaks of cholera in centers of population<br />
have become the norm. The health infrastructure in central Somalia consists of unregulated<br />
private pharmacies which are often staffed by unqualified personnel. The potential for<br />
incorrect diagnoses, treatment and follow-up may lead to negative consequences in terms of<br />
drug resistance and morbidity/mortality. The dependence for health care on such a system is<br />
unacceptable at best.<br />
Bakool Region, estimated at 26,300 square kilometers, is located in central Somalia.<br />
Ethiopia is located on Bakool’s northern border and three other Somali regions border it:<br />
Bay to the south, Gedo to the west, and Hiraan to the east. The landscape is characterized as<br />
semi-arid savanna acacia bush land. There is no river flowing through the region, resulting in<br />
massive migrations of nomadic populations during dry seasons. The residents are primarily<br />
engaged in farming and cattle raising. The population estimate for El Berde District is<br />
approximately 48,960, and 20,799 for Rabdure District.<br />
Since 1995, access to Bakool Region has been constrained due to chronic insecurity, and<br />
therefore, little information is available on baseline health indicators. The population’s<br />
mostly nomadic lifestyle has resulted in limited contact with international NGOs. Bakool<br />
Region is particularly vulnerable to natural disasters such as drought and flooding. These<br />
disasters exacerbate the negative health consequences on an already vulnerable population.<br />
Rabdure Town is one of the towns most badly affected by war and drought in Bakool region.<br />
During the past five years, the town was completely destroyed, and many houses were burned<br />
during inter-clan fighting during the SNA occupation of Bay and Bakool regions. Two years<br />
of drought in Bakool region worsened an already precarious nutrition situation in Rabdure<br />
Town.<br />
One survey was conducted for both El Berde and Rabdure Districts due to the similarity of<br />
this population base. The residents of these districts are primarily agro-pastoralists, have a<br />
limited number of villages, and have received health services from IMC in the past several<br />
years. In contrast, most residents of Huddor District are farmers, and IMC recently opened<br />
its MCH center in Huddor Town in July 2000. Two surveys, one for Huddor District and<br />
another for El Berde/Rabdure Districts serve to better identify the health needs of<br />
communities with distinct characteristics.<br />
5
IMC El Berde and Rabdure Districts<br />
IMC has successfully provided vital health services to the El Berde District since 1998. IMC<br />
supports one MCH center in El Berde Town and another MCH in Rabdure Town, providing<br />
essential curative and preventive care to pregnant and lactating women and children under<br />
five years of age. IMC’s Emergency PHC project was expanded recently to establish 10<br />
village health posts in both El Berde and Rabdure Districts and to provide basic training of<br />
community health workers (CHWs) and traditional birth attendants (TBAs). 10 CHWs and<br />
15 TBAs provide services in Rabdure and El Berde Districts, and they completed training in<br />
October 1999.<br />
The April 1, 2000 to March 31, 2001 grant period set several minimum standard goals for<br />
Bakool Region that were measured at baseline in this survey. Targets for El Berde District<br />
are higher reflecting IMC’s longer and more continuous presence in this district:<br />
End of program targets (%) El Berde Rabdure Huddor<br />
Pregnant women receive at least 2 antenatal<br />
consultations by trained TBA/midwife<br />
70 40 40<br />
Deliveries in project area attended by trained<br />
TBA/midwife<br />
60 40 40<br />
Lactating women in project area receive at<br />
least 2 postnatal consultations from trained<br />
TBA/midwife<br />
30 30 30<br />
Children
Methodology<br />
A two-stage cluster design was used for sample selection in El Berde and Rabdure Districts.<br />
The primary sampling unit was the village, and the 30 clusters were selected randomly based<br />
on population estimates. Population estimates and maps for the area were obtained from<br />
local authorities. The cluster interval was calculated by dividing the total cumulative<br />
population under the age of 5 by the number of clusters. A random number between one and<br />
the cluster interval was selected by using a random number table. The first cluster in our<br />
sample included this random number. The second cluster was obtained by adding the cluster<br />
interval to the random number. Subsequent clusters were selected systematically by adding<br />
the cluster interval number to the previous number. Villages with larger populations were<br />
likely to be assigned more than one cluster whereas villages with populations less than the<br />
cluster interval may have none.<br />
The secondary sampling unit was children under the age of 5 years or between 65cm – 110<br />
cm as children in this age group are considered to be particularly vulnerable to malnutrition.<br />
Within the clusters, one member of the team and the village chief went to the geographic<br />
center of the village and spun a pencil to determine the direction in which to proceed. All the<br />
homes in the indicated direction to the outer perimeter of the village were counted and<br />
numbered accordingly. A random number between 1 and the number of households counted<br />
determined the first house to be surveyed. Subsequently, nearby households in this direction<br />
were visited until 7 surveys were completed. Mothers of children under 5 years were<br />
interviewed to gather EPI, health knowledge and healthcare access data. All children less<br />
than 5 years old in these households were screened until anthropometric data were obtained<br />
for 30 children in each cluster. If any mother or child was absent, an effort was made to<br />
return to these homes later in the day. Finally, if the limit of the section was reached before<br />
completing the cluster, the team returned to the center of the village and selected another<br />
direction.<br />
Questionnaire<br />
The questionnaire utilized was a modified version of the 1999 Belet Weyne Villages survey.<br />
The 2000 – 2001 IMC-Somalia Bakool Region operation plan was reviewed and health<br />
indicators were included in formulating the questions. Modification of the questionnaire<br />
resulted from the collaborative efforts of the Bakool Region PHC staff and the Somalia Field<br />
Coordinator in Nairobi and later reviewed by representatives of UNICEF Somalia. The<br />
questionnaire was finalized after field testing by the survey teams.<br />
Sample Size<br />
The sample size is the number of individuals to be included in the survey to “represent” the<br />
population of interest. The sample size required is calculated with the following factors:<br />
t = parameter related to precision (1.96 for an error risk of 5%)<br />
p* = expected prevalence of malnutrition in the population<br />
q = 1 – p, expected proportion of children not presenting malnutrition<br />
d = maximum tolerable error<br />
7
DE = design effect of cluster sampling<br />
N = sample size<br />
N = (DE)( t 2 )p x q = 2 ( 1.96) 2 (.5)(.5) = 768<br />
d 2 (.05) 2<br />
* Here, we have estimated the prevalence at 50 % which is conservative and elicits the largest sample size.<br />
The final sample size of 900 was obtained because it was the nearest sample size to 768 that<br />
can be divided into 30 clusters evenly. 30 clusters of 30 children were measured and<br />
weighed to obtain the minimum sample size for anthropometric assessments using two-stage<br />
cluster sampling.<br />
The minimum sample size for EPI surveys is widely accepted to be 210, and this number was<br />
derived similarly with d = 0.1.<br />
Enumerators and data collection<br />
The survey was conducted between 17/8/00 – 22/8/00. A total of 874 anthropometric<br />
measurements were obtained, and 209 mothers were interviewed health knowledge data. A<br />
community-based approach to data collection was employed by integrating village<br />
committees and community health workers in all activities. The survey was conducted by 4<br />
teams, each consisting of 3 community health workers, a village elder, an IMC supervisor,<br />
and a UNICEF counterpart. IMC Huddor coordinated the three-day training and fieldwork<br />
activities.<br />
Age: Estimated with the help of a local calendar of events (Appendix 3). In the event that<br />
age could not be ascertained with this method, only children between the heights of 65 and<br />
110 cm were included in the anthropometric survey.<br />
Weight: Children were weighed using a 25 kg Salter scale with a precision of 100 g.<br />
Height: Children less than 85 cm in height were measured lying down using a height board<br />
(with a precision of 0.1cm), and children equal to or greater than 85 cm were measured<br />
standing.<br />
Oedema: Only children presenting bilateral oedema on the lower limbs were recorded as<br />
having nutritional oedema.<br />
Activities<br />
Enumerators, supervisors and community elders were trained for three days on survey design,<br />
anthropometric measurements, questionnaire administration, and interview techniques. The<br />
survey teams received a one-day refresher training immediately prior to commencing this<br />
survey. The questionnaire and techniques were pre-tested by each survey team in Madax<br />
Waarabe village. The survey was conducted in each cluster with the supervision of at least<br />
one IMC supervisor and UNICEF counterpart per team. A debriefing attended by all IMC<br />
8
and UNICEF survey supervisors was held after each day of data collection to discuss<br />
observations and concerns.<br />
Indicators and guidelines used<br />
The “gold standard” in anthropometric assessments is weight-for-length/height which<br />
assesses wasting or the failure to gain weight. Estimates of malnutrition were calculated<br />
using the internationally accepted National Center for Health Statistics as a reference.<br />
Expression of Z-scores, also referred to as standard deviation units, is considered the most<br />
appropriate index to quantify wasting in a population during emergency situations where<br />
acute forms of malnutrition are the predominant pattern. Z-scores have true statistical<br />
meaning and allow for inter-study comparisons.<br />
Z-score = (individual’s value) – (median reference value)<br />
Standard deviation of reference population<br />
Guidelines for the results expressed in Z-scores:<br />
Severe acute malnutrition is defined by W/H < -3 SD and/or oedema<br />
Global acute malnutrition is defined by W/H < -2 SD and/or oedema<br />
The percentage of the median is commonly used to identify eligible children for feeding<br />
programs.<br />
Guidelines for the results expressed in percentage of the reference median:<br />
Severe acute malnutrition is defined by W/H < 70% and/or oedema<br />
Global acute malnutrition is defined by W/H < 80% and/or oedema<br />
Regardless of weight and height measurements, presence of oedema in children was an<br />
automatic indicator of severe malnutrition.<br />
The data processing and analysis were completed in the U.S. using EPI-Info 6.04c. The<br />
calculation and analysis of the anthropometrical indications were carried out using the<br />
EPINUT program.<br />
Limitations<br />
Data gathered from a sample of a population provide only an estimate of what the results<br />
would be if measurements were made on the entire population. Whenever a sample is drawn,<br />
there is a risk that it may not be truly representative and therefore yield data that do not<br />
reflect the true situation. When sampling in areas that lack precise population data, selection<br />
bias may occur during the survey design. Data obtained only from health services, or from<br />
the most accessible villages are unlikely to be representative of the population as a whole,<br />
and these approaches contribute to selection bias.<br />
9
The two-stage cluster sampling technique described here adequately ensures<br />
representativeness through randomization in selection and elimination of selection bias. The<br />
sampling strategy and the methods of analysis recognize and compensate for the fact that<br />
there may be some inaccuracy and allows for a range of values within which the actual rate in<br />
the entire population almost certainly lies. In addition, the potential for selection bias was<br />
reduced at the field level. The community mobilization ensured that most village members<br />
were in their homes on the appointed dates, and every effort was made to return to the homes<br />
of absentees.<br />
It is possible for interviewer bias to occur when enumerators gather information<br />
differentially. However, only 4 enumerator teams were used which leads to a more consistent<br />
method of data collection, thereby minimizing bias. The pre-test for the survey teams in<br />
Madax Warabe reinforced uniform data collection methods.<br />
The survey design served to minimize recall bias by addressing only the most recent<br />
occurrence of disease or pregnancy. Furthermore, the questionnaire was restricted to closedended<br />
questions and standardized responses.<br />
Finally, age reporting may pose a challenge in communities without vital registration<br />
systems. Reporting for the youngest ages (
91% of households surveyed were permanent residents. The mean household size was 7.4<br />
persons, and the median was 6 persons. The mean number of children under 5 years old was<br />
1.8 children, and the median 2 children per household.<br />
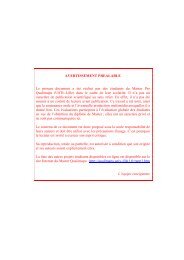
The primary occupation among households interviewed was farming (37.8%), and a<br />
significant proportion of respondents identified themselves as laborers (35.4%).<br />
Figure 2. Primary Occupation<br />
35%<br />
Disease Prevention Knowledge<br />
Approximately 15.7% of the respondents could not name one disease preventable by<br />
vaccines. A large proportion of mothers (40.7%) proposed alternative cholera prevention<br />
methods that are considered ineffective. Recitation of the Koran and prayer were cited most<br />
often, and these methods were not included in the index of disease prevention knowledge.<br />
Knowledge of malaria prevention was more accurate, and approximately 94.7% of mothers<br />
could name 1 or 2 modes of prevention.<br />
EPI Coverage<br />
3%<br />
7%<br />
3%<br />
Table 3. Child Vaccinations<br />
7%<br />
8%<br />
Vaccination Confirmed by Card Mother’s Report Confirmed by Scar<br />
(%)<br />
(%)<br />
(%)<br />
DPT1 50.8 69.7<br />
DPT2 29.8 40.4<br />
DPT3 16.0 23.2<br />
OPV at BIRTH 2.1 5.4<br />
OPV1 48.5 67.2<br />
OPV2 28.1 39.5<br />
OPV3 17.2 25.0<br />
Measles 44.7 59.2<br />
BCG 48.8 65.4 62.7<br />
38%<br />
Farmer<br />
Pastoralist<br />
Farmer and Pastoralist<br />
Businessman<br />
Wage earner<br />
Laborer<br />
Other<br />
11
Child Vitamin A Supplementation<br />
57.5% of surveyed mothers reported that their child had received one Vitamin A dose and<br />
41.0% had a dated card to confirm this report. 11.5% of the mothers reported a second dose<br />
and 6.1% was confirmed with a dated card.<br />
Maternal Health<br />
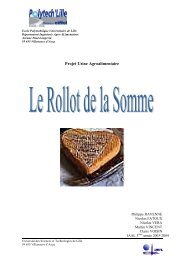
Coverage rates for Tetanus Toxoid (TT) vaccinations were low with 1 dose at 58.9% by selfreport.<br />
The proportion of women who received 2 doses of TT was 30.6%. Rates for<br />
subsequent doses declined consistently to 1.4% for the 5 th dose. The percentage of women<br />
who had cards to confirm at least 2 tetanus vaccines was approximately 2 times lower than<br />
rates from self-reports.<br />
Figure 3. Mother Tetanus Toxoid Coverage<br />
Percent<br />
70<br />
60<br />
50<br />
40<br />
30<br />
20<br />
10<br />
0<br />
TT1 TT2 TT3 TT4 TT5<br />
Most mothers surveyed did not receive antenatal care for the most recent pregnancy. Among<br />
the 14.4 % who received antenatal care, a trained TBA or midwife most often provided the<br />
services. Also, 80% (or 24) of these women received repeated consultations. In total, only<br />
11.5% of mothers received 2 or more consultations from a trained TBA, midwife, or doctor.<br />
The timing of antenatal care was measured, and it was observed that very few women (4 of<br />
209) received antenatal care during the first trimester.<br />
Iron supplementation for pregnant mothers was measured by asking whether mothers<br />
received ferrous folic packs during their most recent pregnancy. Approximately 19.5% of<br />
those surveyed reported receiving these tablets during pregnancy. The postpartum rate for<br />
iron supplementation was lower at 14.4%. A small proportion of mothers (13.5%) received<br />
Vitamin A after their last delivery.<br />
98.1% of women surveyed delivered their most recent child in the home, and 81.8% of the<br />
deliveries were attended by untrained traditional birth attendants. IMC trained TBA attended<br />
10.5% of the deliveries.<br />
7.7% of mothers received 2 or more postnatal consultations from a trained TBA, midwife, or<br />
doctor.<br />
Dose<br />
Confirmed by card<br />
Self-report<br />
12
In order to assess the risk for maternal mortality, mothers were surveyed regarding the total<br />
number of pregnancies. Among all mothers, 52.2% have had 5 or more pregnancies. Of 209<br />
mothers surveyed, 96.1% of the most recent pregnancy was a live birth.<br />
Child Morbidity<br />
Measures of child morbidity were limited to cases of diarrhea and respiratory infections<br />
during the two weeks prior to the interview date. The overall prevalence of diarrhea among<br />
children surveyed was 25.6%, and the rates were highest (36.3%) in the 13 – 24 month age<br />
group. The 49 - 59 month group experienced the lowest prevalence (1.1%) of diarrhea.<br />
Respiratory infection rates were found to be high (55.6%), with a range from 5.6% among 0 -<br />
6 month old children to 25% in the 25 - 36 month group.<br />
Child Mortality<br />
The mortality rate for children under 5 years old was measured by asking whether a family<br />
experienced a child death during the last 12 months. The number of under 5 child deaths was<br />
divided by the sum of surviving and deceased children of the mothers interviewed. The<br />
figure of 65.2 is expressed as per 1000 children per year.<br />
In the event of a death, the cause of death was also recorded. Diarrhea (23.1%), malnutrition<br />
(19.2%), and malaria (19.2%) contribute to the greatest number of deaths.<br />
Child Feeding Practices<br />
Colostrum was given to 83.1% of children. However, 80.2% of children did not receive<br />
colostrum until the second or third day after parity. These mothers were asked the reason for<br />
waiting. 53.4% responded that it was due to traditional beliefs whereas a significant<br />
proportion of mothers reported that there was “no milk.”<br />
Child feeding practices recommended by WHO/UNICEF are:<br />
• Exclusive breastfeeding from birth to 4-6 months<br />
• Continued breastfeeding through 24 months<br />
• Introduction of complementary foods at 6 months<br />
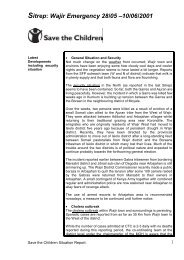
The rate of exclusive breastfeeding (EBF) among children up to 6 months of age was 64.0%.<br />
EBF was continued for 10.4% of children in the 7 – 12 month age group. 43.9% of children<br />
between 7 and 24 months did not have breast milk included in their diet. Among children<br />
over 24 months, 6.0% still received breast milk. The transition from EBF to introducing<br />
complementary foods was acceptable, with a gradual period of weaning.<br />
13
Figure 4. Child Feeding Practices<br />
Percent<br />
Similarly, Figure 5. presents the time periods for breastfeeding. The majority of children<br />
receive breastmilk for more than 1 year, and the next subset of children continue to be<br />
breastfed until the mother’s next pregnancy.<br />
Figure 5. Duration of breastfeeding<br />
Feeding frequency was highest (46.4%) at 3 times per day, and only a quarter of children<br />
receive food 5 or more times per day. Among children less than 24 months old, 46.3 % were<br />
fed 5 or more times per day.<br />
Mothers stopped breastfeeding (42.2%) and provided less food to 54.0% of children with<br />
diarrhea.<br />
Child Nutrition<br />
100%<br />
80%<br />
60%<br />
40%<br />
20%<br />
0%<br />
29%<br />
0 to 6<br />
7 to 12<br />
1%<br />
13 to 24<br />
4%<br />
52%<br />
25 to 36<br />
Age (months)<br />
14%<br />
3 months<br />
6 months<br />
1 year<br />
More than 1 year<br />
Next pregnancy<br />
In theory, a sample size of 900 children is recommended for a two-stage cluster<br />
anthropometric assessment. In our survey, 904 children 6 – 59 months were measured and<br />
37 to 48<br />
No BF<br />
BF plus complementary<br />
foods<br />
Exclusive BF<br />
14
weighed. However, due to instances of incomplete data recording, our final sample size was<br />
874. Measurements for 874 children well exceed the calculated sample size of 768 children<br />
which takes into account a maximum tolerable error of 5% and the prevalence of malnutrition<br />
at 50%, an extremely conservative estimate. Please refer to sample size calculations above<br />
for further clarification.<br />
Many ages are misreported with age biasing towards the full years (i.e. the child is 1 year if<br />
she is in fact 10 months). In an effort to distribute evenly the peaks usually seen at these<br />
values, the age classes reported here are centered around the months representing full years:<br />
12 months (6-17 months), 24 (18-29), 36 (30-41), and 48 (42-53) months. The age and sex<br />
distribution for the survey sample reflects that all groups are equally represented, and hence,<br />
no selection bias has occurred.<br />
Figure 6. Distribution according to age and sex, children 6-59 months, El Berde/Rabdure<br />
Districts, 2000<br />
Age (months)<br />
54 - 59<br />
42 - 53<br />
30 - 41<br />
18 - 29<br />
6 to 17<br />
0 5 10 15 20 25<br />
% Distribution<br />
Age Male<br />
Female<br />
Total<br />
N % N % N %<br />
6 – 17 months 88 19.9 70 16.3 158 18.1<br />
18 – 29 months 87 19.6 85 19.7 172 19.7<br />
30 – 41 months 102 23.0 101 23.4 203 23.2<br />
42 – 53 months 89 20.1 94 21.8 183 20.9<br />
54 – 59 months 77 17.4 81 18.8 158 18.1<br />
Total 443 100.0 431 100.0 874 100.0<br />
Table 2. Nutritional status by weight/height indicators<br />
Female<br />
Male<br />
Global Severe<br />
W/H Z-score 13.7 % (10.5 to 16.4) 3.8 % (1.3 to 6.3)<br />
W/H % of median 7.9 % 1.0 %<br />
15
Table 3. Distribution according to weight/height index in Z-scores or presence of oedema by<br />
age groups.<br />
Age -3 & -2 Z-scores Oedema<br />
N % N % N % N %<br />
6 – 17 months 7 33.4 11 12.6 136 18.1 4 33.3<br />
18 – 29 months 4 19.0 21 24.2 144 19.1 3 25.0<br />
30 – 41 months 5 23.8 17 19.5 178 23.6 3 25.0<br />
42 – 53 months 4 19.0 26 29.9 151 20.0 2 16.7<br />
54 – 59 months 1 4.8 12 13.8 145 19.2<br />
Total 21 100.0 87 100.0 754 100.0 12 100.0<br />
6 – 59 months 2.4 % 9.9 % 86.3 % 1.4 %<br />
Figure 7. Prevalence of malnutrition by age groups.<br />
Percent<br />
20<br />
15<br />
10<br />
5<br />
0<br />
13.9<br />
7<br />
16.3<br />
4.1<br />
12.3<br />
3.9<br />
Global acute malnutrition was found in 13.7%. 1.4 % of children surveyed were assessed as<br />
having oedema, and these children were classified as severely malnourished. Children in the<br />
younger age group (6 – 29 months) made up a greater proportion of those with global<br />
malnutrition (15.2%). Severe malnutrition in the survey population was also more prevalent<br />
in the 6 – 29 month age group. Among the boys, 13.8% were assessed as malnourished, and<br />
severe malnutrition was found in 4.3%. Of the girls, 13.7% had global malnutrition and 3.2%<br />
had severe malnutrition. Expressed as a percentage of the median, the prevalence of global<br />
malnutrition is 7.9% and severe malnutrition at 1.0%.<br />
17.5<br />
3.3<br />
8.2<br />
0.6<br />
6 to 17 18 - 29 30 - 41 42 - 53 54 - 59<br />
Age groups (months)<br />
Global<br />
Severe<br />
16
Table 4. Distribution according to age and sex.<br />
Sex<br />
Age (months) Male<br />
Female<br />
Total<br />
N % N %<br />
N<br />
6 – 29 175 53.0 155 47.0 330<br />
30 - 59 268 49.3 276 50.7 544<br />
Total 443 431 874<br />
Table 5. Distribution according to W/H Z-scores or presence of oedema by sex.<br />
Sex > -3 & < -2<br />
< -3<br />
Oedema<br />
N % N % N %<br />
Male 42 53.8 11 52.4 8 66.7<br />
Female 45 46.2 10 47.6 4 33.3<br />
Total 87 100.0 21 100.0 12 100.0<br />
Table 6. Distribution according to W/H Z-scores or presence of oedema by age groups.<br />
Age<br />
> -2<br />
Z-score<br />
> -3 & < -2<br />
< -3<br />
Oedema<br />
(months) N % N % N % N %<br />
6 - 29 280 37.1 32 36.8 11 52.4 7 58.3<br />
30 - 59 474 62.9 55 63.2 10 47.6 5 41.7<br />
6 - 59 754 100.0 87 100.0 21 100.0 12 100.0<br />
Table 7. Distribution according to nutritional status and age.<br />
Age<br />
6 – 29 months<br />
30 - 59 months<br />
Global acute malnutrition<br />
Proportion 95% Confidence Interval<br />
15.2 % 9.7 % to 20.7 %<br />
12.9 % 8.9 % to 16.9 %<br />
Table 8. Distribution according to nutritional status and age.<br />
Age<br />
6 – 29 months<br />
30 - 59 months<br />
Severe acute malnutrition<br />
Proportion 95% Confidence Interval<br />
5.5 % 2.0 % to 9.0 %<br />
2.8 % 0.8 % to 4.8 %<br />
17
Table 9. Distribution according to W/H % of median by sex.<br />
% of median Male<br />
Sex<br />
Female<br />
Both<br />
N % N % N %<br />
< 80 % 33 7.6 35 8.2 68 7.9<br />
< 70 % 3 0.7 6 1.4 9 1.0<br />
Discussion<br />
During 1999, UNICEF supported health services in Rabdure District through IMC in<br />
provision of immunization services through outreach teams. By the end of the year, IMC had<br />
halted their PHC program in El Berde and Rabdure Districts. Once again, IMC currently<br />
supports a MCH center in both districts. Although their presence in these districts have not<br />
been continuous, these figures indicate that some impact has been made with respect to both<br />
health status and knowledge.<br />
A majority of the survey population is familiar with appropriate methods of preventing<br />
disease. Approximately 84% of mothers could name at least one vaccine preventable disease.<br />
Knowledge of malaria prevention was also adequate. A large proportion of mothers rely on<br />
prayer and recitation of the Koran to prevent cholera. Many respondents cited treatments<br />
such as ORS as preventive measures against cholera. Responses to these questions indicate<br />
that health education should also emphasize the difference between effective methods of<br />
prevention and curative methods.<br />
The program goal for the proportion of mothers who receive antenatal care is 70% in El<br />
Berde District and 40% in Rabdure District. At present, a small proportion (14.4%) reported<br />
an antenatal consultation from trained staff for their most recent pregnancy. It is possible that<br />
the mothers who had access to antenatal care consulted with a trained TBA or midwife from<br />
UNICEF or IMC. Optimally, antenatal care is initiated during the first trimester of<br />
pregnancy, but this small percentage of women was provided consultations in the latter<br />
months of their pregnancy.<br />
A slightly higher proportion of mothers (19.5%) received iron supplementation during their<br />
most recent pregnancy. It seems apparent that these mothers may have received their ferrous<br />
folic packs during the antenatal consultations.<br />
Women of childbearing age (15 - 45 years) have been identified as a segment of the<br />
population requiring special health care provisions. A lack of hygienic delivery conditions or<br />
cutting the umbilical cord with dirty instruments increase the likelihood of tetanus infection<br />
in both the mothers and neonates. Vaccinating pregnant women with Tetanus Toxoid (TT)<br />
protects both the mothers and unborn children against this infection. At the time of survey,<br />
30.6% received 2 doses (self-report), and 14.4% confirmed receiving 2 doses with a card.<br />
IMC has proposed program targets of having women up to 40 days post partum to receive at<br />
least 2 Vitamin A doses in order to increase the Vitamin A stores protecting both her and her<br />
child through lactation. 13.5% of mothers reported receiving the recommended 2 doses after<br />
18
their last delivery. Also, 2 doses per year of Vitamin A are distributed to children between 6<br />
months and 6 years. 11.5% of children received 2 doses as reported by mothers, and 6.1%<br />
was confirmed by card.<br />
A major preventive aspect of PHC is providing protection against the six vaccine-preventable<br />
diseases: tuberculosis, diphtheria, pertussis, tetanus, polio and measles. Considering the<br />
relatively scattered population in Somalia and frequent interruption of services due to<br />
unpredictable security, all unvaccinated children under 5 years of age are included for EPI.<br />
During 1999, UNICEF supported health services in Rabdure District through IMC in<br />
provision of immunization services through outreach teams, and the results of that effort and<br />
current IMC EPI campaigns are indicated by the following numbers in both districts. The<br />
program goal was set for fully vaccinating 50% of children less than 5 years old.<br />
Approximately 50% of children surveyed (confirmed with card) have received the first round<br />
of vaccines. Subsequent doses were much lower with DPT3 and OPV3 slightly over 15%. It<br />
will take continued effort by the EPI teams to fully immunize these children by the end of the<br />
grant period.<br />
The reported child morbidity rates were 55.6% for acute respiratory illness and 25.6% for<br />
diarrhea during the two weeks prior to the survey. Unhygienic food preparation due in part to<br />
polluted water may explain the high prevalence of diarrhea. Children in the younger age<br />
group (1 – 24) had a greater proportion of diarrhea cases (69.2%). These children are<br />
expected to have comparatively higher rates of diarrhea because they have begun to eat<br />
complementary foods. The complementary foods commonly introduce gastrointestinal<br />
contaminants for the first time. Further, children in this age group begin to crawl and have a<br />
tendency to put any number of foreign objects in their mouths. In contrast, the incidence of<br />
respiratory illness was distributed approximately equally for both young and old age groups<br />
(46.6% and 53.4%, respectively). There is little vegetation in this region to hold the soil in<br />
place, and the climate during the survey period was dry and windy. Constant exposure to<br />
dust may contribute to already deteriorating health resulting from disease and poor nutrition.<br />
The data for El Berde and Rabdure Districts indicate that 13.7% of 874 children screened<br />
were moderately or severely malnourished with oedema. This estimate is 16.3% lower than<br />
the level of malnutrition found by UNICEF in their nutrition survey for Rabdure Town in<br />
February 2000. Notably, the proportion of severely malnourished children is 3.8% in this<br />
district, whereas an estimate of 6.0% was reported for Rabdure Town, one of the most<br />
devastated areas. However, our survey included villages from two districts, not one town and<br />
its satellite villages. In addition, the UNICEF survey screened only 498 children. Finally,<br />
this difference may also be attributed to both humanitarian efforts and natural circumstances<br />
in the past year. UNICEF initiated supplementary feeding of UNIMIX and BP5 at the<br />
beginning of December 1999 to 1000 malnourished children under the age of 5 in Rabdure<br />
Town and surrounding villages. WFP continues its food distribution in this region, and the<br />
region has sustained an extended period of stability and security. Moreover, there have been<br />
no environmental crises – resulting in favorable harvests.<br />
Children between 6 and 29 months appear to be more vulnerable with a greater prevalence of<br />
global acute malnutrition (15.2% vs. 12.9 % for the older group). A slight difference exists in<br />
the rates for severe malnutrition, as well. The global malnutrition is distributed evenly<br />
between the boys and girls in our sample.<br />
19
An analysis of child feeding practices may provide insight to the malnutrition and morbidity<br />
rates found in this district. 80.2% of mothers waited until the second or third day after parity<br />
to begin breastfeeding, thereby reducing the full potential for receiving maternal antibodies.<br />
Then, only 64% of infants less than 6 months were exclusively breastfed, and 43.9% of<br />
children between 7 and 24 months did not even receive breast milk. These breastfeeding<br />
practices may correspond to the high rates of global malnutrition and the prevalence of<br />
diarrhea (69.2%) observed for 1 - 24 month old children. In addition, mothers stopped<br />
breastfeeding (42.2%) and provided less food to 54% of children with diarrhea. Premature<br />
introduction of weaning foods or withholding breast milk entirely may deprive these children<br />
of the full nutritional and immunological benefits of breast milk.<br />
The rates for severe malnutrition were highest in the 6 - 17 month age group, and the rates<br />
may stem from these problematic breastfeeding practices, but it is likely that these children<br />
also suffer from illnesses that exacerbate their nutritional status.<br />
Global malnutrition rate of 13.7% is considered serious, and selective supplementary feeding<br />
of malnourished children is of high priority. IMC has an integrated nutrition program in the<br />
MCH activities, and it serves to respond to both seasonal nutritional crises and general<br />
prevalence of malnutrition. Education efforts should continue to address the necessity of<br />
prompt and exclusive breastfeeding in the first 6 months, timely introduction of<br />
complementary foods, and increased feeding to children with diarrhea. Considering that<br />
breastfeeding as a means of contraception is certainly fallible, alternate family planning<br />
methods should be emphasized so that infants less than 6 months of age can receive<br />
breastmilk for the recommended duration. When compared with Huddor District, it appears<br />
that the women and children of both El Berde and Rabdure Districts are benefiting from the<br />
efforts of IMC field staff and their counterparts. In the coming year, accurate and complete<br />
growth monitoring will play a crucial role in assessing changes in nutritional status.<br />
20
List of Tables and Figures<br />
Residence status 10<br />
Primary occupation 11<br />
Child vaccinations 11<br />
Mother tetanus toxoid coverage 12<br />
Child feeding practices 14<br />
Duration of breastfeeding 14<br />
Distribution according to age and sex,<br />
children 6-59 months 15<br />
Nutritional status by weight/height indicators 16<br />
Distribution according to W/H index in Z-scores<br />
or presence of oedema by age groups 16<br />
Prevalence of malnutrition by age groups 16<br />
Distribution according to age and sex 17<br />
Distribution according to W/H Z-scores<br />
or presence of oedema by sex 17<br />
Distribution according to W/H Z-scores<br />
or presence of oedema by age groups 17<br />
Distribution according to nutritional status and age (global) 17<br />
Distribution according to nutritional status and age (severe) 18<br />
Distribution according to W/H % of median by sex 18<br />
<strong>Page</strong><br />
21
Bibliography<br />
The Field Atlas of Settlements in Somalia. United Nations Development Office for Somalia,<br />
UNDP, 1999.<br />
The Management of Nutrition in Major Emergencies. World Health Organization, Geneva,<br />
2000, Annex 3 & 4.<br />
Nutrition Guidelines. Medecins Sans Frontieres, Paris, 1995, pp. 37-72.<br />
Nutrition Survey: Recommendations for Somalia. Nutrition Working Group, Nairobi,<br />
Kenya, March 1999.<br />
Nutrition Survey Report Conducted in Huddor Town. UNICEF: South/Central Zone of<br />
Somalia, Baidoa Office, September 1999.<br />
Nutrition Update. Food Security Assessment Unit, Somalia, May 2000.<br />
Project Proposal for Emergency Health Intervention. Submitted to OFDA by International<br />
Medical Corps, Bakool Region, Somalia, February 2000.<br />
Refugee Health: An Approach to Emergency Situations. Medecins Sans Frontieres, 1997.<br />
22