Experiments with Supersonic Beams as a Source of Cold Atoms
Experiments with Supersonic Beams as a Source of Cold Atoms
Experiments with Supersonic Beams as a Source of Cold Atoms

Create successful ePaper yourself
Turn your PDF publications into a flip-book with our unique Google optimized e-Paper software.
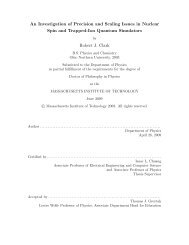
Figure 3.18: This shows the decay in the reflected intensity from a p<strong>as</strong>sivated silicon<br />
crystal over time. The red data comes from a normal data run <strong>with</strong> the rotor spinning.<br />
The rotor is periodically stopped to me<strong>as</strong>ure the reflected intensity. The red curve is<br />
a le<strong>as</strong>t square fit <strong>of</strong> this decay <strong>as</strong> a double exponential. The data shown in black is<br />
the reflected intensity from a dedicated intensity run <strong>with</strong>out spinning the rotor and<br />
where the RGA is only on to me<strong>as</strong>ure the reflected intensity, except for the period<br />
noted in the figure where the RGA is left on deliberately to observe its effect.<br />
on to me<strong>as</strong>ure the reflected intensity at specific intervals. The RGA is also left on for<br />
a specific interval to observe its effect directly.<br />
This data set, along <strong>with</strong> the me<strong>as</strong>urement <strong>of</strong> the decay from a normal data<br />
run is shown in figure 3.18. The red data comes from a normal data run <strong>with</strong> the<br />
rotor spinning. The rotor is stopped at certain times to me<strong>as</strong>ure the static reflected<br />
intensity, and these me<strong>as</strong>urements are shown in red. The red curve is a le<strong>as</strong>t square<br />
fit <strong>of</strong> the decay <strong>as</strong> a double exponential decay <strong>with</strong> time constants <strong>of</strong> 2.5 and 38.5<br />
minutes. The data shown in black is the reflected intensity where the RGA is only<br />
on me<strong>as</strong>ure the reflected intensity (about 1 minute) for each me<strong>as</strong>urement, except for<br />
the period noted in the figure where the RGA is left on deliberately to observe its<br />
effect. The rotor is not spun during the taking <strong>of</strong> this data set. As seen in the figure,<br />
53