When Should Software Firms Commercialize New Products ... - MISRC
When Should Software Firms Commercialize New Products ... - MISRC
When Should Software Firms Commercialize New Products ... - MISRC

You also want an ePaper? Increase the reach of your titles
YUMPU automatically turns print PDFs into web optimized ePapers that Google loves.
<strong>When</strong> <strong>Should</strong> <strong>Software</strong> <strong>Firms</strong> <strong>Commercialize</strong> <strong>New</strong><br />
<strong>Products</strong> via Freemium Business Models?<br />
Marius F. Niculescu and D.J. Wu<br />
College of Management, Georgia Institute of Technology, Atlanta, GA 30308<br />
{marius.niculescu, dj.wu}@mgt.gatech.edu<br />
Version: 12/3/2010<br />
Abstract<br />
In the software industry, a challenge firms often face is how to effectively commer-<br />
cialize their product innovations. One interesting and emerging business model en-<br />
trepreneurs often embrace, called freemium, combines “free” and “premium” consump-<br />
tion in association with a product or service. In a nutshell, the model involves giving<br />
away for free a certain level or type of consumption while making money on premium<br />
consumption. We develop a novel and formal multi-period microeconomic framework<br />
with network externalities embedded into consumer learning in order to capture the<br />
essence of several key freemium business models such as feature-limited or time-limited,<br />
and further extend this framework to market seeding. We solve the firm’s optimal pric-<br />
ing problem under each of these models. We fully characterize conditions under which<br />
freemium models are superior to conventional for-fee models and seeding models, de-<br />
pending on consumer priors on the value of individual software modules, perceptions of<br />
cross-module synergies, and overall value distribution across modules. One surprising<br />
finding is that uniform seeding is always dominated by either freemium models or con-<br />
ventional for-fee models. Finally, we discuss managerial and policy implications based<br />
on our analysis. Interestingly, we show that freemium, in one form or another, is always<br />
preferred from the social welfare perspective, and we provide further guidance on when<br />
the firm needs to be incentivized to align its interests with the society’s.<br />
Key words: software markets; freemium business models; economics of IS; software<br />
diffusion and adoption; software versioning; seeding strategies; product sampling<br />
Preliminary Draft: Please do not cite or quote without the authors’ written permission.<br />
Comments are most welcome.<br />
1
1 Introduction<br />
Efficient diffusion of a product innovation represents a challenge faced by many firms in<br />
the software industry. Conventional models, whereby the entire product or each sepa-<br />
rate module comes with an associated price, represent a legacy of the early stages of the<br />
software industry that still endures to the present day (e.g., various versions of Apple or<br />
Microsoft Windows operating systems). Nevertheless, the software market infrastructure<br />
and ecosystem have experienced a sea change over the past couple of decades. On one<br />
hand, information technology performance-to-price ratio increased significantly and user<br />
interfaces became much more friendly, accelerating the adoption of computers towards sup-<br />
porting activities on both professional and personal levels, which, in turn, led to software<br />
becoming ubiquitous to the functioning of our society. According to Datamonitor (2009),<br />
the size of the rapidly growing global software market was $303.8 billion in 2008 and is<br />
estimated to reach $457 billion by 2013. On the other hand, Internet penetration and usage<br />
grew at a staggering rate, with current statistics reporting over 1.96 billion Internet users<br />
and over 681 million interconnected Internet hosts worldwide (Internet World Stats 2010,<br />
ISC 2010). This led to the emergence of online software distribution models (e.g., online<br />
software marketplaces such as Apple App Store, Google Apps Marketplace, Microsoft on-<br />
line store, or repositories such as SourceForge.net), online software consumption models<br />
(e.g., software-as-a-service offerings such as Salesforce.com CRM suite or GE’s Centricity<br />
Electronic Medical Records service), as well as online feedback models that strengthen the<br />
word-of-mouth effects (Dellarocas 2003).<br />
Inresponsepartlytothisparadigmshift,anewsoftwarebusinessmodel,calledfreemium<br />
(Anderson2009), hasemerged, combining“free”and“premium”consumptioninassociation<br />
with a product or service. In a nutshell, the model involves giving away for free a certain<br />
level or type of consumption while making money on premium consumption. Freemium<br />
models are spreading quickly in the software industry, especially among Web start-ups<br />
(Miller 2009).<br />
Twoof the most commonly encountered freemiummodels arefeature-limited freemiums<br />
(FLF) and time-limited freemiums (TLF) (Anderson 2009, p. 245). FLF models involve<br />
offering a basic version of the product with limited functionality for free, while charging for<br />
additionalfeaturesinthepremiumversion. Yahoo! forexample, offersbasicemailservicefor<br />
2
free, but charges for its premium Mail Plus service that includes value-adding features such<br />
as live customer care and mail forwarding. Skype, an Internet-based telecommunications<br />
company, allows free PC-to-PC voice communication and free text messaging, but charges<br />
users for voice calls to landline or mobile phone numbers. Many PC video game developers<br />
use free demos allowing limited gameplay in order to entice potential customers into buying<br />
the full version. TLF models, on the other hand, allow users free access to the full version<br />
of the software product, but only for a limited period of time. At the expiration of the free<br />
trial period, the software locks itself and users have to purchase a registration key in order<br />
to continue to use it. For example, Adobe Photoshop CS 5 and Microsoft Office 2010 come<br />
with a 30-day and a 60-day free trial, respectively.<br />
Hybrids between FLF and TLF models also exist. For example, for the past several<br />
years, Adobe’s strategy was to offer its basic pdf reader for free. However, it charges for<br />
the premium features in its Acrobat full-version product but it allows users to download a<br />
30-day free trial of this premium version with complete functionality. Online radio service<br />
Pandora, which allows users to customize their stations, offers free basic service (access<br />
via web browser, 40 listening hours per month, lower sound quality) while charging for<br />
its premium Pandora One service (desktop application, unlimited listening, higher sound<br />
quality). TexPoint add-in for Microsoft Powerpoint, which facilitates embedding LaTeX<br />
into slides, locks some of the premium features after a free trial while basic functionality<br />
continues to be available for free.<br />
Freemium models challenge not only conventional for-fee business models but also mar-<br />
ket seeding models which have been increasingly employed in software commercialization.<br />
Market seeding is a business model that is different than conventional marketing such as<br />
advertising and free demonstration, whereby firms give away the whole full-functionality<br />
product to a percentage of its addressable market to jump-start adoption. Autodesk, a<br />
leader in professional design and engineering software, announced in 2009 an initiative to<br />
seed 100 early-stage clean tech companies with free software bundles each worth approx-<br />
imately $150,000 (Autodesk 2009). Microsoft, through its DreamSpark student program,<br />
offers free professional-grade software developer and designer tools to millions of college and<br />
high school students around the world (Microsoft 2008).<br />
The feasibility of the freemium models is predicated on many features of software prod-<br />
3
ucts. First, software products nowadays are increasingly built using a modular architecture<br />
which, in turn, facilitates grouping, separating, or locking certain features. Second, it is<br />
relatively easytoembedinsoftwareprogramstrial-expiration clocksassociated withfeature-<br />
locking mechanisms. Third, software products are digital goods with negligible marginal<br />
reproduction cost, that can be provided in unlimited supply and can be “shipped” via rela-<br />
tively cheap online distribution channels. This way, absolutely all interested customers have<br />
access to the free consumption opportunities embedded in the freemium offering. Fourth,<br />
software products often belong to the category of experience goods. By trying (sampling)<br />
the product or part of it before committing to any purchase, consumers could learn more<br />
about the quality and other attributes (such as speed, functionality, and features) of the<br />
software, capabilities of related modules, compatibility issues, hardware requirements, etc.<br />
It remains largely unknown how well these freemium models fare, compared with con-<br />
ventional and well established business models. As illustrated by the examples above,<br />
freemium models are applied nowadays in both software-as-a-service markets as well as<br />
markets for software products characterized by a one-time purchase and designed to run<br />
autonomously on the consumers’ hardware. In this paper, we focus on the latter. Moti-<br />
vated by inquiries from entrepreneurs, we advance a unified multi-period framework that<br />
accounts for word-of-mouth effects and cross-module synergies and can capture the essence<br />
of several software business models, including freemium and seeding ones. We use this<br />
framework in particular to derive the equilibrium for each model and fully characterize<br />
conditions under which freemium models are superior to conventional charge-for-everything<br />
and seeding models. We further compare freemium models against each other. To the best<br />
of our knowledge, this represents the first extensive analytical benchmarking study that<br />
juxtaposes for-fee, freemium, and seeding models. Our results indicate that, while seeding<br />
models are always dominated, the conventional for-fee model and the freemium models can<br />
each be optimal in separate regions of the feasible space. We also address policy implica-<br />
tions by demonstrating that switching from conventional or seeding models to freemium<br />
models always increases social welfare. Matching welfare results with the profit analysis,<br />
we also explore cases when the firm should be subsidized (i.e., when the interests of the firm<br />
and the society are not well aligned).<br />
The rest of the paper is organized as follows. §2 presents a summary of the relevant<br />
literature. In §3, we introduce the general models. In §4, §5, and §6, we derive the optimal<br />
4
strategy of the software firm under baseline, freemium, and seeding models. In §7, we run<br />
comparative statics on these strategies. In §8, we conduct a social welfare analysis and<br />
explore policy implications. In §9, we summarize the conclusions of this study and present<br />
directions for further research. For brevity, all proofs have been put in the Appendix.<br />
2 Literature Review<br />
In this study, we draw mainly on three streams of research in IS economics and market-<br />
ing: software market segmentation via quality degradation and product versioning, product<br />
sampling and free demonstration, and market seeding.<br />
The first stream of extant work relevant to our research is on software market seg-<br />
mentation via versioning and quality degradation, which in turn draws on the well known<br />
economics literature on second-degree price discrimination (e.g., Mussa and Rosen 1978).<br />
In FLF models, vertical differentiation is achieved by offering the lower “quality” version<br />
(where quality can be measured in terms of performance, functionality, or content limita-<br />
tions) at no charge. There exists a rich literature (e.g., Raghunathan 2000, Bhargava and<br />
Choudhary 2001, 2008, Wei and Nault 2005, Jones and Mendelson 2010) that studies op-<br />
timal software versioning under various utility structures and market assumptions. Ghose<br />
and Sundararajan (2005) complement this line of work by empirically estimating the extent<br />
of quality degradation associated with software versioning, using a quadratic utility struc-<br />
ture. Wu and Chen (2008) further show how versioning can be used to deter digital piracy.<br />
Riggins (2003) and Cheng and Tang (2010) investigate cases where the low-quality product<br />
is offered for free in the context of unique web content and software products, respectively.<br />
In the former study, the firm monetizes giveaways through advertising revenues generated<br />
by the users of free websites, whereas in the latter (extending the models in Conner (1995)<br />
and also adding an aggregate consumer usage cost) the firm trades off consumer valuation<br />
upshift due to positive network effects vs. lost sales due to giveaways of the low-quality<br />
version.<br />
The underlying concept behind FLF models is also linked to the burgeoning literature<br />
of two-sided markets and platform strategies, that explores how firms may be able to boost<br />
adoption of premium products or features (the “money” side) by subsidizing the adoption<br />
of the basic functionality (the “loss” side). In doing so and compared with charging both<br />
5
sides, the firm profits more overall due to cross-side positive network effects. This literature<br />
largely focuses on pricing strategies for distinct but complementary products/markets, with<br />
significant interests in identifying the “money” side (Rochet and Tirole 2003, 2006, Parker<br />
and Van Alstyne 2005).<br />
A common assumption of all the above reviewed models is that customers have full<br />
information regarding the value of each product version, and they self-select into purchase<br />
groups according to the menus of price and quality offered by the vendors. Essentially,<br />
these models assume a pre-existing first period when customers were allowed to test fully<br />
functional versions prior to market release, followed by a second period when the versioned<br />
product is commercialized. While this stream of literature advances the theory behind<br />
optimal versioning, it does not explore in the first place whether or not the firm should fully<br />
inform customers with respect to product value prior to market release. Moreover, most of<br />
these models (with the exception of Raghunathan 2000, who presents a two-period model<br />
without network externalities) consider one-period frameworks, abstracting from adoption<br />
dynamics over time. In that sense, network effects are captured at the utility level (if at<br />
all) as usage benefits, ignoring community-induced consumer valuation learning over time<br />
via word of mouth. By employing a two-period framework with word-of-mouth effects to<br />
inspect how valuation learning and imperfect information on the consumer side affect the<br />
FLF offering and its performance relative to perfect information approaches such as TLF,<br />
we bring a significant contribution to the existing literature on software versioning.<br />
The second stream of literature relevant to our work is related to product sampling<br />
and free demonstration. These well studied marketing strategies are particularly appealing<br />
to digital goods, many of which are experience goods whose value is learnt by customers via<br />
tryingthegooditselforaversionofit(ChellappaandShivendu2005). Inpractice, freemium<br />
models do capitalize on this important characteristic of digital goods. While under TLF<br />
consumers gain full access to the software functionality through a free trial for a limited<br />
period of time and learn the true value of each feature, under FLF, they only adjust their<br />
priors on the value of premium features based on experiencing basic features but may not<br />
reach the true value. Therefore, in digital goods markets, net of advertising, word of mouth<br />
effects, or direct network effects, firms can influence individual consumers’ product value<br />
expectations by controlling the degree and type of free consumption. Thus, when comparing<br />
strategies side by side, the firm must account for the impact of its chosen business model<br />
6
on consumer perceptions, since, in turn, these perceptions affect sales. Acknowledging this<br />
effect, the literature on product sampling and free demonstration explores how firms can<br />
influence adoption by educating (some of) the customers on the value of the product. One<br />
lineofwork(e.g., Jainetal. 1995, HeimanandMuller1996, Heimanetal. 2001)accountsfor<br />
network effects andestablishes that customers change their priors on the productvalueafter<br />
sampling it. However, most of these models consider that sampling and free demonstrations<br />
are made available only to a limited audience due to substantial replication and distribution<br />
costs associated withphysicalgoods. Bawa andShoemaker(2004) consider theextremecase<br />
where samples are offered to the entire addressable market. In all of the above models, price<br />
is treated as exogenous rather than the firm’s strategic choice. Chellappa and Shivendu<br />
(2005) and Cheng and Liu (2010) extend this line of work by exploring sampling under<br />
endogenous pricing. The former study models a vertically differentiated market for digital<br />
goods where consumers do not know the true product value but can sample the goods<br />
through pirated versions. Thelatter study presents an analysis of the optimality of free trial<br />
software that is related to ours but approaches the problem under a different setting. Cheng<br />
andLiu(2010) modelthetradeoffbetweenreduceduncertaintyanddemandcannibalization,<br />
extending Cheng and Tang (2010) by adding free trial duration, thus allowing consumer<br />
belief updating over time. They identify conditions under which time-locked free trail is<br />
preferable and explore optimal stoping time for free trial. They also present a numerical,<br />
butnot analytical, profitcomparison between limited-time and limited-version (with perfect<br />
information) models. Our setting and analysis are rather different than theirs. Among<br />
others, wecompareanalytically alargersetofbusinessmodels(includingseedingstrategies),<br />
and our modeling framework accounts for cross-module synergies that impact valuation<br />
learning and incorporates multi-period adoption dynamics based on word-of-mouth effects.<br />
The third stream of extant work relevant to our research is on market seeding, whereby<br />
a ratio of the potential customers receive the full product for free. In that sense, seeding is<br />
another marketing strategy for the firm to influence consumer priors in order to jump-start<br />
adoption. Jiang and Sarkar (2003) explore the effect of limited product giveaways on future<br />
adoptionandnetpresentvalueoffuturesalesunderanexogenouspricingrule. Lehmannand<br />
Esteban-Bravo (2006) inspect optimal seeding under endogenized dynamic pricing, variable<br />
costs, and network externalities. Galeotti and Goyal (2009) analyze optimal seeding in<br />
a social network with a graph-like topology where decisions of individual customers are<br />
7
influenced by their immediate contacts. None of these studies, however, addresses how<br />
seeding models fare compared to freemium and conventional for-fee models, which we do.<br />
In summary, we contribute to the previous literature by integrating the above re-<br />
viewed isolated streams of research. We develop a general multi-period adoption framework<br />
with bi-dimensional consumer valuation learning accounting for both firm-induced effects<br />
(achieved by controlling the degree and type of free consumption) and community-induced<br />
word-of-mouth effects, thus capturing how consumer behavior evolves over time under dif-<br />
ferent business models. Based on this unified framework, we formulate, solve, and compare<br />
five business models: conventional for-fee, feature-limited freemium, time-limited freemium,<br />
simple seeding without first period selling, and complex seeding allowing first period selling.<br />
To the best of our knowledge, this is the first extensive analytical benchmarking of these<br />
business models. Our analysis generates a host of new and surprising insights. In particu-<br />
lar, we show that uniform seeding models are always dominated either by freemium mod-<br />
els or conventional for-fee models, whereas charge-for-everything (for-fee), feature-limited<br />
freemium, and time-limited freemium models each can be a dominating strategy, depending<br />
on consumer priors on the value of individual software modules, perceptions of cross-module<br />
synergies, and overall value distribution across modules. Moreover, we show that freemium,<br />
in one form (FLF) or another (TLF), is preferred from the social welfare standpoint, and<br />
we provide policy guidance on when the firm needs to be further incentivized to align its<br />
interests with the society’s.<br />
3 Models<br />
We assume that a firm develops a software product that has two modules A and B. Basic<br />
functionality is coded in module A, while module B incorporates premium features or<br />
content. The product (both modules) has a life span of two periods (after which it becomes<br />
obsolete or irrelevant) and the firm commits to selling the entire product (both A and B) or<br />
only part of it (give away A for free and sell only B) at a fixed one-time price p. Customers<br />
whopurchasetheproductinperiod1useitalsointhesecondperiodatnoadditionalcharge.<br />
Examples fromsoftware businesspractice whereconstant priceover timehas beencombined<br />
with freemium strategies include AutoCAD design software, DivX video software, WinEdt<br />
8
LaTeX scientific text editor, etc. 1 The firm is considering among five potential business<br />
models:<br />
(a) Charge-for-everything (CE). The firm sells both modules together (as one indivis-<br />
ible product) in both periods. No consumption degree or type is offered for free.<br />
(b) Feature-Limited Freemium (FLF). The firm gives away module A and sells only<br />
module B in both periods. 2<br />
(c) Time-Limited Freemium (TLF). The firm allows consumers to try both A and B<br />
for free but only during period 1, and sells both modules together (as one indivisible<br />
product) only during period 2.<br />
(d) Simple Seeding (SS). The firm gives away for free the product to a percentage of<br />
the addressable market (uniformly across consumer types) in both periods, and then<br />
sells both modules together (as one indivisible product) to the remaining consumers<br />
only during period 2 .<br />
(e) Complex Seeding (CS). The firm gives away for free the product to a percentage<br />
of the addressable market (uniformly across consumer types) in both periods, and in<br />
parallel, sells both modules together (as one indivisible product) during both periods<br />
to the remaining consumers.<br />
The firm is a profit maximizer. All software development costs are sunk and it is assumed<br />
that the costs associated with opening and locking features are negligible.<br />
We assume a normalized mass m = 1 of consumers with types θ distributed uniformly<br />
in the interval [0,1]. 3 A consumer of type θ derives per-period benefits aθ and bθ from<br />
using modules A and B, with a,b > 0. We consider a general setting where parameters a<br />
1 For the past several years AutoCAD, DivX, and WinEdt have exhibited constant list prices. Autodesk<br />
has been charging $3995 for a perpetual AutoCAD license while also allowing for a 30-day free trial. DivX<br />
video software bundle, comprising of video player, web browser player, codecs and plugins for various video<br />
formats has had a zero price tag for its basic version and a $19.99 price tag for its premium DivX Pro<br />
version. WinEdt has been priced at $40 per individual, non-business license but came with a 30-day free<br />
trial that consumers could use indefinitely, at the cost of enduring increasingly frequent pop-up reminders<br />
(after expiration of the free trial) to buy a license and register the product.<br />
2 It is worth mentioning that, in practice, in the case of FLF models, sometimes premium functionality<br />
is bundled together with basic functionality in the premium version of the product creating a complete<br />
stand-alone solution (e.g., Adobe Reader vs Adobe Acrobat). However, if A is offered for free, whether the<br />
premium functionality is delivered as an add-on (only B) or as a separate stand-alone solution (both A and<br />
B integrated in one product), consumer choice is the same due to incentive compatibility constraints.<br />
3 All results are valid for any value m > 0. The only change would be that we would need to adjust<br />
equation (1) to x2 = x1<br />
1− N1<br />
m<br />
+x N1<br />
m<br />
N1 = x1 + (x−x1), with x ∈ {a,b} and xi ∈ {ai,bi} for i = 1,2.<br />
m<br />
9
and b capture an aggregate benefit from the modules and are not necessarily linear in the<br />
numberoffeatures includedineach module, as usersmight valuevariousfeatures differently.<br />
Moreover, we include in parameter b all additional cross-module benefits that arise from<br />
using functionality in A and B jointly, which otherwise are not available to customers using<br />
module A as a stand-alone (e.g., under FLF model). For simplicity, we assume no time<br />
discount.<br />
We consider a market structure with information asymmetry. On one hand, we assume<br />
that prior to product introduction (before the beginning of period 1) potential customers<br />
do not know the true value for any of the modules but they have priors a0 = αa · a and<br />
b0 = αb ·b for these values, with αa, αb > 0. If no module is offered for free (model CE),<br />
consumers maintain their prior throughout period 1, i.e. a1 = a0, b1 = b0. We assume the<br />
same is true for the unseeded portion of the market under seeding models (SS, CS). In<br />
particular, under CS, we assume that sales and seeding occur in parallel during period 1,<br />
andtheword-of-mouth effect of seedingonconsumer valuation learningmanifests at theend<br />
of period 1, as further discussed in §6.2. Next, we assume that if A is offered for free (model<br />
FLF), then potential customers learn immediately value a and they update their estimate<br />
of b as b1 = (αb+δb)·b, with αb+δb > 0. With value of module A fully revealed, consumers<br />
may learn more about the value of premium features due to the existence of cross-module<br />
synergies. However, such an initiative on the firm’s behalf may also push consumers further<br />
away from the true value b (e.g., when αb ≤ 1 and δb < 0, or when αb ≥ 1 and δb > 0). If<br />
both modules are offered for free in period 1 (model TLF), then consumers immediately<br />
updatetheir priors to the truevalues, i.e., a1 = a and b1 = b. On the other hand, we assume<br />
that the firm has full information about parameters a, b, αa, αb, and δb, and incomplete<br />
information about consumers in the sense that it knows the consumer type distribution but<br />
does not know the specific type of any individual consumer.<br />
Regardless of the chosen business model, at the beginning of period 2, consumers who<br />
have not purchased the software in period 1 further adjust their beliefs about the non-free<br />
modules based on word-of-mouth effects (network externalities at the valuation learning<br />
level) generated by existing adopters. Word-of-mouth effects, as a form of social conta-<br />
gion, are commonly considered to affect adoption by influencing consumers’ perceptions of<br />
product value and attributes (Mahajan et al. 1984, Ellison and Fudenberg 1995) and are<br />
increasingly disseminated over the Internet (Dellarocas 2003, Duan et al. 2008, Trusov et al.<br />
10
Before release Beginning of period 1 Beginning of period 2<br />
CE, SS, CS a0 = αa ·a a1 = αa ·a a2 = a1 +N1 ·(a−a1)<br />
b0 = αb ·b b1 = αb ·b b2 = b1 +N1 ·(b−b1)<br />
FLF a0 = αa ·a a1 = a a2 = a<br />
b0 = αb ·b b1 = (αb +δb)·b b2 = b1 +N1 ·(b−b1)<br />
TLF a0 = αa ·a a1 = a a2 = a<br />
b0 = αb ·b b1 = b b2 = b<br />
Table 1: Dynamics of customer perceptions under models CE, SS, CS, FLF, and TLF.<br />
2009). Let Nt with t ∈ {1,2} denote the numberof consumers whoown by the end of period<br />
t the version of the software that is not free (whether they purchased it or were seeded).<br />
For a module X ∈ {A,B} with true value x ∈ {a,b} and prior x1, that was not offered for<br />
free in period 1, consumers update their valuation perception as follows:<br />
x2 = x1(1−N1)+xN1 = x1 +N1(x−x1). (1)<br />
The idea behind the word-of-mouth updating rule is that the larger the installed base of<br />
the product is, the more accurate the estimates of the potential customers with respect to a<br />
and b become. If adoption is very low in period 1, potential customers will not change their<br />
perception of the true module values much since they do not get a strong-enough signal. On<br />
the other hand, a high adoption in period 1 helps generating a lot of buzz about the product<br />
(module) and induces potential customers to adjust their priors very close to the true value.<br />
We assume that N1 is not public information and consumers cannot reverse-engineer the<br />
word-of-mouth signals to perfectly isolate the true value of x ∈ {a,b}. 4 If consumers learn<br />
the true value of either module A or B at the beginning of period 1 (i.e., a1 = a and/or<br />
b1 = b) due to free consumption offers (e.g., via FLF or TLF), then word-of-mouth effects<br />
will not change their valuation perception for that respective module. The evolution of the<br />
consumer perceptions over time for all models is summarized in Table 1.<br />
4 Since the market size is normalized to m = 1, N1 describes the penetration rate of the product in the<br />
market after one period. In real cases m = 1, and the equivalent model would have N1 replaced with N1<br />
m<br />
in equation (1), as stated in footnote 3. In the case of software products, which are often times released in<br />
large global markets, it is reasonable to assume that market size m (and, therefore, penetration rate N1) is<br />
usually unknown to consumers while firms have a much better understanding of it.<br />
11
We point out that our models can account for both underestimation (αa < 1, αb < 1,<br />
or αb +δb < 1) and overestimation (αa > 1, αb > 1, or αb +δb > 1) of the product value.<br />
Regardless of whether consumers overestimate or underestimate the product, the word-<br />
of-mouth effects push their perceptions of the true module value in the right direction. 5<br />
Underestimation of module value usually occurs when consumers do not know all features<br />
embedded in the module and do not realize its full potential. Overestimation can occur<br />
when consumers initially expect to use the software more than they would do in reality.<br />
Very large values of αa or αb may describe situations when the product contains flaws<br />
(bugs or compatibility issues) that prevent it from delivering its intended output. In that<br />
case, true values a and b are very small compared to consumer priors. However, after one<br />
period, customers who ended up buying the faulty software report existing issues and other<br />
consumers learn about the problems and adjust their priors downwards. Overestimation<br />
may also occur when the product does not fit consumer tastes or preferences according to<br />
their expectations (Chellappa and Shivendu 2005).<br />
4 Baseline Scenario - CE Model Equilibrium<br />
We first derive the equilibrium for the conventional CE business model. Let us define:<br />
c = a+b and α = αa · a<br />
c +αb · b<br />
c = αa ·<br />
1<br />
1+γ +αb ·<br />
γ<br />
. (2)<br />
1+γ<br />
Parameter c captures the value of the full product, including premium features, and con-<br />
sumers have an initial prior c0 = αc on this value. For consistency with notation in §3, we<br />
define c1 = a1 +b1, and c2 = a2 +b2. It immediately follows that:<br />
c1 = c0 = αc and c2 = c1 +(c−c1)·N1. (3)<br />
Under one-time fixed pricing, consumers will never consider at the beginning of period<br />
1 a strategy whereby to delay adoption until period 2 since c1 = αc > 0 and benefits<br />
accumulate over usage time. Therefore, at the beginning of period 1, potential adopters<br />
consider solely between adopting at the beginning of period 1 and not adopting at all.<br />
The firm only considers the following feasible pricing strategies:<br />
5 Note that this is different than updating the valuation of B in response to experiencing A for free (model<br />
FLF - beginning of period 1). In that case, consumers still have not experienced B but functionality in<br />
module A gives them additional signals about the potential benefits coming with functionality in module B.<br />
On the other hand, word of mouth is spread by fully informed customers who bought the premium product<br />
in period 1 and have experienced features in both modules A and B.<br />
12
0 < p < 2c1. (4)<br />
Otherwise, the firm is not making any positive profit. Let θ1 be the marginal (lowest) type<br />
consumer that adopts the software in period 1. Then:<br />
θ1 = p<br />
2c1<br />
= p<br />
. (5)<br />
2αc<br />
All consumers with type θ ≥ θ1 buy the software in the first period. Thus, N1 = 1−θ1. At<br />
the end of period 1, potential customers who have not adopted yet (i.e., those consumers<br />
with type θ < θ1) update their estimate of c (more precisely, a and b) to c2 (a2 and b2).<br />
A consumer with type θ < θ1 would adopt the software in period 2 and use it only for<br />
a single period of time if and only if c2θ ≥ p. Let θ2 be the marginal existing adopter at<br />
the end of period 2, regardless of when she adopted the product. Then:<br />
⎧<br />
⎨<br />
θ2 =<br />
⎩<br />
θ1 , if p<br />
c2<br />
p<br />
c2<br />
≥ θ1,<br />
, otherwise.<br />
The installed base at the end of period 2 is N2 = 1−θ2. The following lemma captures<br />
the conditions for adoption in period 2.<br />
Lemma 1. Under CE model, for any feasible price p ∈ (0,2c1), adoption extends to the<br />
second period (0 ≤ θ2 < θ1) if and only if c2 > 2c1.<br />
Lemma 1 illustrates the trade-off that potential customers are facing at the beginning<br />
of the second period if they did not adopt in the first period. On one hand, for the same<br />
price p, they can only benefit one period from using the product. On the other hand,<br />
their priors on c got adjusted from c1 to c2, and, as a result, their willingness to pay for<br />
one period of software use has changed. One interesting aspect captured in Lemma 1 is<br />
that consumers must at least double their priors on c as a result of network externalities<br />
in order to be willing to adopt in period 2. Weak adoption in period 1 does not provide<br />
potential customers with enough market feedback for them to consider a change in their<br />
adoption decision. Moreover, if consumers overestimated c in the beginning (α > 1), then<br />
the updating at the end of period 1 lowers their priors (c2 < c1) due to calibration in the<br />
correct direction induced by word of mouth. In such a case, there is no adoption in period<br />
2 since consumers’ willingness to pay decreased. Replacing c2 in Lemma 1 leads to the<br />
13<br />
(6)
following corollary:<br />
Lemma 2. Under CE model, adoption extends to the second period if and only if consumers<br />
initially significantly underestimate the value of the software α < 1<br />
<br />
2 and the price<br />
<br />
is sufficiently low .<br />
p < 2cα(1−2α)<br />
1−α<br />
Lemma 1 explores period 2 adoption conditions in terms of updated estimate c2, which<br />
in turn depends on period 1 adoption and, implicitly, on price. Lemma 2 advances our<br />
understandingof theadoption dynamics by illustrating that adoption never occursin period<br />
2 when consumer priors are high, price is high, or both.<br />
We have fully characterized above the consumers’ equilibrium response to any given<br />
price. Next, we solve the firm’s profit maximization problem:<br />
max<br />
0
N1, N2<br />
1<br />
0.75<br />
0.5<br />
0.25<br />
N2<br />
N1<br />
A. Adoption<br />
α = √ 5 − 2<br />
α = 13 − 4 √ 10<br />
N1 = N2<br />
0<br />
0 0.2 0.4 0.6<br />
α<br />
p ∗<br />
0.6<br />
0.4<br />
0.2<br />
B. Optimal Price<br />
α = 13 − 4 √ 10<br />
0<br />
0 0.2 0.4 0.6<br />
α<br />
π<br />
0.3<br />
0.2<br />
0.1<br />
C. Profit<br />
α = 13 − 4 √ 10<br />
0<br />
0 0.2 0.4 0.6<br />
α<br />
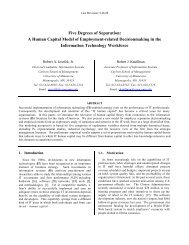
Figure 1: CE Equilibrium. Panels B and C use value c = 1 for illustration purposes.<br />
price the product such that adoption occurs in two periods. In this case, even though later<br />
adoption involves shorter usage time, some of the customers make the purchase in period<br />
2 after updating their priors at the end of period 1 due to word-of-mouth effects. <strong>When</strong> α<br />
is very small, the firm will employ a price that is low enough to generate a very small but<br />
significant enough mass of adopters in period 1 (limα↓0N1 = 0) who, in turn, fuel network<br />
externalities that make most potential customers adopt in period 2 (limα↓0N2 = 1). <strong>When</strong><br />
consumer willingness to pay is higher, the firm will charge more (p ∗ is increasing in α) and<br />
there will be more period 1 adopters (N1 is increasing in α) but fewer period 2 adopters<br />
(N2 −N1 is decreasing in α) and fewer overall adopters (N2 is decreasing in α). Thus, as<br />
α grows, the firm exploits more the initial higher willingness to pay of consumers and less<br />
period 2 adoption as a result of word-of-mouth effects on valuation learning. In this region,<br />
N2 is always greater than 1<br />
2 . On the other hand, N1 is lower than 1<br />
2 when α < √ 5 − 2,<br />
and higher than 1<br />
2 when α ∈ [√ 5 − 2,13 − 4 √ 10]. If α ≥ 13 − 4 √ 10, the firm boosts<br />
the price linearly with α and exploits high willingness to pay solely in period 1 such that<br />
N1 = N2 = 1<br />
2 . In particular, if consumers overestimate the true value of the software<br />
(α > 1), the firm exploits this perception bias immediately through a higher price since it<br />
understands that period 1 consumption is critical in capturing the highest profit given that<br />
in period 2 word of mouth about lower-than-expected software quality will spread and will<br />
reduce per-period consumer willingness to pay.<br />
(with N2 − N1 > 0). All else being equal, we assume that the firm prefers to get the revenue earlier and<br />
keep the price high (perhaps as a statement of the quality of the product). Similar considerations are made<br />
in Propositions 2 and 5.<br />
15
5 Equilibria for Freemium Models<br />
In this section we analyze the FLF and TLF models. Define γ = b<br />
a > 0 as ratio of the true<br />
values (to consumers) of the two modules. Since c = a+b, we have:<br />
a = c<br />
1+γ<br />
and b = γc<br />
. (8)<br />
1+γ<br />
The derivation of the equilibrium solution for the FLF model is similar to that for<br />
the CE model by substituting c → b and α → αb +δb. We also have to adjust the social<br />
welfare calculation by accounting for the fact that all consumers get module A for free for<br />
both periods.<br />
Proposition 2. Under FLF model, the firm’s optimal pricing strategy, and the profit and<br />
social welfare associated with it are:<br />
p ∗ FLF<br />
π ∗ FLF<br />
SW ∗ FLF<br />
c<br />
1+γ<br />
<br />
1+γ<br />
0 < αb +δb < 13−4 √ 10 13−4 √ 10 ≤ αb +δb<br />
<br />
2(αb+δb)γc<br />
(1+γ)(1−αb−δb) 1−<br />
<br />
2(αb+δb)<br />
1+αb+δb<br />
2(αb+δb)γc<br />
√1+αb+δb+ (1+γ)<br />
√ 2 2(αb+δb)<br />
1−<br />
<br />
1+2(αb+δb)+2(αb+δb) 2<br />
√1+αb+δb+ 2(1+αb+δb)<br />
√ 2 2(αb+δb)<br />
<br />
γc(αb+δb)<br />
1+γ<br />
γc(αb+δb)<br />
2(1+γ)<br />
c(4+3γ)<br />
4(1+γ)<br />
Adoption in both periods only in period 1<br />
The adoption pattern is similar to the one depicted in Figure 1, but with the horizontal<br />
axis describing αb + δb instead of α. Also, in this case N1 and N2 represent adopters of<br />
premium module B. <strong>When</strong> αb + δb ≥ 13 − 4 √ 10, the firm’s optimal pricing under FLF<br />
results in exactly half of the market being covered.<br />
Under model TLF, adoption is restricted in period 2. Since consumers gain perfect<br />
information in period 1, their initial priors no longer influence adoption or, for that matter,<br />
firm’s profit.<br />
Proposition 3. Under TLF model, the firm’s optimal pricing strategy, and the profit and<br />
social welfare associated with it are p ∗ TLF<br />
= c<br />
2 , π∗ TLF<br />
16<br />
= c<br />
4 , SW∗ TLF<br />
= 7c<br />
8 .
Note that, under TLF model, we always have N2 = 1<br />
2 .<br />
6 Equilibria for Seeding Models<br />
In our framework, consumer learning depends on the existing network size but not on the<br />
types of customers who adopted before. If the firm had visibility into individual consumer<br />
types, then it would seed consumers who otherwise would not buy the product, instead of<br />
giving away the software to any high-type consumers. However, in a more realistic setting,<br />
the firm has limited knowledge of consumer types. For that reason, we consider uniform<br />
seeding, whereby k% of the addressable market receives the software for free in period 1<br />
(with k ∈ [0,1)) and each type is uniformly represented in the product giveaway pool.<br />
6.1 Simple Seeding - SS<br />
Under SS model, N1 = k since in period 1 we have only seeding but no selling. We again<br />
assume consumer valuation prior c1 = cα. The consumers who received the product for<br />
free start generating word of mouth about the overall quality of the product, leading the<br />
remaining 1−k consumers to update their willingness to pay to:<br />
c2 = cα+kc(1−α) = c[α+k(1−α)].<br />
Then, in period 2, the remaining 1−k consumers have types uniformly distributed in the<br />
interval [0,1]. Inorderfor any adoption tooccur in thesecond period, byasimilar argument<br />
as in §4, the firm will only consider feasible pricing strategies:<br />
0 < p < c2. (9)<br />
The marginal consumer, who is indifferent between adopting and not adopting, has type:<br />
θ2 = p<br />
c2<br />
=<br />
p<br />
. (10)<br />
c[α+k(1−α)]<br />
Then, we have N2 = (1 − k)(1 − θ2) + k, accounting for the seeded consumers as well.<br />
However, in the profit function, we drop the seeded consumers since they do not generate<br />
any revenue for the firm, and obtain the expression:<br />
<br />
p<br />
πSS(p,k) = p(N2 −k) = p(1−k) 1− . (11)<br />
c[α+k(1−α)]<br />
17
Proposition 4. Under SS model, the firm’s optimal seeding and pricing strategy, as well<br />
as the profit and social welfare associated with it are:<br />
k ∗ SS<br />
p ∗ SS<br />
π ∗ SS<br />
SW ∗ SS<br />
0 < α < 1<br />
2<br />
1−2α<br />
2(1−α)<br />
c<br />
4<br />
c<br />
16(1−α)<br />
c(11−16α)<br />
16(1−α)<br />
1<br />
2 ≤ α<br />
Interestingly, the firm only uses seeding when consumers significantly underestimate<br />
the true product value (α < 1<br />
2 ). In such cases, the firm has an incentive to increase the<br />
consumer willingness to pay by generating word of mouth. Furthermore, when α < 1<br />
2 , this<br />
benefit exceeds the cost of uniform seeding, whereby the firm gives away the product also<br />
to some of the high-type customers who would have purchased it even under low priors. As<br />
expected, the optimal seeding ratio is decreasing in α, which illustrates the fact that the<br />
higher the consumers’ priors on product value (and, implicitly, the higher the willingness<br />
to pay), the lower the need to seed the market.<br />
6.2 Complex Seeding - CS<br />
In this model, in period 1, in addition to seeding, the firm also sells the software. Word<br />
of mouth from the seeded community gets around even when nobody else purchases the<br />
product in the first period. Therefore, the feasible price condition (4) becomes:<br />
0 < p < max{2cα,c[α +k(1−α)]}. (12)<br />
<strong>When</strong> constraint (12) is satisfied, adoption occurs in either period 1, period 2, or both.<br />
In particular, adoption (in addition to seeded customers) starts in period 1 if and only if<br />
p < 2cα. We note that 2cα < c[α+k(1−α)] if and only if α < k<br />
1+k . Therefore, for prices<br />
in the feasible range, we have:<br />
⎧<br />
⎪⎨<br />
θ1 =<br />
⎪⎩<br />
p k<br />
2cα , if 1+k ≤ α,<br />
p<br />
2cα , if 0 < α < k<br />
1+k<br />
1 , if 0 < α < k<br />
1+k<br />
and p < 2cα,<br />
0<br />
cα<br />
2<br />
cα<br />
4<br />
3c<br />
8<br />
and 2cα ≤ p < c[α+(1−α)k],<br />
18<br />
(13)
where θ1 = 1 indicates that negligible or no adoption occurs in period 1. Then, at the end<br />
of period 1, we have N1 = k + (1 − k)(1−θ1) = 1 − (1 − k)θ1. It immediately follows<br />
that c2 = cα+N1c(1−α) = c−c(1−k)(1−α)θ1. The result in Lemma 1 still holds, i.e.<br />
adoption occurs in period 2 (i.e., θ2 < θ1) iff c2 > 2c1. Lemma 2 becomes:<br />
Lemma 3. Under CS model, for any feasible price satisfying (12), adoption extends to the<br />
second period if and only if one of the following two cases occurs:<br />
k 1 (a) 1+k ≤ α < 2<br />
2cα(1−2α)<br />
k<br />
and p < (1−α)(1−k) , or (b) 0 < α < 1+k .<br />
For any fixed seeding ratio k ∈ [0,1), we derive the equilibrium solution below:<br />
Lemma 4. Under CS model, for a given seeding ratio k ∈ [0,1), the firm’s optimal pricing<br />
strategy and the associated profit are:<br />
p ∗ CS (k)<br />
π ∗ CS (k)<br />
0 < α < ˜α(k) ˜α(k) ≤ α < 13+2k+k2 −4 √ 10+2k 2 +4k<br />
(1−k) 2<br />
c[α+(1−α)k]<br />
2<br />
(1−k)c[α+(1−α)k]<br />
4<br />
<br />
2cα<br />
(1−α)(1−k) 1−<br />
<br />
2α<br />
2α+(1−α)(1−k)<br />
√ √ 2 2cα 2α+(1−k)(1−α)− 2α<br />
(1−k)(1−α) 2<br />
<br />
13+2k+k 2 −4 √ 10+2k 2 +4k<br />
(1−k) 2<br />
cα<br />
cα(1−k)<br />
2<br />
Adoption only in per. 2 in both per. 1 and 2 only in per. 1<br />
√<br />
−1−k2 + 1+3k2 where ˜α(k) represents the unique solution over the interval 1−k2 , k<br />
<br />
3+k to the<br />
2α+(1−α)(1−k)+ √ 2 equation hk(α) = 0, with hk(α) = [α+(1−α)k]<br />
2α −8α.<br />
This is a hard problem with a non-trivial proof. Existence and uniqueness of ˜α(k) are<br />
proved in the Appendix in auxiliary Lemma A1. <strong>When</strong> k = 0, CS defaults to CE model,<br />
˜α(k) = 0 (region 0 < α < ˜α(k) does not exist), and we obtain the solution described in<br />
Proposition 1.<br />
Solvingfortheoptimal seedingratiok ∗ CS , weobtainthefollowingsurprisingandelegant<br />
equilibrium solution:<br />
Proposition 5. Under CS model, the firm’s optimal seeding and pricing strategy, as well<br />
as the profit and social welfare associated with it are:<br />
19<br />
≤ α
0 < α < α α ≤ α < 13−4 √ 10 13−4 √ 10 ≤ α<br />
k ∗ CS k ∗ SS 0 0<br />
p ∗ CS p ∗ SS p ∗ CE p ∗ CE<br />
π ∗ CS π ∗ SS π ∗ CE π ∗ CE<br />
SW ∗ CS SW ∗ SS SW ∗ CE SW ∗ CE<br />
Adoption only in period 2 in both periods only in period 1<br />
where α ≈ 0.065 is the unique solution to the equation g(α) = 0 over the interval (0,13 −<br />
4 √ 10), with g(α) = 1<br />
16(1−α) − 2α<br />
( √ 1+α+ √ 2α) 2.<br />
Existence and uniqueness of α is proved in the Appendix in auxiliary Lemma A2.<br />
We note that, unlike in the case of model SS, under CS seeding is optimal only for very<br />
low priors, i.e., when consumers severely underestimate the value of the full product. For<br />
α ∈ (0,α), theoptimal seedingratiok ∗ SS<br />
∈ (0.46,0.5), implyingthat, underCS, itisoptimal<br />
for the firm to either seed almost half of the addressable market or not seed at all. Once<br />
α ≥ α, the firm can generate strong-enough word-of-mouth effects via sales in period 1 and<br />
it will follow a CE strategy since that way it is not losing any sales to high-type customers.<br />
7 Comparative Statics<br />
First, we examine the value of seeding. We start by discussing how the two seeding models<br />
(SS and CS) fare compared to the conventional CE model.<br />
Corollary 1. The following hold true:<br />
(a) π ∗ SS > π∗ CE<br />
(b) π ∗ CS > π∗ CE<br />
if and only if α ∈ (0,α),<br />
if and only if α ∈ (0,α).<br />
This corollary demonstrates that, in the absence of freemium options, a firm would<br />
benefit from seeding if the consumer priors are very small, i.e., when, at the beginning of<br />
period 1, consumers believe the software is worth less than 6.5% of its true value. In such<br />
scenarios, profit under CE is very small since the firm has to price very low in order to spur<br />
adoption and network externalities. On the other hand, under SS and CS, word-of-mouth<br />
effects are boosted by seeding, allowing the firm to price higher and obtain a higher profit.<br />
20
However, as shown in the next corollary, if the firm can choose TLF, then it will<br />
never choose seeding because TLF dominates seeding in the region where, in turn, seeding<br />
dominates CE.<br />
Corollary 2. <strong>When</strong> α ∈ (0,α), then π ∗ TLF > π∗ SS = π∗ CS .<br />
If α < α, seeding can only move the consumer priors upwards but still below the<br />
true software value. Uniform seeding comes at the expense of foregoing some revenue from<br />
high-type customers, thus cannibalizing some of the demand. Consequently, in the second<br />
period, the firm faces a thinned customer pool that still underestimates the product value.<br />
Therefore, clearly, TLF dominates SS. The following theorem summarizes our first set of<br />
key results, i.e., firm’s optimal choice among the five business models.<br />
Theorem 1. From a profit perspective, for any feasible set {αa,αb,δb,γ}, if the firm can<br />
choose among CE, FLF, TLF, SS, and CS business models, the following hold true:<br />
(a) If 0 < αa ≤ γ+1<br />
2 , then:<br />
(i) SS and CS are always dominated strategies.<br />
(ii) If δb ≤ αa<br />
γ and αb ≥ γ+1<br />
2γ<br />
αa<br />
− γ , then CE is the dominating strategy.<br />
(iii) If δb ≥ αa<br />
γ and αb +δb ≥ 1 1<br />
2 + 2γ , then FLF is the dominating strategy.<br />
(iv) If αb ≤ γ+1<br />
2γ<br />
(b) If γ+1<br />
2 < αa, then:<br />
αa<br />
− γ and αb +δb ≤ 1 1<br />
2 + 2γ , then TLF is the dominating strategy.<br />
(i) TLF, SS, and CS are always dominated strategies.<br />
(ii) If δb ≤ αa<br />
γ , then CE is the dominating strategy.<br />
(iii) If δb ≥ αa<br />
γ , then FLF is the dominating strategy.7<br />
Figure 2 summarizes the results in Theorem 1. Each of CE, FLF, and TLF business<br />
models can dominate a particular region of the feasible parameter space, depending on<br />
consumer priors, cross-module synergies, and true value ratio between modules. Note that<br />
Theorem 1 only describes the best strategy in any given region. A complete picture of the<br />
firm’s ranking of these strategies by regions is included in Lemma A4, in the Appendix.<br />
<strong>When</strong>ever αa > γδb (or, equivalently, αaa > δbb), regardless of whether the prior on<br />
b is adjusted in the right direction or not by cross-module learning effects, model FLF is<br />
7 Multiple strategies can be simultaneously dominating only alongside region boundaries.<br />
21
αb<br />
+ 1<br />
≤<br />
2<br />
γ<br />
αa ¡<br />
0<br />
αa γ<br />
αb<br />
+ δb<br />
= 0<br />
γ + 1 αa<br />
αb<br />
= −<br />
2γ<br />
γ<br />
δ b<br />
1 1<br />
αb<br />
+ δb<br />
= +<br />
2 2γ<br />
αb<br />
Figure 2: Firm’s Optimal Strategies<br />
0<br />
+ 1<br />
><br />
2<br />
γ<br />
αa ¢¡<br />
αb<br />
+ δb<br />
= 0<br />
αa γ<br />
1 1<br />
αb<br />
+ δb<br />
= +<br />
2 2γ<br />
always dominated. Such an outcome may occur in a number of scenarios, including when<br />
adjustment factor δb is small or negative, when the true value added through model B is<br />
relatively small (i.e., small γ), or when the consumer prior on the value of the basic module<br />
is high (i.e., high αa). Note that, in the FLF case, the freemium-generated change (increase<br />
or decrease) in the consumer valuation of module B is δbb. Thus, if offering A for free does<br />
not increase the valuation of B by at least the consumer prior on the value of module A<br />
(i.e. αaa), then the firm does not find it optimal to offer A for free in both periods.<br />
Furthermore, whenever αa ≤ γ+1<br />
2 and αb ≤ γ+1 αa<br />
2γ − γ<br />
δ b<br />
1<br />
(or, equivalently, α ≤ 2 ), model<br />
CE is dominated. In such cases, because the overall prior on the full product is too low,<br />
it is optimal to offer a freemium strategy, thus allowing customers to adjust their priors on<br />
each module at the beginning of period 1. The choice between TLF and FLF depends on<br />
the value of αb+δb. If δb is high enough, by offering module A for free the firm will elevate<br />
consumers’ expectation of module B value sufficiently high to ensure optimality of FLF.<br />
Otherwise, the firm will offer the entire product for free in the first period since selling A<br />
and B together during second period under perfect information is better than selling only<br />
B for two periods under adjusted priors (imperfect information).<br />
On the other hand, when (i) αa ≤ γ+1<br />
2 and αb > γ+1 αa<br />
2γ − γ , or (ii) αa > γ+1<br />
2 (or,<br />
equivalently, α > 1<br />
2 ), we see that TLF is a dominated strategy. In this region, in particular,<br />
thefirmwouldalways preferCE over TLF sinceforegoing period1sales issuboptimalwhen<br />
consumers have high willingness to pay from the very beginning for the full product. This<br />
22
comparison follows directly from Propositions 1 and 3 since 13−4 √ 10 < 1<br />
2 . Furthermore,<br />
in this high α region, if δb is sufficiently large, CE will, in turn, be dominated by FLF.<br />
Now that we established that, in certain scenarios, freemium models can yield a higher<br />
profit compared to the baseline model, a question of high managerial relevance is how much<br />
more a firm could gain by switching to a freemium model. Changes in product marketing<br />
strategy are usually a costly undertaking since they involve new advertising approaches,<br />
business process redesigning, employee re-training, etc. Therefore, such transitions make<br />
more sense when the profit improvements are of significant magnitudes. For example, when<br />
αb +δb ≥ 13−4 √ 10 and α ≥ 13−4 √ 10, it immediately follows that:<br />
π ∗ FLF −π∗ CE<br />
π ∗ CE<br />
= γδb −αa<br />
γαb +αa<br />
and<br />
π ∗ FLF −π∗ TLF<br />
π ∗ TLF<br />
= γ(2αb +2δb −1)−1<br />
.<br />
γ +1<br />
In such a case, a large δb value makes the FLF approach extremely desirable to the firm.<br />
Furthermore, when αa is very small or γ is very large, the magnitude of the relative profit<br />
gain from switching from CE to FLF depends on the ratio δb.<br />
We can also explore other<br />
αb<br />
regions of the feasible parameter space for similar insights. The following corollary to<br />
Propositions 1, 2, and 3 provides insights into the asymptotic potential profit gains from<br />
switching between models:<br />
Corollary 3. The following hold true:<br />
π<br />
(a) lim<br />
δb→∞<br />
∗ FLF −π∗ CE<br />
π∗ CE<br />
π<br />
(b) lim<br />
αa,αb,δb→0<br />
∗ TLF −π∗ CE<br />
π∗ CE<br />
π<br />
(c) lim<br />
αa,αb→0<br />
∗ FLF −π∗ CE<br />
π∗ CE<br />
π<br />
= lim<br />
δb→∞<br />
∗ FLF −π∗ TLF<br />
π∗ TLF<br />
π<br />
= lim<br />
αb,δb→0<br />
∗ TLF −π∗ FLF<br />
π∗ FLF<br />
π<br />
= lim<br />
αa,αb→0<br />
∗ TLF −π∗ CE<br />
π∗ CE<br />
= ∞, ∀ αa,αb > 0,<br />
= ∞,<br />
= ∞, ∀ δb > 0.<br />
<strong>When</strong>consumerpriorsonthesoftwaremodulesareverysmall(lowαa, αb), thereisalot<br />
to gain by switching to a freemium model, as illustrated in parts (b) and (c) of Corollary 3.<br />
ThesameistruewhenofferingAforfreeleadstoabigupwardsadjustmentoftheconsumers’<br />
valuation of B (high δb). Moreover, we note that even switching between two freemium<br />
models can greatly increase profitability depending on αa, αb, and δb. While Corollary 3<br />
describes extreme cases, profit gains can be significant by switching between models even<br />
for moderate parameter values. For example, consider a case where α ∈ [0.4,0.5], γ = 4,<br />
23
and αb +δb ≥ 0.75. Then π ∗ CE ≤ 0.25c, π∗ TLF = 0.25c, and π∗ FLF<br />
≥ 0.3c. By switching to<br />
FLF, the firm can achieve at least 20% profit increase. Thus, it is important for the firm<br />
not just to consider implementing any freemium model, but to carefully choose between the<br />
available freemium options.<br />
8 Social Welfare Analysis<br />
It is straightforward to show that, under a central planner economy, the optimal price<br />
under each of the five models is zero due to sunk costs. In this section we focus on the more<br />
interestingsocial welfareimplications whenthefirmchoosesitsoptimal pricingstrategy. We<br />
denote by SW ∗ M<br />
the social welfare corresponding to the profit maximizing strategy under<br />
model M, where M ∈ {CE,FLF,TLF,SS,CS}. Define function φ : [0,13 −4 √ 10] → R,<br />
1+2x+2x φ(x) = 1− 2<br />
2(1+x)( √ 1+x+ √ 2x) 2. We show in the Appendix in Lemma A6 that φ is strictly<br />
increasing over the interval [0,13−4 √ 10], with φ(0) = 1<br />
2 and φ(13−4√10) ≈ 0.82 < 7<br />
8 < 1.<br />
Then, we have the following social welfare ranking:<br />
Theorem 2. The following hold true:<br />
(a) SW∗ TLF > max{SW∗ CE ,SW∗ SS ,SW∗ CS } for any α > 0;<br />
(b) SW ∗ FLF ≥ SW∗ TLF<br />
(i) γ ≤ 1<br />
3 ; or<br />
(ii) 1<br />
3 < γ ≤ 1 and φ−1<br />
(iii) 1 < γ <<br />
if and only if one of the following conditions is satisfied:<br />
<br />
7γ−1<br />
8γ<br />
≤ αb +δb; or<br />
1<br />
7−8φ(13−4 √ ≈ 2.262 and φ−1<br />
10)<br />
7γ−1<br />
8γ<br />
<br />
≤ αb +δb < 13−4 √ 10.<br />
The results in Theorem 2 are illustrated in Figure 3. Note that, when the firm max-<br />
imizes profit, social welfare under CE, SS, and CS models is always smaller than under<br />
TLF model. Thus, highest social welfare will be attained under either FLF or TLF. In<br />
other words, freemium, in one form or another, is always preferred from the society’s per-<br />
spective. The adoption dynamics for FLF can be explained through Figure 1 with αb +δb<br />
instead of α on the horizontal axis. <strong>When</strong> αb + δb ≥ 13 − 4 √ 10, then, under FLF, we<br />
have only period 1 adoption and exactly half of the potential customers purchase module<br />
B. Therefore, under both FLF and TLF, high-type customers (with type θ ≥ 1<br />
2 ) get to<br />
use both modules A and B for two periods. The difference is that, under FLF, low-type<br />
24
αb + δb<br />
1<br />
0.8<br />
0.6<br />
0.4<br />
0.2<br />
SW ∗ TLF < SW ∗ FLF SW ∗ FLF < SW ∗ TLF<br />
0<br />
0 1 1 3<br />
7−8φ(13−4 √ 1<br />
3<br />
10)<br />
γ<br />
φ −1<br />
<br />
7γ−1<br />
8γ<br />
αb + δb = 13 − 4 √ 10<br />
Figure 3: Social welfare ranking between TLF and FLF when the firm maximizes profit.<br />
customers (θ < 1<br />
2 ) get module A for free in both periods, while, under TLF, low-type<br />
customers get both modules for free but only in the first period. Thus, in that region,<br />
SW ∗ FLF ≥ SW∗ TLF<br />
if and only if γ ≤ 1.<br />
<strong>When</strong> αb + δb < 13 − 4 √ 10, we have adoption in both periods under FLF. If the<br />
basic module is significantly more valuable than the premium module (i.e., γ ≤ 1<br />
3 ), then<br />
FLF model generates the highest social welfare since it is more beneficial to offer the<br />
higher value module (in this case A) for free for two periods rather than give both high<br />
and low value modules for free in one period. As γ increases but stays moderate (i.e.,<br />
1<br />
3<br />
≤ γ ≤<br />
1<br />
7−8φ(13−4 √ ), in order for FLF to generate higher social welfare than TLF<br />
10)<br />
it is necessary for increasingly more adoption to happen in the first period so that more<br />
customersget benefitsfromusingB over twoperiods. This, inturn,implieshigherthreshold<br />
values for αb + δb, as it can be seen from Figure 1. In Theorem 2 and in Figure 3, this<br />
threshold is captured by line αb +δb = φ −1<br />
1<br />
7−8φ(13−4 √ 10)<br />
7γ−1<br />
8γ<br />
<br />
, which is increasing in γ. 8 Last, when<br />
≤ γ, then module B is significantly more valuable than module A. Under<br />
FLF, as we can see from Figure 1, even the highest level of adoption of module B in period<br />
1, when αb+δb is very close to 13−4 √ 10, only guarantees that a small group of customers<br />
with types below 1<br />
2<br />
get to use B over two periods and, in such a case, adoption would be<br />
very low in period 2. In such a scenario, under both FLF and TLF, high types (θ ≥ 1<br />
2 )<br />
use both modules in both periods and low types (θ < 1<br />
2 ) use module A for free in period 1.<br />
The difference is that, under FLF, there are a limited group of low-type consumers that<br />
use B for one or two periods, and all low-type consumers get to use A for free in period 2,<br />
8 1 1<br />
If ≤ γ ≤ 3 7−8φ(13−4 √ 1 7γ−1<br />
then we have <<br />
10) 2 8γ < φ(13−4√10) and φ −1<br />
<br />
7γ−1<br />
is well defined (cases<br />
8γ<br />
(b.ii) and (b.iii) of Theorem 2).<br />
25
while, under TLF, all low-type consumers get to use B in the first period. Given the large<br />
difference between the values of modules A and B, social welfare is maximized under TLF<br />
in this region.<br />
For all the feasible parameter combinations, under a profit maximizing firm, we dis-<br />
cussed in Theorems 1 and 2 which strategies yield the highest profit and the highest social<br />
welfare, respectively. We conclude this section by exploring opportunities for policy adjust-<br />
ments (e.g., subsidies) aimed towards aligning the firm’s and the society’s interests. We<br />
depict in Figure 4 regions whereaprofitmaximizing firm ends up choosing the strategy that<br />
actually yields the highest social welfare among CE, FLF, and TLF (we already know that<br />
SS and CS are dominated under both profit and social welfare). First, part (a) of Theorem<br />
2 shows that it is always desirable from a social standpoint for the firm to switch from a<br />
baseline CE model to a freemium model. Where CE is optimal for the firm, the highest<br />
social welfare is achieved under FLF or TLF depending on the values of γ and αb +δb, as<br />
illustrated in part (b) of Theorem 2. Second, when the firm chooses FLF, that strategy<br />
can yield the highest social welfare if and only if γ ≤ 1 (panels A.i, A.ii, and B.i of Figure<br />
4), i.e., when value added through module B is less than the value of module A. This case<br />
may correspond to scenarios where the firm offers a general multi-purpose platform product<br />
(module A) and allows users to purchase additional very specialized functionality separately<br />
(module B) which, on average, brings less benefits to users compared to the platform itself.<br />
Otherwise, social welfare can be increased by employing TLF in this region (panels A.iii,<br />
A.iv, and B.ii of Figure 4). Third, when the firm chooses TLF, that approach can be<br />
socially optimal only when αa ≤ γ+1<br />
2 and γ > 1 1<br />
3 . <strong>When</strong> γ ≤ 3 , FLF is socially optimal.<br />
<strong>When</strong> 1 1<br />
3 < γ <<br />
7−8φ(13−4 √ , FLF becomes less socially desirable as firm’s optimal choice<br />
10)<br />
(TLF) becomes socially better first for low αb+δb (Panel A.ii of Figure 4) and then also for<br />
1<br />
high enough αb + δb (panel A.iii of Figure 4). Ultimately, when<br />
7−8φ(13−4 √ ≤ γ (panel<br />
10)<br />
A.iv of Figure 4), firm’s optimal TLF choice is socially optimal for all αb + δb < 1 1<br />
2 + 2γ .<br />
Last, it is particularly interesting to note that when αa ≥ γ+1<br />
2 and γ > 1 the firm never<br />
chooses the strategy that maximizes the social welfare (TLF). In this scenario the firmdoes<br />
not want under any circumstance to invest into fully informing consumers about the true<br />
value of the product by completely forfeiting period 1 sales. This, in turn, may prompt the<br />
government to subsidize the firm in order to incentivize it to switch to TLF, thus educating<br />
customers about the product benefits.<br />
26
γ + 1<br />
0 < αa ≤<br />
2<br />
1<br />
0 ≤ γ ≤<br />
3<br />
£¤¥<br />
αb<br />
0<br />
1<br />
< γ ≤1<br />
3<br />
αb<br />
£¤¥¥<br />
0<br />
αb<br />
+ δb<br />
αb<br />
+ δ<br />
= −<br />
= 0<br />
−1<br />
7γ<br />
1<br />
8γ<br />
1<br />
1<<br />
γ <<br />
7 −8φ(<br />
13−4<br />
10<br />
αb<br />
1 1<br />
αb<br />
+ δb<br />
= +<br />
2 2γ<br />
αb<br />
+ δb<br />
= 13−4<br />
10<br />
−1<br />
7γ<br />
1<br />
αb<br />
+ δb<br />
= φ−<br />
8γ<br />
αb<br />
+ δb<br />
= 0<br />
b ) £¤¥¥¥ <br />
0<br />
1<br />
< γ<br />
7 − 8φ(<br />
13−4<br />
10)<br />
£¤¥<br />
αb<br />
0<br />
αb<br />
+ δb<br />
αb<br />
+ δb<br />
= 0<br />
= 0<br />
b<br />
αa γ<br />
φ<br />
αa γ<br />
1 1<br />
αb<br />
+ δb<br />
= +<br />
2 2γ<br />
<br />
1 1<br />
αb<br />
+ δb<br />
= +<br />
2 2γ<br />
γ + 1 αa<br />
αb<br />
= −<br />
2γ<br />
γ<br />
δb<br />
1 1<br />
α + δb<br />
= +<br />
2 2γ<br />
γ + 1 αa<br />
αb<br />
= −<br />
2γ<br />
γ<br />
δb<br />
γ + 1 αa<br />
αb<br />
= −<br />
2γ<br />
γ<br />
δb<br />
γ + 1 αa<br />
αb<br />
= −<br />
2γ<br />
γ<br />
δb<br />
0 ≤ γ ≤1<br />
<br />
αb<br />
0<br />
1 < γ <br />
αb<br />
+ 1<br />
><br />
2 γ<br />
αa α<br />
0<br />
b + δb<br />
= 0<br />
αb<br />
δ<br />
+ b = 0<br />
1 1<br />
αb<br />
+ δb<br />
= +<br />
2 2γ<br />
¦¥§¨©¥¨§ ¥¥¥ §¨ <br />
¥§¨ ¥¥ ¦¥§¨©¥¨§<br />
Figure 4: Plots describing when the firm’s optimal strategy also yields the highest social<br />
welfare (among CE, FLF, TLF, SS, and CS).<br />
27<br />
αa γ<br />
δb<br />
δb
9 Conclusions<br />
Inthis paper, we providean extensive head-on comparison between theconventional charge-<br />
for-everything business model and several freemium and seeding models extant in software<br />
markets. Our models are based on an integrated framework capturing multi-period adop-<br />
tion dynamics, network externalities, customer valuation learning, and software modularity.<br />
This allows us to conduct previously unexplored comprehensive performance benchmark-<br />
ing among models and to derive policy implications. Moreover, our analysis sheds more<br />
light on various marketing approaches employed in the software industry. For one, CE,<br />
TLF, and FLF can each be a dominating strategy for the firm, depending on consumer<br />
priors on the value of individual software modules, perceptions of cross-module synergies,<br />
and overall value distribution across modules, whereas uniform seeding is always dominated<br />
by either freemium models or conventional for-fee models. Our analysis offers significant<br />
managerial insights, as we show that switching from CE model to freemium models can<br />
dramatically increase profitability, as can switching between different freemium models. Fi-<br />
nally, we show that freemium is always preferred from the society’s perspective, and derive<br />
recommendations as to when the firm needs to be subsidized in order for the social welfare<br />
to be increased.<br />
Given that the goal of this study is to seek insights by comparing and contrasting sev-<br />
eral established business models, our framework was stylized for tractability. This presents<br />
opportunities for our analysis to be extended in multiple ways, perhaps using simulations or<br />
other numerical approaches when closed-form solutions like ours cannot be derived. First,<br />
throughoutthisstudy, wefocussedonsoftwareproductscharacterized byone-timepurchase,<br />
where the users run the software off their own machines and the developer does not invest<br />
additional resources to support the consumption of the product. For simplicity we do not<br />
consider quality improvement and maintenance via patching. However, as discussed in the<br />
Introduction, freemium applicability extends beyond such products, in particular branching<br />
into the rapidly growing markets for software-as-a-service products, where adoption dynam-<br />
icsareslightly differentandtherevenuemodelisinmanycasessubscription-based,involving<br />
recurring payments from the installed base. In such markets, service providers may incur<br />
non-negligible operational costs associated with running the application (on own hardware<br />
infrastructure or on stable environments sourced from platform-as-a-service providers such<br />
28
as Salesforce.com or infrastructure-as-a-service providers such as Amazon or Rackspace).<br />
Offering a feature-limited freemium model involves bleeding costs from supporting the ser-<br />
vice for a mass of non-paying customers for the entire product lifecycle, posing challenges<br />
to the viability of the model (Sixteen Ventures 2010). Thus, it would be very interesting<br />
to explore the conditions under which the freemium models would dominate CE models in<br />
the software-as-a-service markets.<br />
Another extension would be to consider dynamic pricing, along with the presence of<br />
strategic customers. At the beginning of period 1, strategic customers might consider<br />
delaying adoption until period 2 if they anticipate a decrease in price. By contrast, we<br />
assume the firm commits to fixed pricing. While our two-period models (CE, FLF or<br />
CS) predict like behavior whereby customers may balk early but adopt later in the second<br />
period, the reasons are quite different. This behavior does not emerge because of strategic<br />
choice at the beginning of period 1, but because of consumer valuation learning at the end<br />
of period 1 attributed to word-of-mouth effects.<br />
Furthermore, our analysis of seeding is restricted to uniform seeding strategies, assum-<br />
ing that the firm has little knowledge about customer types. It would be interesting to<br />
explore alternative seeding strategies, whereby the firm would be able to distinguish cus-<br />
tomer types. Such a model should also account for the fact that some users are more likely<br />
to generate buzz about the product thus exerting more influence on potential adopters.<br />
This seems to be happening to a certain extent in software markets. For example, software<br />
companiesoccasionally showcasetheirproductsatdeveloperconferencesorconventions, dis-<br />
tributing free samples to members of a highly informed audience that attends such events.<br />
There is a higher than random likelihood that such users are interested in the software<br />
and that they are going to explore its functionality in more depth than casual users, thus<br />
offering more insightful comments on the performance and features of the product to the<br />
rest of the community.<br />
Also, it would be very interesting to see how hybrid freemium models (described in<br />
the Introduction) fare compared to pure ones. Moreover, network effects could also be<br />
incorporated at the utility level in addition to the network externalities governing the word-<br />
of-mouth effect on valuation learning. Last, it would be intriguing to complement our<br />
analytical study with empirical testings as well as laboratory and field experiments that<br />
29
would explore consumer valuation learning in software markets.<br />
References<br />
Anderson, C. 2009. Free: the future of a radical price. Hyperion.<br />
Autodesk. 2009. Autodesk debuts clean tech partner program. Autodesk press release, July 21.<br />
Bawa, K., R. Shoemaker. 2004. The effects of free sample promotions on incremental brand sales.<br />
Marketing Sci. 23(3) 345–363.<br />
Bhargava, H., V. Choudhary. 2001. Information goods and vertical differentiation. J. Management<br />
Info. Sys. 18(2) 89–106.<br />
Bhargava, H., V. Choudhary. 2008. <strong>When</strong> is versioning optimal for information goods. Management<br />
Sci. 54(5) 1029–1035.<br />
Chellappa, R., S. Shivendu. 2005. Managing piracy: Pricing and sampling strategies for digital<br />
experience goods in vertically segmented markets. Inform. Systems Res. 16(4) 400–417.<br />
Cheng, H. K., Y. Liu. 2010. Optimal softwarefree trial strategy: The impact of networkexternalities<br />
and consumer uncertainty. Inform. Systems Res., forthcoming.<br />
Cheng, H. K., Q. C. Tang. 2010. Free trial or no free trial: Optimal software product design with<br />
network effects. European J. Oper. Res. 205(2) 437–447.<br />
Conner, K. R. 1995. Obtaining strategic advantage from being imitated: <strong>When</strong> can encouraging<br />
clones pay? Management Sci. 41(2) 209–225.<br />
Datamonitor. 2009. <strong>Software</strong>: Global industry guide. Report DO-4959.<br />
Dellarocas, C. 2003. The digitization of word of mouth: Promise and challenges of online feedback<br />
mechanisms. Management Sci. 49(10) 1407–1424.<br />
Duan, W., B. Gu, A. B. Whinston. 2008. Do online reviews matter? - An empirical investigation of<br />
panel data. Decision Support Systems 45(4) 1007–1016.<br />
Ellison, G., D. Fudenberg. 1995. Word-of-mouth communication and social learning. Quarterly J.<br />
Econ 110(1) 93–125.<br />
Galeotti, A., S. Goyal. 2009. Influencing the influencers: A theory of strategic diffusion. RAND J.<br />
Econ. 40(3) 509–532.<br />
Ghose, A., A. Sundararajan. 2005. <strong>Software</strong> versioning and quality degradation? An exploratory<br />
study of the evidence. Working paper, <strong>New</strong> York University.<br />
Heiman, A., B. McWilliams, Z. Shen, D. Zilberman. 2001. Learning and forgetting: Modeling<br />
optimal product sampling over time. Management Sci. 47(4) 532–546.<br />
Heiman, A., E. Muller. 1996. Using demonstration to increase new product acceptance: Controlling<br />
demonstration time. J. Marketing Res. 33(4) 422–430.<br />
Internet World Stats. 2010. World Internet usage and population statistics. http://www.internet-<br />
worldstats. com/stats.htm.<br />
ISC.2010. Internethostcounthistory. InternetSystemsConsortium.https://www.isc.org/solutions/<br />
survey/history.<br />
30
Jain, D., V. Mahajan, E. Muller. 1995. An approach for determining optimal product sampling for<br />
the diffusion of a new product. J. Prod. Innovation Management 12 124–1356.<br />
Jiang, Z., S. Sarkar. 2003. Free software offer and software diffusion: The monopolist case. Proc.<br />
24th Int’l Conf. Information Systems, Seattle, Washington, Dec.<br />
Jones, R., H. Mendelson. 2010. Information goods vs. industrial goods: Cost structure and compe-<br />
tition. Management Sci., forthcoming.<br />
Lehmann, D. R., M. Esteban-Bravo. 2006. <strong>When</strong> giving some away makes sense to jump-start the<br />
diffusion process. Marketing Letters 17(4) 243–254.<br />
Mahajan, V., E. Muller, R. A. Kerin. 1984. Introduction strategy for new produts with positive and<br />
negative word-of-mouth. Management Sci. 30(12) 1389–1404.<br />
Microsoft. 2008. Microsoft gives students access to technical software at no charge to inspire success<br />
and make a difference. Microsoft press release, Feb 18.<br />
Miller, C. C. 2009. Ad revenue on the Web? No sure bet. <strong>New</strong> York Times http://www.<br />
nytimes.com/2009/05/25/technology/start-ups/25startup.html? r=1.<br />
Mussa, M., S. Rosen. 1978. Monopoly and product quality. J. Econ. Theory 18 301–317.<br />
Parker,G.G., M.W. VanAlstyne.2005. Two-sidednetworkeffects: Atheoryofinformationproduct<br />
design. Management Sci. 51(10) 1494–1504.<br />
Raghunathan, S. 2000. <strong>Software</strong> editions: An applicaiton of segmentation theory to the packaged<br />
software market. J. Management Info. Sys. 17(1) 87–114.<br />
Riggins, F. J. 2003. Market segmentation and information development costs in a two-tiered fee-<br />
based and sponsorship-based web site. J. Management Info. Sys. 19(3) 69–86.<br />
Rochet, J. C., J. Tirole. 2003. Platform competition in two-sided markets. J. European Econ. Assoc<br />
1(4) 990–1029.<br />
Rochet, J. C., J. Tirole.2006. Two-sided markets: a progressreport. RAND J. Econ. 37(3) 645–667.<br />
Sixteen Ventures. 2010. The reality of freemium in SaaS. http://sixteenventures.com/blog/the-<br />
reality-of-freemium-in-saas.html.<br />
Trusov, M., R. E. Bucklin, K. Pauwels. 2009. Effects of word-of-mouth versus traditional marketing:<br />
findings from an Internet social networking site. J. Marketing 73(5) 90–102.<br />
Wei, X., B. Nault. 2005. Product differentiation and market segmentation of information goods.<br />
Working paper, University of Calgary (available at SSRN: http://ssrn.com/abstract=909604).<br />
Wu, S., P. Chen. 2008. Versioning and piracy control for digital information goods. Oper. Res. 56(1)<br />
157–172.<br />
31