Identifying the Current and Future Population in Need of Adult ...
Identifying the Current and Future Population in Need of Adult ...
Identifying the Current and Future Population in Need of Adult ...

You also want an ePaper? Increase the reach of your titles
YUMPU automatically turns print PDFs into web optimized ePapers that Google loves.
A Companion Paper to<br />
A Primer on <strong>Adult</strong> Education <strong>in</strong> Texas<br />
<strong>Identify<strong>in</strong>g</strong> <strong>the</strong> <strong>Current</strong> <strong>and</strong><br />
<strong>Future</strong> <strong>Population</strong> <strong>in</strong> <strong>Need</strong> <strong>of</strong> <strong>Adult</strong> Education<br />
Texas Workforce Investment Council<br />
March 2010
The Texas Workforce Investment Council would like to acknowledge <strong>and</strong> thank <strong>the</strong> Office <strong>of</strong> <strong>the</strong> State<br />
Demographer for <strong>the</strong>ir extensive collaboration on this project. Dr. Karl Eschbach <strong>and</strong> his staff provided<br />
<strong>the</strong> data, projections, <strong>and</strong> <strong>the</strong> technical discussion about <strong>the</strong> methodologies <strong>in</strong> Appendix B.
Table <strong>of</strong> Contents<br />
Introduction ...............................................................................................................................1<br />
Statutory Directive .................................................................................................................................. 1<br />
Scope <strong>of</strong> Report ....................................................................................................................................... 1<br />
Def<strong>in</strong><strong>in</strong>g <strong>Adult</strong> Education ......................................................................................................................... 1<br />
<strong>Current</strong> <strong>Population</strong> <strong>in</strong> <strong>Need</strong> <strong>of</strong> <strong>Adult</strong> Education .........................................................................3<br />
Def<strong>in</strong><strong>in</strong>g <strong>Need</strong> ......................................................................................................................................... 3<br />
Description <strong>of</strong> <strong>the</strong> <strong>Current</strong> <strong>Population</strong> ..................................................................................................... 3<br />
Geographic Distribution <strong>of</strong> <strong>Current</strong> <strong>Need</strong> for <strong>Adult</strong> Education <strong>in</strong> Texas .....................................7<br />
The 28 Local Workforce Development Areas ........................................................................................... 7<br />
Summary Table <strong>of</strong> <strong>the</strong> Geographic Distribution <strong>of</strong> <strong>Current</strong> <strong>Need</strong>.............................................................. 8<br />
Projected <strong>Population</strong> <strong>in</strong> <strong>Need</strong> <strong>of</strong> <strong>Adult</strong> Education ......................................................................9<br />
Texas <strong>Population</strong> Trends .......................................................................................................................... 9<br />
Description <strong>of</strong> <strong>the</strong> <strong>Future</strong> <strong>Population</strong> ..................................................................................................... 10<br />
Geographic Distribution <strong>of</strong> Projected <strong>Need</strong> for <strong>Adult</strong> Education <strong>in</strong> Texas ................................13<br />
Projection Methodology by LWDA Summary ......................................................................................... 13<br />
Summary <strong>of</strong> <strong>the</strong> Geographic Distribution <strong>of</strong> Projected <strong>Need</strong> for <strong>Adult</strong> Education <strong>in</strong> Texas...................... 13<br />
Next Steps ................................................................................................................................15<br />
References ................................................................................................................................16<br />
Appendix A: <strong>Current</strong> <strong>Need</strong> for <strong>Adult</strong> Education by LWDA ........................................................17<br />
LWDA 1: Panh<strong>and</strong>le ............................................................................................................................... 17<br />
LWDA 2: South Pla<strong>in</strong>s ............................................................................................................................ 18<br />
LWDA 3: North Texas ............................................................................................................................. 19<br />
LWDA 4: North Central .......................................................................................................................... 20<br />
LWDA 5: Tarrant County ........................................................................................................................ 21<br />
LWDA 6: Dallas ...................................................................................................................................... 22<br />
LWDA 7: North East ............................................................................................................................... 23<br />
LWDA 8: East Texas ............................................................................................................................... 24<br />
LWDA 9: West Central ........................................................................................................................... 25<br />
LWDA 10: Upper Rio Gr<strong>and</strong>e ................................................................................................................. 26<br />
LWDA 11: Permian Bas<strong>in</strong> ....................................................................................................................... 27<br />
LWDA 12: Concho Valley ....................................................................................................................... 28<br />
LWDA 13: Heart <strong>of</strong> Texas ....................................................................................................................... 29<br />
LWDA 14: Capital Area .......................................................................................................................... 30<br />
LWDA 15: Rural Capital .......................................................................................................................... 31<br />
LWDA 16: Brazos Valley ......................................................................................................................... 32<br />
LWDA 17: Deep East Texas .................................................................................................................... 33
LWDA 18: South East Texas ................................................................................................................... 34<br />
LWDA 19: Golden Crescent .................................................................................................................... 35<br />
LWDA 20: Alamo ................................................................................................................................... 36<br />
LWDA 21: South Texas ........................................................................................................................... 37<br />
LWDA 22: Coastal Bend ......................................................................................................................... 38<br />
LWDA 23: Lower Rio Gr<strong>and</strong>e Valley ....................................................................................................... 39<br />
LWDA 24: Cameron County ................................................................................................................... 40<br />
LWDA 25: Texoma ................................................................................................................................. 41<br />
LWDA 26: Central Texas ........................................................................................................................ 42<br />
LWDA 27: Middle Rio Gr<strong>and</strong>e ................................................................................................................ 43<br />
LWDA 28: Gulf Coast ............................................................................................................................. 44<br />
Appendix B: Projection Methodologies ....................................................................................45<br />
Methodology <strong>of</strong> <strong>the</strong> <strong>Adult</strong> Education Projection .................................................................................... 45<br />
Allocat<strong>in</strong>g <strong>the</strong> Foreign-Born to Workforce Regions ................................................................................ 48<br />
Convert<strong>in</strong>g <strong>the</strong> Foreign-Born Projections to <strong>Adult</strong> Education Projections ............................................... 49<br />
Appendix C: Projected <strong>Need</strong> for <strong>Adult</strong> Education by LWDA .....................................................50<br />
LWDA 1: Panh<strong>and</strong>le ............................................................................................................................... 50<br />
LWDA 2: South Pla<strong>in</strong>s ............................................................................................................................ 50<br />
LWDA 3: North Texas ............................................................................................................................. 51<br />
LWDA 4: North Central .......................................................................................................................... 51<br />
LWDA 5: Tarrant County ........................................................................................................................ 51<br />
LWDA 6: Dallas ...................................................................................................................................... 52<br />
LWDA 7: North East ............................................................................................................................... 52<br />
LWDA 8: East Texas ............................................................................................................................... 52<br />
LWDA 9: West Central ........................................................................................................................... 53<br />
LWDA 10: Upper Rio Gr<strong>and</strong>e ................................................................................................................. 53<br />
LWDA 11: Permian Bas<strong>in</strong> ....................................................................................................................... 53<br />
LWDA 12: Concho Valley ....................................................................................................................... 54<br />
LWDA 13: Heart <strong>of</strong> Texas ....................................................................................................................... 54<br />
LWDA 14: Capital Area .......................................................................................................................... 54<br />
LWDA 15: Rural Capital .......................................................................................................................... 55<br />
LWDA 16: Brazos Valley ......................................................................................................................... 55<br />
LWDA 17: Deep East Texas .................................................................................................................... 55<br />
LWDA 18: South East Texas ................................................................................................................... 56<br />
LWDA 19: Golden Crescent .................................................................................................................... 56<br />
LWDA 20: Alamo ................................................................................................................................... 56<br />
LWDA 21: South Texas ........................................................................................................................... 57<br />
LWDA 22: Coastal Bend ......................................................................................................................... 57<br />
LWDA 23: Lower Rio Gr<strong>and</strong>e Valley ....................................................................................................... 57<br />
LWDA 24: Cameron County ................................................................................................................... 58<br />
LWDA 25: Texoma ................................................................................................................................. 58<br />
LWDA 26: Central Texas ........................................................................................................................ 58<br />
LWDA 27: Middle Rio Gr<strong>and</strong>e ................................................................................................................ 59<br />
LWDA 28: Gulf Coast ............................................................................................................................. 59
List <strong>of</strong> Tables<br />
Table 1: Individuals Eligible for <strong>Adult</strong> Education Services <strong>in</strong> Texas by Nativity, Fluency, <strong>and</strong> Educational<br />
Atta<strong>in</strong>ment (2006-2008) .......................................................................................................................... 4<br />
Table 2: Individuals Eligible for <strong>Adult</strong> Education Services <strong>in</strong> Texas by Nativity, Fluency, Race, <strong>and</strong><br />
Educational Atta<strong>in</strong>ment (2006-2008) ....................................................................................................... 6<br />
Table 3: Individuals Eligible for <strong>Adult</strong> Education Services <strong>in</strong> Texas by Local Workforce Development Area<br />
(2006-2008)............................................................................................................................................. 8<br />
Table 4: Projected Numbers <strong>of</strong> Individuals Eligible for <strong>Adult</strong> Education Services <strong>in</strong> Texas by Nativity,<br />
Fluency, <strong>and</strong> Education Level (2008-2040) ............................................................................................. 11<br />
Table 5: Projected Numbers <strong>of</strong> Individuals Eligible for <strong>Adult</strong> Education Services <strong>in</strong> Texas by Nativity,<br />
Fluency, Race, <strong>and</strong> Education Level (2008-2040) .................................................................................... 12<br />
Table 6: Projected Growth <strong>of</strong> Individuals <strong>Need</strong><strong>in</strong>g <strong>Adult</strong> Education by LWDA (2040) .............................. 14<br />
Table 7: LWDA 1 Panh<strong>and</strong>le- Individuals Eligible for <strong>Adult</strong> Education Services (2006-2008) .................... 17<br />
Table 8: LWDA 2 South Pla<strong>in</strong>s- Individuals Eligible for <strong>Adult</strong> Education Services (2006-2008) ................. 18<br />
Table 9: LWDA 3 North Texas- Individuals Eligible for <strong>Adult</strong> Education Services (2006-2008).................. 19<br />
Table 10: LWDA 4 North Central- Individuals Eligible for <strong>Adult</strong> Education Services (2006-2008) ............. 20<br />
Table 11: LWDA 5 Tarrant County- Individuals Eligible for <strong>Adult</strong> Education Services (2006-2008) ........... 21<br />
Table 12: LWDA 6 Dallas- Individuals Eligible for <strong>Adult</strong> Education Services (2006-2008) ......................... 22<br />
Table 13: LWDA 7 North East- Individuals Eligible for <strong>Adult</strong> Education Services (2006-2008) .................. 23<br />
Table 14: LWDA 8 East Texas- Individuals Eligible for <strong>Adult</strong> Education Services (2006-2008) .................. 24<br />
Table 15: LWDA 9 West Central- Individuals Eligible for <strong>Adult</strong> Education Services (2006-2008) .............. 25<br />
Table 16: LWDA 10 Upper Rio Gr<strong>and</strong>e- Individuals Eligible for <strong>Adult</strong> Education Services (2006-2008) .... 26<br />
Table 17: LWDA 11 Permian Bas<strong>in</strong>- Individuals Eligible for <strong>Adult</strong> Education Services (2006-2008) .......... 27<br />
Table 18: LWDA 12 Concho Valley- Individuals Eligible for <strong>Adult</strong> Education Services (2006-2008) .......... 28<br />
Table 19: LWDA 13 Heart <strong>of</strong> Texas- Individuals Eligible for <strong>Adult</strong> Education Services (2006-2008) .......... 29<br />
Table 20: LWDA 14 Capital Area- Individuals Eligible for <strong>Adult</strong> Education Services (2006-2008) ............. 30<br />
Table 21: LWDA 15 Rural Capital- Individuals Eligible for <strong>Adult</strong> Education Services (2006-2008) ............. 31<br />
Table 22: LWDA 16 Brazos Valley- Individuals Eligible for <strong>Adult</strong> Education Services (2006-2008) ............ 32<br />
Table 23: LWDA 17 Deep East Texas- Individuals Eligible for <strong>Adult</strong> Education Services (2006-2008) ....... 33<br />
Table 24: LWDA 18 South East Texas- Individuals Eligible for <strong>Adult</strong> Education Services (2006-2008) ...... 34<br />
Table 25: LWDA 19 Golden Crescent- Individuals Eligible for <strong>Adult</strong> Education Services (2006-2008) ....... 35<br />
Table 26: LWDA 20 Alamo- Individuals Eligible for <strong>Adult</strong> Education Services (2006-2008) ...................... 36<br />
Table 27: LWDA 21 South Texas- Individuals Eligible for <strong>Adult</strong> Education Services (2006-2008) .............. 37
Table 28: LWDA 22 Coastal Bend- Individuals Eligible for <strong>Adult</strong> Education Services (2006-2008) ............ 38<br />
Table 29: LWDA 23 Lower Rio Gr<strong>and</strong>e Valley- Individuals Eligible for <strong>Adult</strong> Education Services<br />
(2006-2008)........................................................................................................................................... 39<br />
Table 30: LWDA 24 Cameron County- Individuals Eligible for <strong>Adult</strong> Education Services (2006-2008) ...... 40<br />
Table 31: LWDA 25 Texoma- Individuals Eligible for <strong>Adult</strong> Education Services (2006-2008) .................... 41<br />
Table 32: LWDA 26 Central Texas- Individuals Eligible for <strong>Adult</strong> Education Services (2006-2008)............ 42<br />
Table 33: LWDA 27 Middle Rio Gr<strong>and</strong>e- Individuals Eligible for <strong>Adult</strong> Education Services (2006-2008) ... 43<br />
Table 34: LWDA 28 Gulf Coast- Individuals Eligible for <strong>Adult</strong> Education Services (2006-2008) ................ 44<br />
Table 35: Hispanic <strong>Population</strong> by Age <strong>and</strong> Immigrant Status, 2008 ........................................................ 46<br />
Table 36: Projected International Migration to Texas, Selected Years Assum<strong>in</strong>g 60% <strong>of</strong> Migration is<br />
International (Texas State Data Center Projections) ............................................................................... 47<br />
Table 37: Hypo<strong>the</strong>tical Annual Net Migration to Texas, U.S. Bureau <strong>of</strong> <strong>the</strong> Census Migration Projection<br />
Scenarios, Apply<strong>in</strong>g 10.4% Share <strong>of</strong> Net Migration to Texas ................................................................... 47<br />
Table 38: LWDA 1 Panh<strong>and</strong>le- Projected Numbers <strong>of</strong> Individuals Eligible for <strong>Adult</strong> Education Services<br />
(2010-2040)........................................................................................................................................... 50<br />
Table 39: LWDA 2 South Pla<strong>in</strong>s- Projected Numbers <strong>of</strong> Individuals Eligible for <strong>Adult</strong> Education Services<br />
(2010-2040)........................................................................................................................................... 50<br />
Table 40: LWDA 3 North Texas- Projected Numbers <strong>of</strong> Individuals Eligible for <strong>Adult</strong> Education Services<br />
(2010-2040)........................................................................................................................................... 51<br />
Table 41: LWDA 4 North Central- Projected Numbers <strong>of</strong> Individuals Eligible for <strong>Adult</strong> Education Services<br />
(2010-2040)........................................................................................................................................... 51<br />
Table 42: LWDA 5 Tarrant County- Projected Numbers <strong>of</strong> Individuals Eligible for <strong>Adult</strong> Education Services<br />
(2010-2040)........................................................................................................................................... 51<br />
Table 43: LWDA 6 Dallas- Projected Numbers <strong>of</strong> Individuals Eligible for <strong>Adult</strong> Education Services<br />
(2010-2040)........................................................................................................................................... 52<br />
Table 44: LWDA 7 North East- Projected Numbers <strong>of</strong> Individuals Eligible for <strong>Adult</strong> Education Services<br />
(2010-2040)........................................................................................................................................... 52<br />
Table 45: LWDA 8 East Texas- Projected Numbers <strong>of</strong> Individuals Eligible for <strong>Adult</strong> Education Services<br />
(2010-2040)........................................................................................................................................... 52<br />
Table 46: LWDA 9 West Central- Projected Numbers <strong>of</strong> Individuals Eligible for <strong>Adult</strong> Education Services<br />
(2010-2040)........................................................................................................................................... 53<br />
Table 47: LWDA 10 Upper Rio Gr<strong>and</strong>e- Projected Numbers <strong>of</strong> Individuals Eligible for <strong>Adult</strong> Education<br />
Services (2010-2040) ............................................................................................................................. 53<br />
Table 48: LWDA 11 Permian Bas<strong>in</strong>- Projected Numbers <strong>of</strong> Individuals Eligible for <strong>Adult</strong> Education Services<br />
(2010-2040)........................................................................................................................................... 53<br />
Table 49: LWDA 12 Concho Valley- Projected Numbers <strong>of</strong> Individuals Eligible for <strong>Adult</strong> Education Services<br />
(2010-2040)........................................................................................................................................... 54
Table 50: LWDA 13 Heart <strong>of</strong> Texas- Projected Numbers <strong>of</strong> Individuals Eligible for <strong>Adult</strong> Education<br />
Services (2010-2040) ............................................................................................................................. 54<br />
Table 51: LWDA 14 Capital Area- Projected Numbers <strong>of</strong> Individuals Eligible for <strong>Adult</strong> Education Services<br />
(2010-2040)........................................................................................................................................... 54<br />
Table 52: LWDA 15 Rural Capital- Projected Numbers <strong>of</strong> Individuals Eligible for <strong>Adult</strong> Education Services<br />
(2010-2040)........................................................................................................................................... 55<br />
Table 53: LWDA 16 Brazos Valley- Projected Numbers <strong>of</strong> Individuals Eligible for <strong>Adult</strong> Education Services<br />
(2010-2040)........................................................................................................................................... 55<br />
Table 54: LWDA 17 Deep East Texas- Projected Numbers <strong>of</strong> Individuals Eligible for <strong>Adult</strong> Education<br />
Services (2010-2040) ............................................................................................................................. 55<br />
Table 55: LWDA 18 South East Texas- Projected Numbers <strong>of</strong> Individuals Eligible for <strong>Adult</strong> Education<br />
Services (2010-2040) ............................................................................................................................. 56<br />
Table 56: LWDA 19 Golden Crescent- Projected Numbers <strong>of</strong> Individuals Eligible for <strong>Adult</strong> Education<br />
Services (2010-2040) ............................................................................................................................. 56<br />
Table 57: LWDA 20 Alamo - Projected Numbers <strong>of</strong> Individuals Eligible for <strong>Adult</strong> Education Services<br />
(2010-2040)........................................................................................................................................... 56<br />
Table 58: LWDA 21 South Texas- Projected Numbers <strong>of</strong> Individuals Eligible for <strong>Adult</strong> Education Services<br />
(2010-2040)........................................................................................................................................... 57<br />
Table 59: LWDA 22 Coastal Bend - Projected Numbers <strong>of</strong> Individuals Eligible for <strong>Adult</strong> Education Services<br />
(2010-2040)........................................................................................................................................... 57<br />
Table 60: LWDA 23 Lower Rio Gr<strong>and</strong>e Valley- Projected Numbers <strong>of</strong> Individuals Eligible for <strong>Adult</strong><br />
Education Services (2010-2040) ............................................................................................................. 57<br />
Table 61: LWDA 24 Cameron County- Projected Numbers <strong>of</strong> Individuals Eligible for <strong>Adult</strong> Education<br />
Services (2010-2040) ............................................................................................................................. 58<br />
Table 62: LWDA 25 Texoma- Projected Numbers <strong>of</strong> Individuals Eligible for <strong>Adult</strong> Education Services<br />
(2010-2040)........................................................................................................................................... 58<br />
Table 63: LWDA 26 Central- Projected Numbers <strong>of</strong> Individuals Eligible for <strong>Adult</strong> Education Services<br />
(2010-2040)........................................................................................................................................... 58<br />
Table 64: LWDA 27 Middle Rio Gr<strong>and</strong>e- Projected Numbers <strong>of</strong> Individuals Eligible for <strong>Adult</strong> Education<br />
Services (2010-2040) ............................................................................................................................. 59<br />
Table 65: LWDA 28 Gulf Coast- Projected Numbers <strong>of</strong> Individuals Eligible for <strong>Adult</strong> Education Services<br />
(2010-2040)........................................................................................................................................... 59
List <strong>of</strong> Figures<br />
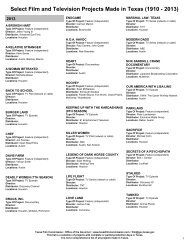
Figure 1: Texas Local Workforce Development Areas ............................................................................... 7<br />
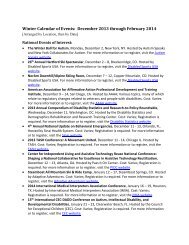
Figure 2: Projected <strong>Population</strong> Growth <strong>in</strong> Texas by Race/Ethnicity, 2000-2040 ........................................ 9
Introduction<br />
The Texas Workforce Investment Council (Council) was created <strong>in</strong> 1993 by <strong>the</strong> 73 rd Texas Legislature. As<br />
an advisory body to <strong>the</strong> Governor <strong>and</strong> <strong>the</strong> Legislature, <strong>the</strong> Council assists with strategic plann<strong>in</strong>g for <strong>and</strong><br />
evaluation <strong>of</strong> Texas’ workforce development system. The Council promotes <strong>the</strong> development <strong>of</strong> a welleducated,<br />
highly skilled workforce for Texas <strong>and</strong> advocates a workforce system that provides quality<br />
workforce education <strong>and</strong> tra<strong>in</strong><strong>in</strong>g opportunities. The 19-member Council <strong>in</strong>cludes representatives from<br />
bus<strong>in</strong>ess, labor, education, community-based organizations <strong>and</strong> <strong>the</strong> Council’s five member state<br />
agencies.<br />
Statutory Directive<br />
Under Title 10 Texas Government Code (TGC) Section 2308.1016, <strong>the</strong> Council is responsible for<br />
facilitat<strong>in</strong>g <strong>the</strong> efficient delivery <strong>of</strong> <strong>in</strong>tegrated adult education <strong>and</strong> literacy services <strong>in</strong> Texas. The Council<br />
is charged with evaluat<strong>in</strong>g <strong>the</strong> adult education programs adm<strong>in</strong>istered by <strong>the</strong> Texas Education Agency<br />
(TEA) <strong>and</strong> <strong>the</strong> Texas Workforce Commission (TWC) <strong>and</strong> identify<strong>in</strong>g duplication <strong>of</strong> plann<strong>in</strong>g, lack <strong>of</strong><br />
adequate client <strong>in</strong>formation shar<strong>in</strong>g, <strong>and</strong> any o<strong>the</strong>r problems that adversely affect <strong>the</strong> delivery <strong>of</strong> adult<br />
education <strong>and</strong> literacy programs.<br />
Build<strong>in</strong>g on earlier work presented <strong>in</strong> A First Look at Critical Issues Surround<strong>in</strong>g <strong>Adult</strong> Education <strong>and</strong><br />
Literacy <strong>in</strong> Texas (2003), <strong>the</strong> Council reviewed aspects <strong>of</strong> adult education focus<strong>in</strong>g largely on TEA’s adult<br />
education programs funded by Title II <strong>of</strong> <strong>the</strong> Workforce Investment Act <strong>of</strong> 1998 (Public Law 105-220).<br />
The Council also <strong>in</strong>cluded <strong>in</strong>formation about current adult education <strong>in</strong>itiatives at TWC <strong>and</strong> <strong>the</strong> Texas<br />
Higher Education Coord<strong>in</strong>at<strong>in</strong>g Board (THECB). This research was published <strong>in</strong> A Primer on <strong>Adult</strong><br />
Education <strong>in</strong> Texas (Primer) <strong>in</strong> January 2010. The Primer detailed adult education legislation, fund<strong>in</strong>g,<br />
<strong>the</strong> service delivery system, current <strong>and</strong> future populations <strong>in</strong> need <strong>of</strong> adult education services, <strong>and</strong><br />
program report<strong>in</strong>g <strong>and</strong> accountability. The Primer was written as a foundation upon which fur<strong>the</strong>r<br />
research could provide more detailed analyses <strong>of</strong> specific issue areas.<br />
Scope <strong>of</strong> Report<br />
This report is <strong>the</strong> first companion paper to A Primer on <strong>Adult</strong> Education <strong>in</strong> Texas. The analyses <strong>in</strong> this<br />
report use updated data that were not available when <strong>the</strong> Primer was written <strong>and</strong> utilize a more<br />
detailed methodology employed by <strong>the</strong> Office <strong>of</strong> <strong>the</strong> State Demographer. The data presented <strong>in</strong> this<br />
report should supersede <strong>the</strong> <strong>in</strong>itial data reported <strong>in</strong> <strong>the</strong> Primer. Between October 2009 <strong>and</strong> January<br />
2010, <strong>the</strong> Council worked with <strong>the</strong> Office <strong>of</strong> <strong>the</strong> State Demographer to conduct fur<strong>the</strong>r analyses <strong>of</strong> <strong>the</strong><br />
current population <strong>in</strong> need <strong>of</strong> adult education services, a more detailed estimate <strong>of</strong> <strong>the</strong> future need for<br />
services based on projections for <strong>the</strong> Texas population, <strong>and</strong> <strong>the</strong> geographic dispersion <strong>of</strong> need <strong>in</strong> Texas<br />
by local workforce development areas (LWDA). The Office <strong>of</strong> <strong>the</strong> State Demographer also provided<br />
detailed descriptions <strong>of</strong> <strong>the</strong> rationale <strong>and</strong> methodology used to produce <strong>the</strong> data <strong>and</strong> projections.<br />
Def<strong>in</strong><strong>in</strong>g <strong>Adult</strong> Education<br />
<strong>Adult</strong> education is <strong>of</strong>ten applied as a broad reference for numerous <strong>and</strong> dist<strong>in</strong>ct types <strong>of</strong> adult learn<strong>in</strong>g<br />
activities. For <strong>the</strong> purpose <strong>of</strong> <strong>the</strong> Council’s work, <strong>the</strong> def<strong>in</strong>ition <strong>of</strong> adult education is determ<strong>in</strong>ed by Title<br />
1
II <strong>of</strong> <strong>the</strong> 1998 Workforce Investment Act (WIA), <strong>the</strong> <strong>Adult</strong> Education <strong>and</strong> Family Literacy Act. WIA<br />
def<strong>in</strong>es adult education as <strong>the</strong> <strong>in</strong>struction <strong>and</strong> services below postsecondary level provided for<br />
<strong>in</strong>dividuals:<br />
Who are 16 years old <strong>and</strong> older,<br />
Not enrolled or required to be enrolled <strong>in</strong> secondary school under state law,<br />
<strong>and</strong> who:<br />
o Lack basic educational skills to function effectively <strong>in</strong> society,<br />
o Do not have a secondary diploma or equivalent, or<br />
o Are unable to speak, read, or write English.<br />
<strong>Adult</strong> education programs generally emphasize basic skills <strong>in</strong> read<strong>in</strong>g, writ<strong>in</strong>g, math, <strong>and</strong> English<br />
language competency to prepare adults for jobs or fur<strong>the</strong>r academic <strong>in</strong>struction. This def<strong>in</strong>ition, though<br />
somewhat narrowed by statutory parameters, provides a start<strong>in</strong>g po<strong>in</strong>t for underst<strong>and</strong><strong>in</strong>g <strong>the</strong> role <strong>of</strong><br />
adult education <strong>in</strong> workforce development. A fur<strong>the</strong>r discussion <strong>of</strong> <strong>the</strong> def<strong>in</strong>ition <strong>of</strong> adult education <strong>and</strong><br />
its limitations is <strong>in</strong>cluded <strong>in</strong> A Primer on <strong>Adult</strong> Education <strong>in</strong> Texas (TWIC, 2010).<br />
2
<strong>Current</strong> <strong>Population</strong> <strong>in</strong> <strong>Need</strong> <strong>of</strong> <strong>Adult</strong> Education<br />
Underst<strong>and</strong><strong>in</strong>g <strong>the</strong> current need for adult education services is critical to policy makers <strong>and</strong> practitioners<br />
<strong>in</strong> order to evaluate program effectiveness, design services, develop strategies, <strong>and</strong> make policy<br />
recommendations. This section describes <strong>the</strong> current Texas population <strong>in</strong> need <strong>of</strong> adult education<br />
services accord<strong>in</strong>g to <strong>the</strong> eligibility def<strong>in</strong>ition <strong>in</strong> Title II <strong>of</strong> WIA us<strong>in</strong>g data from <strong>the</strong> 2006-2008 American<br />
Community Survey. Results <strong>in</strong>dicate that 23.7% <strong>of</strong> <strong>the</strong> Texas population over <strong>the</strong> age <strong>of</strong> 16 (3,871,173<br />
<strong>in</strong>dividuals) met <strong>the</strong> federal def<strong>in</strong>ition <strong>and</strong> qualify for adult education services. The need for adult<br />
education services varies between racial <strong>and</strong> ethnic groups with Hispanics account<strong>in</strong>g for <strong>the</strong> largest<br />
percentages <strong>of</strong> <strong>in</strong>dividuals qualify<strong>in</strong>g for services <strong>in</strong> all but one <strong>of</strong> <strong>the</strong> educational atta<strong>in</strong>ment categories<br />
<strong>and</strong> whites account<strong>in</strong>g for <strong>the</strong> second largest percentage <strong>of</strong> English fluent <strong>in</strong>dividuals with less than a<br />
high school diploma or GED.<br />
Def<strong>in</strong><strong>in</strong>g <strong>Need</strong><br />
As discussed <strong>in</strong> <strong>the</strong> Introduction, <strong>the</strong> Council’s def<strong>in</strong>ition <strong>of</strong> adult education is determ<strong>in</strong>ed by Title II <strong>of</strong><br />
WIA. In this report, <strong>in</strong>dividuals who are not enrolled <strong>in</strong> secondary school <strong>and</strong> who are at least 16 years<br />
old are eligible for adult education services if <strong>the</strong>y have not earned a high school diploma (or GED) or are<br />
unable to speak, read, or write English. Calculat<strong>in</strong>g <strong>the</strong> numbers <strong>of</strong> <strong>in</strong>dividuals <strong>in</strong> Texas that meet <strong>the</strong>se<br />
eligibility requirements provides an idea <strong>of</strong> <strong>the</strong> current need for adult education services <strong>in</strong> <strong>the</strong> state.<br />
Description <strong>of</strong> <strong>the</strong> <strong>Current</strong> <strong>Population</strong><br />
To determ<strong>in</strong>e current need for adult education services <strong>in</strong> Texas, <strong>the</strong> Office <strong>of</strong> <strong>the</strong> State Demographer<br />
calculated <strong>the</strong> number <strong>of</strong> <strong>in</strong>dividuals who qualify for adult education by analyz<strong>in</strong>g <strong>the</strong> 2006-2008<br />
American Community Survey (ACS). The ACS is a nationwide survey conducted by <strong>the</strong> Census Bureau<br />
s<strong>in</strong>ce 2000. The ACS provides yearly demographic <strong>and</strong> socioeconomic data such as educational<br />
atta<strong>in</strong>ment, ability to speak English, <strong>and</strong> citizenship status <strong>and</strong> will replace <strong>the</strong> decennial census long<br />
form <strong>in</strong> 2010 (U.S. Census Bureau, 2001). Survey results are statistically weighted to approximate <strong>the</strong><br />
population <strong>of</strong> <strong>the</strong> state. The 2006-2008 multiyear estimates are based on data collected over three<br />
years <strong>and</strong> describe <strong>the</strong> average characteristics for that three year time period. For example, if <strong>the</strong><br />
number <strong>of</strong> <strong>in</strong>dividuals who have not completed high school <strong>in</strong> an area was 2,000 <strong>in</strong> 2006, 2,000 <strong>in</strong> 2007<br />
<strong>and</strong> 5,000 <strong>in</strong> 2008, <strong>the</strong> 2006-2008 three year estimate would be 3,000. Compared to some <strong>of</strong> <strong>the</strong> one<br />
year ACS estimates, like <strong>the</strong> 2007 ACS data used <strong>in</strong> <strong>the</strong> Primer, <strong>the</strong> 2006-2008 ACS data is less current.<br />
However, <strong>the</strong> three year estimates are more reliable s<strong>in</strong>ce <strong>the</strong>y are based on larger samples <strong>and</strong> also<br />
<strong>in</strong>clude <strong>in</strong>formation from smaller geographic areas (U.S. Census Bureau 2009a).<br />
The 2006-2008 ACS <strong>in</strong>dicates that <strong>the</strong>re were 17,956,534 <strong>in</strong>dividuals <strong>in</strong> Texas who were at least 16 years<br />
old. Of <strong>the</strong>se <strong>in</strong>dividuals, 16,334,198 were not secondary students. Of that number, 23.7% or 3,871,173<br />
qualified for adult education services because <strong>the</strong>y were not English fluent <strong>and</strong>/or did not have at least a<br />
high school diploma or GED. Look<strong>in</strong>g specifically at <strong>the</strong> group <strong>of</strong> <strong>in</strong>dividuals traditionally thought <strong>of</strong> as<br />
prime work<strong>in</strong>g age, between <strong>the</strong> ages <strong>of</strong> 16 <strong>and</strong> 64, 21.6% or 3,104,030 qualified for adult education<br />
services.<br />
Table 1 presents <strong>the</strong> numbers <strong>of</strong> <strong>in</strong>dividuals eligible for adult education services <strong>in</strong> Texas by nativity,<br />
fluency, <strong>and</strong> educational atta<strong>in</strong>ment. Information is provided for everyone who is at least 16 years old<br />
3
<strong>and</strong> for <strong>in</strong>dividuals between 16 <strong>and</strong> 64 years old. Of <strong>the</strong> 3,871,173 <strong>in</strong>dividuals over <strong>the</strong> age <strong>of</strong> 16 who<br />
qualify for adult education services, 2,202,852 are English fluent <strong>and</strong> have less than a high school level <strong>of</strong><br />
education. Of <strong>the</strong>se <strong>in</strong>dividuals, approximately 63% have atta<strong>in</strong>ed between a 9 th to 12 th grade education<br />
level.<br />
Table 1 <strong>in</strong>dicates that approximately 43% <strong>of</strong> Texans eligible for adult education services are unable to<br />
speak English. This large percentage <strong>of</strong> adult English as a second language (ESL) learners can be better<br />
understood by consider<strong>in</strong>g <strong>the</strong>ir nativity status, or where <strong>the</strong>y were born. Almost 90% <strong>of</strong> non-English<br />
fluent <strong>in</strong>dividuals over <strong>the</strong> age <strong>of</strong> 16 who qualify for adult education services <strong>in</strong> Texas are foreign born.<br />
These <strong>in</strong>dividuals <strong>in</strong> need <strong>of</strong> English literacy skills do not necessarily lack basic educational skills, though<br />
it is <strong>of</strong>ten <strong>the</strong> case. Of <strong>the</strong> <strong>in</strong>dividuals over <strong>the</strong> age <strong>of</strong> 16 who qualify for adult education services <strong>and</strong><br />
are not English fluent, 28% have a GED or higher level <strong>of</strong> educational atta<strong>in</strong>ment. For example, an<br />
immigrant may have a college degree from his or her home country but not be able to speak English.<br />
This <strong>in</strong>dividual is <strong>the</strong>refore literate <strong>and</strong> educated <strong>in</strong> his or her native language. The adult education<br />
services required by this <strong>in</strong>dividual would be very different compared to <strong>the</strong> services required by a<br />
native or foreign born <strong>in</strong>dividual who did not graduate high school <strong>and</strong> is unable to speak English.<br />
Provid<strong>in</strong>g English language skills to <strong>the</strong>se <strong>in</strong>dividuals could give <strong>the</strong>m <strong>the</strong> fluency necessary to f<strong>in</strong>d a job<br />
<strong>in</strong> which <strong>the</strong>y can utilize <strong>the</strong>ir education.<br />
Table 1: Individuals Eligible for <strong>Adult</strong> Education Services <strong>in</strong> Texas by Nativity, Fluency, <strong>and</strong> Educational<br />
Atta<strong>in</strong>ment (2006-2008)<br />
Not English Fluent, Not English Fluent,<br />
Educational English Fluent<br />
Native Born<br />
Foreign Born Total<br />
Atta<strong>in</strong>ment Age 16+ 16-64 16+ 16-64 16+ 16-64 16+ 16-64<br />
0 to 4th 208,518 129,255 50,368 15,158 282,242 204,539 541,128 348,952<br />
Grade<br />
(9.47%) (7.77%) (30.12%) (14.02%) (18.80%) (15.35%) (13.98%) (11.24%)<br />
5th to 8th 532,069 352,349 42,436 27,342 506,703 456,306 1,081,208 835,997<br />
Grade<br />
(24.15%) (21.19%) (25.39%) (25.29%) (33.76%) (34.23%) (27.93%) (26.93%)<br />
9th to 12th 1,462,265 1,181,430 21,393 18,813 297,250 284,424 1,780,908 1,484,667<br />
Grade (no<br />
diploma)<br />
(66.38%) (71.04%) (12.80%) (17.40%) (19.80%) (21.34%) (46.00%) (47.83%)<br />
High School * * 20,710 18,727 246,971 233,551 267,681 252,278<br />
Graduate<br />
* * (12.39%) (17.32%) (16.45%) (17.52%) (6.91%) (8.13%)<br />
GED * * 5,947 5,099 28,666 26,528 34,613 31,627<br />
* * (3.56%) (4.72%) (1.91%) (1.99%) (0.89%) (1.02%)<br />
Some College * * 15,713 13,874 81,173 76,158 96,886 90,032<br />
to 2-yr<br />
Degree<br />
* * (9.40%) (12.83%) (5.41%) (5.71%) (2.50%) (2.90%)<br />
Bachelors<br />
* * 10,599 9,090 58,150 51,387 68,749 60,477<br />
Degree <strong>and</strong><br />
Higher<br />
* * (6.34%) (8.41%) (3.87%) (3.86%) (1.78%) (1.95%)<br />
Total 2,202,852 1,663,034 167,166 108,103 1,501,155 1,332,893 3,871,173 3,104,030<br />
(100%) (100%) (100%) (100%) (100%) (100%) (100%) (100%)<br />
Table Notes: This table presents <strong>in</strong>formation for everyone over <strong>the</strong> age <strong>of</strong> 16 who qualifies for adult education <strong>and</strong> <strong>the</strong> subset<br />
<strong>of</strong> <strong>in</strong>dividuals who are between 16 <strong>and</strong> 64. Percentages represent <strong>in</strong>dividuals <strong>in</strong> each column. Asterisks are used as<br />
placeholders s<strong>in</strong>ce English fluent <strong>in</strong>dividuals who have at least graduated high school do not qualify for adult education.<br />
Individuals are considered not English fluent if <strong>the</strong>y report speak<strong>in</strong>g English “not well” or “not at all.”<br />
Source: Office <strong>of</strong> <strong>the</strong> State Demographer’s analysis <strong>of</strong> American Community Survey 2006-2008, three year estimate.<br />
4
The population <strong>in</strong> need <strong>of</strong> adult education services can be described <strong>in</strong> more detail by analyz<strong>in</strong>g data on<br />
race <strong>and</strong> ethnicity. Table 2 illustrates <strong>the</strong> numbers <strong>and</strong> percentages <strong>of</strong> <strong>in</strong>dividuals <strong>in</strong> each educational<br />
atta<strong>in</strong>ment category by race, nativity, <strong>and</strong> English fluency. Hispanics account for <strong>the</strong> largest percentages<br />
<strong>of</strong> <strong>in</strong>dividuals who qualify for services <strong>in</strong> all <strong>of</strong> <strong>the</strong> educational atta<strong>in</strong>ment categories except for<br />
Bachelors degree <strong>and</strong> higher for non-English fluent native born. Whites account for <strong>the</strong> second largest<br />
percentage <strong>of</strong> English fluent <strong>in</strong>dividuals with less than a high school diploma or GED.<br />
5
Table 2: Individuals Eligible for <strong>Adult</strong> Education Services <strong>in</strong> Texas by Nativity, Fluency, Race, <strong>and</strong><br />
Educational Atta<strong>in</strong>ment (2006-2008)<br />
Not English Not English<br />
Fluent, Native Fluent, Foreign<br />
Educational Race/ English Fluent Born<br />
Born Total<br />
Atta<strong>in</strong>ment Ethnicity Num % Num % Num % Num %<br />
0 to 4th White 49,254 24% 804 2% 2,877 1% 52,935 10%<br />
Grade Black 21,968 11% 0 0% 928 0% 22,896 4%<br />
Hisp. 130,455 63% 48,848 97% 265,211 94% 444,514 82%<br />
Asian 5,524 3% 248 0% 12,600 4% 18,372 3%<br />
O<strong>the</strong>r 1,317 1% 468 1% 626 0% 2,411 0%<br />
Total 208,518 100% 50,368 100% 282,242 100% 541,128 100%<br />
5th to 8th White 157,176 30% 388 1% 3,545 1% 161,109 15%<br />
Grade Black 49,808 9% 93 0% 876 0% 50,777 5%<br />
Hisp. 316,527 59% 41,909 99% 486,824 96% 845,260 78%<br />
Asian 5,501 1% 0 0% 14,333 3% 19,834 2%<br />
O<strong>the</strong>r 3,057 1% 46 0% 1,125 0% 4,228 0%<br />
Total 532,069 100% 42,436 100% 506,703 100% 1,081,208 100%<br />
9th to 12th White 584,023 40% 796 4% 1,916 1% 586,735 33%<br />
Grade (no Black 226,643 15% 107 1% 594 0% 227,344 13%<br />
diploma) Hisp. 623,293 43% 20,025 94% 278,010 94% 921,328 52%<br />
Asian 18,872 1% 243 1% 15,794 5% 34,909 2%<br />
O<strong>the</strong>r 9,434 1% 222 1% 936 0% 10,592 1%<br />
Total 1,462,265 100% 21,393 100% 297,250 100% 1,780,908 100%<br />
High School White * * 1,476 7% 4,634 2% 6,110 2%<br />
Graduate Black * * 495 2% 1,788 1% 2,283 1%<br />
Hisp. * * 18,665 90% 214,402 87% 233,067 87%<br />
Asian * * 104 1% 25,593 10% 25,697 10%<br />
O<strong>the</strong>r * * 24 0% 616 0% 640 0%<br />
Total * * 20,764 100% 247,033 100% 267,797 100%<br />
GED White * * 551 9% 704 2% 1,255 4%<br />
Black * * 0 0% 0 0% 0 0%<br />
Hisp. * * 5,342 91% 24,939 87% 30,281 88%<br />
Asian * * 0 0% 2,961 10% 2,961 9%<br />
O<strong>the</strong>r * * 0 0% 0 0% 0 0%<br />
Total * * 5,893 100% 28,604 100% 34,497 100%<br />
Some White * * 4,430 28% 2,728 3% 7,158 7%<br />
College to Black * * 769 5% 445 1% 1,214 1%<br />
2-yr Degree Hisp. * * 10,221 65% 68,188 84% 78,409 81%<br />
Asian * * 176 1% 9,624 12% 9,800 10%<br />
O<strong>the</strong>r * * 117 1% 188 0% 305 0%<br />
Total * * 15,713 100% 81,173 100% 96,886 100%<br />
Bachelors White * * 4,837 46% 3,555 6% 8,392 12%<br />
Degree <strong>and</strong> Black * * 444 4% 431 1% 875 1%<br />
Higher Hisp. * * 4,602 43% 40,162 69% 44,764 65%<br />
Asian * * 678 6% 13,941 24% 14,619 21%<br />
O<strong>the</strong>r * * 38 0% 61 0% 99 0%<br />
Total * * 10,599 100% 58,150 100% 68,749 100%<br />
Source: Office <strong>of</strong> <strong>the</strong> State Demographer’s analysis <strong>of</strong> American Community Survey 2006-2008, three year estimate.<br />
6
Geographic Distribution <strong>of</strong> <strong>Current</strong> <strong>Need</strong> for <strong>Adult</strong> Education <strong>in</strong> Texas<br />
As part <strong>of</strong> <strong>the</strong> demographic research conducted by <strong>the</strong> Office <strong>of</strong> <strong>the</strong> State Demographer, <strong>the</strong> Council<br />
asked that <strong>the</strong> geographic distribution <strong>of</strong> <strong>the</strong> need for adult education <strong>in</strong> Texas be determ<strong>in</strong>ed. The<br />
Office <strong>of</strong> <strong>the</strong> State Demographer calculated <strong>the</strong> numbers <strong>of</strong> <strong>in</strong>dividuals over <strong>the</strong> age <strong>of</strong> 16 who qualify<br />
for adult education <strong>in</strong> each <strong>of</strong> <strong>the</strong> 28 local workforce development areas (LWDA) us<strong>in</strong>g <strong>the</strong> 2006-2008<br />
American Community Survey. Gulf Coast, Dallas, <strong>and</strong> Alamo have <strong>the</strong> highest total percentages <strong>of</strong><br />
<strong>in</strong>dividuals eligible for adult education services <strong>in</strong> Texas.<br />
The 28 Local Workforce Development Areas<br />
Under Title 10 TGC Sections 2308.1015 <strong>and</strong> 2308.1016, <strong>the</strong> Council is responsible for facilitat<strong>in</strong>g <strong>the</strong><br />
delivery <strong>of</strong> <strong>in</strong>tegrated workforce services <strong>and</strong> <strong>the</strong> efficient delivery <strong>of</strong> <strong>in</strong>tegrated adult education <strong>and</strong><br />
literacy services <strong>in</strong> Texas. To assist workforce system stakeholders <strong>in</strong> coord<strong>in</strong>at<strong>in</strong>g program plann<strong>in</strong>g<br />
<strong>and</strong> delivery <strong>and</strong> <strong>in</strong> design<strong>in</strong>g <strong>in</strong>tegrated services, <strong>the</strong> Council selected <strong>the</strong> 28 local workforce<br />
development areas as <strong>the</strong> sub-state regions that <strong>the</strong> Office <strong>of</strong> <strong>the</strong> State Demographer would use to<br />
analyze <strong>the</strong> geographic distribution <strong>of</strong> <strong>the</strong> current <strong>and</strong> projected populations <strong>in</strong> need <strong>of</strong> adult education<br />
services. These geographic regions are widely recognized among system stakeholders <strong>and</strong> are <strong>the</strong><br />
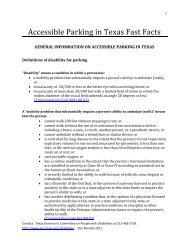
boundaries with<strong>in</strong> which fund<strong>in</strong>g flows for a number <strong>of</strong> workforce programs <strong>and</strong> <strong>in</strong>itiatives. Figure 1<br />
illustrates <strong>the</strong> 28 local workforce development areas throughout <strong>the</strong> state.<br />
1. Panh<strong>and</strong>le<br />
2. South Pla<strong>in</strong>s<br />
3. North Texas<br />
4. North Central<br />
5. Tarrant County<br />
6. Dallas<br />
7. North East<br />
8. East Texas<br />
9. West Central<br />
10. Upper Rio Gr<strong>and</strong>e<br />
11. Permian Bas<strong>in</strong><br />
12. Concho Valley<br />
13. Heart <strong>of</strong> Texas<br />
14. Capital Area<br />
15. Rural Capital<br />
16. Brazos Valley<br />
17. Deep East Texas<br />
18. South East Texas<br />
19. Golden Crescent<br />
20. Alamo<br />
21. South Texas<br />
22. Coastal Bend<br />
23. Lower Rio Gr<strong>and</strong>e Valley<br />
24. Cameron County<br />
25. Texoma<br />
26. Central Texas<br />
27. Middle Rio Gr<strong>and</strong>e<br />
28. Gulf Coast<br />
Figure 1: Texas Local Workforce Development Areas<br />
7
Summary Table <strong>of</strong> <strong>the</strong> Geographic Distribution <strong>of</strong> <strong>Current</strong> <strong>Need</strong><br />
Appendix A presents <strong>the</strong> numbers <strong>of</strong> <strong>in</strong>dividuals over <strong>the</strong> age <strong>of</strong> 16 eligible for adult education services<br />
<strong>in</strong> each LWDA by nativity, fluency, <strong>and</strong> educational atta<strong>in</strong>ment. Table 3 summarizes <strong>the</strong> total numbers<br />
<strong>of</strong> <strong>in</strong>dividuals eligible for adult education services <strong>in</strong> each LWDA. Gulf Coast has <strong>the</strong> highest percentages<br />
<strong>of</strong> <strong>in</strong>dividuals <strong>in</strong> all three categories (English fluent; not English fluent-native born; <strong>and</strong> not English<br />
fluent-foreign born) followed by Dallas <strong>and</strong> Alamo.<br />
Table 3: Individuals Eligible for <strong>Adult</strong> Education Services <strong>in</strong> Texas by Local Workforce Development<br />
Area (2006-2008)<br />
Not English Fluent, Not English Fluent,<br />
English Fluent Native Born Foreign Born Total<br />
LWDA<br />
Number Percent Number Percent Number Percent Number Percent<br />
1. Panh<strong>and</strong>le 47,338 2.15% 1,837 1.10% 16,093 1.07% 65,269 1.69%<br />
2. South Pla<strong>in</strong>s 44,570 2.02% 3,989 2.39% 7,083 0.47% 55,642 1.44%<br />
3. North Texas 24,636 1.12% 542 0.32% 3,579 0.24% 28,757 0.74%<br />
4. North Central 145,488 6.60% 4,223 2.53% 75,570 5.03% 225,281 5.82%<br />
5. Tarrant County 133,891 6.08% 5,520 3.30% 94,801 6.32% 234,211 6.05%<br />
6. Dallas 221,708 10.06% 9,561 5.72% 250,948 16.72% 482,217 12.46%<br />
7. North East 34,352 1.56% 409 0.24% 7,773 0.52% 42,534 1.10%<br />
8. East Texas 93,761 4.26% 1,511 0.90% 20,758 1.38% 116,030 3.00%<br />
9. West Central 39,017 1.77% 1,526 0.91% 4,949 0.33% 45,492 1.18%<br />
10. Upper Rio 62,501 2.84% 13,335 7.98% 89,343 5.95% 165,179 4.27%<br />
11. Permian Bas<strong>in</strong> 50,908 2.31% 4,057 2.43% 21,080 1.40% 76,044 1.96%<br />
12. Concho Valley 18,361 0.83% 1,407 0.84% 4,249 0.28% 24,018 0.62%<br />
13. Heart <strong>of</strong> Texas 38,874 1.76% 1,170 0.70% 11,856 0.79% 51,900 1.34%<br />
14. Capital Area 56,794 2.58% 4,588 2.74% 61,045 4.07% 122,428 3.16%<br />
15. Rural Capital 55,101 2.50% 3,523 2.11% 25,546 1.70% 84,170 2.17%<br />
16. Brazos Valley 26,267 1.19% 481 0.29% 8,901 0.59% 35,648 0.92%<br />
17. Deep East Texas 49,484 2.25% 848 0.51% 9,902 0.66% 60,234 1.56%<br />
18. South East Texas 42,854 1.95% 397 0.24% 8,735 0.58% 51,986 1.34%<br />
19. Golden Crescent 25,479 1.16% 1,400 0.84% 4,820 0.32% 31,700 0.82%<br />
20. Alamo 206,170 9.36% 19,536 11.69% 76,316 5.08% 302,022 7.80%<br />
21. South Texas 21,215 0.96% 10,024 6.00% 38,072 2.54% 69,311 1.79%<br />
22. Coastal Bend 75,431 3.42% 11,737 7.02% 15,624 1.04% 102,793 2.66%<br />
23. Lower Rio 80,391 3.65% 21,304 12.74% 118,630 7.90% 220,325 5.69%<br />
24. Cameron County 40,339 1.83% 9,622 5.76% 50,454 3.36% 100,415 2.59%<br />
25. Texoma 18,841 0.86% 320 0.19% 4,184 0.28% 3,345 0.60%<br />
26. Central Texas 32,455 1.47% 2,044 1.22% 6,001 0.40% 40,500 1.05%<br />
27. Middle Rio 19,910 0.90% 5,917 3.54% 18,458 1.23% 44,285 1.14%<br />
28. Gulf Coast 496,700 22.55% 26,337 15.76% 446,377 29.74% 969,414 25.04%<br />
Total 2,202,837 100% 167,164 100% 1,501,148 100% 3,871,149 100%<br />
Table Notes: Percentages represent <strong>in</strong>dividuals <strong>in</strong> each column. LWDA totals do not equal <strong>the</strong> statewide totals presented <strong>in</strong><br />
Table 1 because <strong>of</strong> round<strong>in</strong>g.<br />
Source: Office <strong>of</strong> <strong>the</strong> State Demographer’s analysis <strong>of</strong> American Community Survey 2006-2008, three year estimate.<br />
8
Projected <strong>Population</strong> <strong>in</strong> <strong>Need</strong> <strong>of</strong> <strong>Adult</strong> Education<br />
Between 2008 <strong>and</strong> 2040, <strong>the</strong> population <strong>of</strong> Texas is projected to grow by 47%. Changes <strong>in</strong> <strong>the</strong><br />
racial/ethnic composition <strong>of</strong> <strong>the</strong> state will also occur between 2008 <strong>and</strong> 2040 with <strong>the</strong> Hispanic<br />
population grow<strong>in</strong>g rapidly. As <strong>the</strong> state’s population changes, <strong>the</strong> number <strong>of</strong> <strong>in</strong>dividuals who qualify<br />
for adult education services will also change. By 2040, current <strong>and</strong> projected population trends <strong>in</strong>dicate<br />
that 7,919,901 Texans will be eligible for adult education services. This is a 99% <strong>in</strong>crease from 2008.<br />
Additionally, Hispanics will represent an <strong>in</strong>creas<strong>in</strong>gly larger percentage <strong>of</strong> <strong>the</strong> total <strong>in</strong>dividuals who<br />
qualify for adult education <strong>in</strong> <strong>the</strong> future, <strong>in</strong>creas<strong>in</strong>g from 2,677,670 (67% <strong>of</strong> <strong>the</strong> total) <strong>in</strong> 2008 to<br />
5,897,462 (74% <strong>of</strong> <strong>the</strong> total) <strong>in</strong> 2040.<br />
Texas <strong>Population</strong> Trends<br />
Texas is <strong>the</strong> second most populous <strong>and</strong> <strong>the</strong> third fastest-grow<strong>in</strong>g state <strong>in</strong> <strong>the</strong> U.S. From 2000 to 2008,<br />
<strong>the</strong> population <strong>of</strong> Texas grew by 16.7% whereas <strong>the</strong> population <strong>of</strong> <strong>the</strong> U.S. <strong>in</strong>creased by 8%. By 2008,<br />
Texas’ population was 24,326,974 <strong>and</strong> projections <strong>in</strong>dicate that <strong>the</strong> population will be 35,761,165 <strong>in</strong><br />
2040. Texas also has <strong>the</strong> fourth highest total fertility rate <strong>in</strong> <strong>the</strong> U.S. <strong>and</strong> a younger population than <strong>the</strong><br />
national average. The median age <strong>in</strong> Texas was 32.3 <strong>in</strong> 2000 whereas <strong>the</strong> national median age was 35.3.<br />
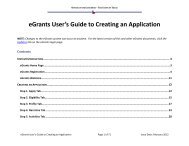
The racial <strong>and</strong> ethnic composition <strong>of</strong> <strong>the</strong> Texas population is also chang<strong>in</strong>g rapidly. The number <strong>of</strong><br />
whites is grow<strong>in</strong>g at a slower rate <strong>and</strong> each year accounts for a smaller percentage <strong>of</strong> <strong>the</strong> Texas<br />
population. However, <strong>the</strong> Hispanic population is grow<strong>in</strong>g rapidly. Projections from <strong>the</strong> Texas State Data<br />
Center <strong>in</strong>dicate that from 2000 to 2040, <strong>the</strong> Hispanic population <strong>in</strong> Texas will <strong>in</strong>crease by approximately<br />
182%. Figure 2 illustrates <strong>the</strong> projected growth <strong>in</strong> <strong>the</strong> Texas population by ethnicity.<br />
Figure 2: Projected <strong>Population</strong> Growth <strong>in</strong> Texas by Race/Ethnicity, 2000-2040<br />
Figure Notes: Projections assume net migration rates equal to one-half <strong>of</strong> those <strong>of</strong> <strong>the</strong> 1990s (0.5 scenario).<br />
Figure Source: Texas State Data Center projections.<br />
9
Three population trends, high school graduation, English fluency, <strong>and</strong> nativity, will be important<br />
<strong>in</strong>dicators <strong>of</strong> <strong>the</strong> future numbers <strong>of</strong> <strong>in</strong>dividuals who will qualify for adult education services unless<br />
current gaps <strong>in</strong> educational atta<strong>in</strong>ment are significantly reduced. Even though <strong>the</strong> percentages <strong>of</strong><br />
Texans graduat<strong>in</strong>g high school or earn<strong>in</strong>g a GED have <strong>in</strong>creased between 2000 <strong>and</strong> 2008, Texas has a<br />
smaller percentage <strong>of</strong> high school graduates when compared to <strong>the</strong> U.S. In 2000, 75.7% <strong>of</strong> Texans over<br />
<strong>the</strong> age <strong>of</strong> 25 had graduated high school whereas <strong>the</strong> percentage for <strong>the</strong> U.S. was 80.4%. In 2006-2008,<br />
79.2% <strong>of</strong> Texans over <strong>the</strong> age <strong>of</strong> 25 had graduated high school whereas <strong>the</strong> national average was 84.5%.<br />
Texas also has higher percentages <strong>of</strong> people speak<strong>in</strong>g a language o<strong>the</strong>r than English at home. In 2000,<br />
31.2% <strong>of</strong> <strong>the</strong> Texas population reported speak<strong>in</strong>g a language o<strong>the</strong>r than English at home whereas <strong>the</strong><br />
U.S. percentage was 17.9%. By 2005-2007, <strong>the</strong> percentage <strong>of</strong> Texans speak<strong>in</strong>g a language o<strong>the</strong>r than<br />
English at home <strong>in</strong>creased to 33.5%.<br />
Lastly, Texas’ population also has a greater percentage <strong>of</strong> foreign-born <strong>in</strong>dividuals than <strong>the</strong> U.S.<br />
population. In 2000, foreign-born <strong>in</strong>dividuals accounted for 13.9% <strong>of</strong> Texas’ population <strong>and</strong> 11.1% <strong>of</strong> <strong>the</strong><br />
U.S. population. The percentage <strong>of</strong> foreign-born <strong>in</strong>dividuals <strong>in</strong> Texas rose to 15.8% <strong>in</strong> 2005-2007.<br />
Description <strong>of</strong> <strong>the</strong> <strong>Future</strong> <strong>Population</strong><br />
Texas’ population trends suggest that <strong>the</strong> need for adult education services will <strong>in</strong>crease <strong>in</strong> <strong>the</strong> future.<br />
To determ<strong>in</strong>e <strong>the</strong> future need for adult education services <strong>in</strong> Texas, <strong>the</strong> Office <strong>of</strong> <strong>the</strong> State Demographer<br />
used ACS data <strong>in</strong> conjunction with projections from <strong>the</strong> State Data Center to calculate <strong>the</strong> number <strong>of</strong><br />
<strong>in</strong>dividuals who will qualify for adult education <strong>in</strong> 2010, 2015, 2020, 2030, <strong>and</strong> 2040. A detailed<br />
explanation <strong>of</strong> <strong>the</strong> projection methodology is <strong>in</strong>cluded <strong>in</strong> Appendix B. In short, <strong>the</strong> projections are<br />
relatively conservative <strong>and</strong> assume rates <strong>of</strong> net migration that are half <strong>of</strong> those observed <strong>in</strong> <strong>the</strong> 1990s<br />
(<strong>the</strong> 0.5 migration scenario). Additionally, projections <strong>of</strong> <strong>in</strong>ternational migration were made us<strong>in</strong>g<br />
assumptions derived by calculat<strong>in</strong>g <strong>the</strong> composition <strong>of</strong> recent immigrants to <strong>the</strong> state from <strong>the</strong> 2006-<br />
2008 ACS microdata file <strong>and</strong> comparisons with national trends generated by <strong>the</strong> U.S. Census Bureau.<br />
Table 4 illustrates <strong>the</strong> projected numbers <strong>of</strong> <strong>in</strong>dividuals eligible for adult education services <strong>in</strong> Texas by<br />
nativity, fluency, <strong>and</strong> education level for 2008 through 2040. Data for 2008 is provided by two separate<br />
sources <strong>and</strong> can be somewhat confus<strong>in</strong>g. The “2008 s<strong>in</strong>gle year ACS data” reflects <strong>the</strong> s<strong>in</strong>gle year survey<br />
estimates. The “2008 (2006-2008 rates)” values reflect <strong>the</strong> three year ACS estimates applied to <strong>the</strong><br />
2008 population. Apply<strong>in</strong>g <strong>the</strong> 2006-2008 rates to <strong>the</strong> 2008 population allows for <strong>the</strong> more reliable 3<br />
year rates to be applied to <strong>the</strong> most current 2008 population. Projections us<strong>in</strong>g <strong>the</strong> 2006-2008 rates<br />
<strong>in</strong>dicate that 7,919,901 Texans will be eligible for adult education services by 2040. This is a 99%<br />
<strong>in</strong>crease from 2008 with <strong>the</strong> 2006-2008 rates. Look<strong>in</strong>g at each <strong>of</strong> <strong>the</strong> educational atta<strong>in</strong>ment levels<br />
separately, Texas will see <strong>the</strong> largest <strong>in</strong>crease (242%) <strong>in</strong> non-English fluent <strong>in</strong>dividuals with less than a<br />
high school education between 2008 <strong>and</strong> 2040. Generally, projections <strong>in</strong>dicate greater <strong>in</strong>creases <strong>in</strong> <strong>the</strong><br />
need for adult education for <strong>the</strong> native born than for <strong>the</strong> foreign born at all three education levels.<br />
10
Table 4: Projected Numbers <strong>of</strong> Individuals Eligible for <strong>Adult</strong> Education Services <strong>in</strong> Texas by Nativity,<br />
Fluency, <strong>and</strong> Education Level (2008-2040)<br />
Year<br />
Less than<br />
HS,<br />
English<br />
Fluent<br />
Native Born Foreign Born<br />
Less than<br />
HS, Not<br />
English<br />
Fluent<br />
HS <strong>and</strong><br />
above,<br />
Not<br />
English<br />
Fluent<br />
Less than<br />
HS,<br />
English<br />
Fluent<br />
Less than<br />
HS, Not<br />
English<br />
Fluent<br />
HS <strong>and</strong><br />
above,<br />
Not<br />
English<br />
Fluent<br />
2008 s<strong>in</strong>gle year ACS<br />
data 1,666,345 115,109 51,822 496,643 1,106,745 418,206 3,854,870<br />
2008 (2006-2008 rates) 1,773,940 118,480 54,603 484,998 1,118,971 426,095 3,977,086<br />
2010 1,876,708 127,056 59,692 509,897 1,178,349 443,904 4,195,606<br />
2015 2,108,779 155,098 69,791 573,346 1,333,482 484,964 4,725,459<br />
2020 2,393,320 191,742 82,105 635,446 1,492,330 523,007 5,317,949<br />
2030 3,043,037 287,652 111,286 753,493 1,826,164 591,667 6,613,299<br />
2040 3,680,269 405,214 144,436 859,811 2,165,572 664,598 7,919,901<br />
Table Notes: The 2008 ACS data are from a s<strong>in</strong>gle year. The 2008 (2006-2008 rates) data <strong>in</strong>dicate <strong>the</strong> 2006-2008, three year<br />
rates applied to <strong>the</strong> 2008 population. Projections assume rates <strong>of</strong> net migration that are half <strong>of</strong> those observed <strong>in</strong> <strong>the</strong> 1990s<br />
(0.5 migration scenario), as recommended by <strong>the</strong> Office <strong>of</strong> <strong>the</strong> State Demographer for long range projections <strong>and</strong> use <strong>the</strong> 2006-<br />
2008 ACS rates for adult education need.<br />
Source: Office <strong>of</strong> <strong>the</strong> State Demographer.<br />
Total<br />
The projected population <strong>in</strong> need <strong>of</strong> adult education services can be described <strong>in</strong> more detail by<br />
analyz<strong>in</strong>g data on race <strong>and</strong> ethnicity. Table 5 illustrates <strong>the</strong> projected numbers <strong>of</strong> <strong>in</strong>dividuals <strong>in</strong> each<br />
educational atta<strong>in</strong>ment category by race, nativity, <strong>and</strong> English fluency for 2008 through 2040. Hispanics<br />
account for <strong>the</strong> largest projected percentages <strong>of</strong> <strong>in</strong>dividuals who will qualify for services for each year.<br />
Additionally, Hispanics will represent an <strong>in</strong>creas<strong>in</strong>gly larger percentage <strong>of</strong> <strong>the</strong> total <strong>in</strong>dividuals who<br />
qualify for adult education <strong>in</strong> <strong>the</strong> future. The percentage <strong>of</strong> Hispanics qualify<strong>in</strong>g for adult education is<br />
projected to <strong>in</strong>crease from 2,677,670 (67% <strong>of</strong> <strong>the</strong> total) <strong>in</strong> 2008 to 5,897,462 (74% <strong>of</strong> <strong>the</strong> total) <strong>in</strong> 2040.<br />
11
Table 5: Projected Numbers <strong>of</strong> Individuals Eligible for <strong>Adult</strong> Education Services <strong>in</strong> Texas by Nativity,<br />
Fluency, Race, <strong>and</strong> Education Level (2008-2040)<br />
Less than<br />
HS,<br />
English<br />
Native Born Foreign Born<br />
Less than<br />
HS, Not<br />
English<br />
HS <strong>and</strong><br />
above,<br />
Not<br />
English<br />
Less<br />
than HS,<br />
English<br />
Less than<br />
HS, Not<br />
English<br />
HS <strong>and</strong><br />
above,<br />
Not<br />
English<br />
Percent<br />
<strong>of</strong> Total<br />
for Each<br />
Year<br />
Race/<br />
Ethnic Fluent Fluent Fluent Fluent Fluent Fluent Total Year<br />
2008 White 721,126 2,274 11,358 23,341 10,888 14,701 783,688 20%<br />
s<strong>in</strong>gle<br />
year<br />
ACS<br />
Black<br />
Hisp.<br />
287,601<br />
647,521<br />
268<br />
111,281<br />
1,068<br />
38,487<br />
6,741<br />
436,409<br />
1,781<br />
1,049,083<br />
2,542<br />
345,862<br />
300,001<br />
2,628,643<br />
8%<br />
68%<br />
data O<strong>the</strong>r 10,097 1,286 909 30,152 44,993 55,101 142,538 4%<br />
Total 1,666,345 115,109 51,822 496,643 1,106,745 418,206 3,854,870 100%<br />
2008 White 780,571 2,040 11,468 24,031 9,310 12,841 840,262 21%<br />
(2006- Black 297,455 202 1,738 6,327 2,577 2,808 311,105 8%<br />
2008 Hisp. 683,216 115,115 40,321 424,237 1,059,479 355,302 2,677,670 67%<br />
rates) O<strong>the</strong>r 12,697 1,123 1,076 30,403 47,605 55,145 148,050 4%<br />
Total 1,773,940 118,480 54,603 484,998 1,118,971 426,095 3,977,086 100%<br />
White 801,704 2,109 11,736 25,348 9,784 13,599 864,280 21%<br />
2010<br />
Black<br />
Hisp.<br />
306,795<br />
755,853<br />
207<br />
123,646<br />
1,782<br />
45,126<br />
6,954<br />
444,532<br />
2,872<br />
1,112,897<br />
3,057<br />
367,258<br />
321,668<br />
2,849,311<br />
8%<br />
68%<br />
O<strong>the</strong>r 12,357 1,093 1,047 33,063 52,795 59,990 160,347 4%<br />
Total 1,876,708 127,056 59,692 509,897 1,178,349 443,904 4,195,606 100%<br />
White 839,839 2,267 11,918 29,069 11,084 15,430 909,607 19%<br />
2015<br />
Black<br />
Hisp.<br />
337,275<br />
916,984<br />
235<br />
151,297<br />
1,895<br />
54,733<br />
8,652<br />
494,691<br />
3,601<br />
1,250,011<br />
3,634<br />
391,463<br />
355,291<br />
3,259,179<br />
8%<br />
69%<br />
O<strong>the</strong>r 14,682 1,299 1,244 40,933 68,787 74,437 201,382 4%<br />
Total 2,108,779 155,098 69,791 573,346 1,333,482 484,964 4,725,459 100%<br />
White 882,501 2,448 12,066 33,053 12,507 17,690 960,265 18%<br />
2020<br />
Black<br />
Hisp.<br />
373,257<br />
1,120,427<br />
275<br />
187,503<br />
1,980<br />
66,607<br />
10,253<br />
542,530<br />
4,295<br />
1,388,233<br />
4,290<br />
410,675<br />
394,351<br />
3,715,974<br />
7%<br />
70%<br />
O<strong>the</strong>r 17,135 1,516 1,452 49,609 87,295 90,351 247,359 5%<br />
Total 2,393,320 191,742 82,105 635,446 1,492,330 523,007 5,317,949 100%<br />
White 951,832 2,765 12,143 41,883 15,612 22,324 1,046,559 16%<br />
2030<br />
Black<br />
Hisp.<br />
445,416<br />
1,623,029<br />
364<br />
282,509<br />
2,105<br />
95,108<br />
14,690<br />
630,512<br />
6,193<br />
1,677,271<br />
5,993<br />
441,807<br />
474,760<br />
4,750,237<br />
7%<br />
72%<br />
O<strong>the</strong>r 22,761 2,014 1,929 66,408 127,087 121,544 341,743 5%<br />
Total 3,043,037 287,652 111,286 753,493 1,826,164 591,667 6,613,299 100%<br />
White 940,934 2,753 11,884 52,040 19,127 27,468 1,054,206 13%<br />
2040<br />
Black<br />
Hisp.<br />
486,593<br />
2,223,565<br />
401<br />
399,479<br />
2,208<br />
127,872<br />
18,848<br />
705,145<br />
7,979<br />
1,966,361<br />
7,589<br />
475,040<br />
523,618<br />
5,897,462<br />
7%<br />
74%<br />
O<strong>the</strong>r 29,176 2,581 2,473 83,779 172,105 154,501 444,615 6%<br />
Total 3,680,269 405,214 144,436 859,811 2,165,572 664,598 7,919,901 100%<br />
Table Notes: Projections assume rates <strong>of</strong> net migration that are half <strong>of</strong> those observed <strong>in</strong> <strong>the</strong> 1990s (0.5 migration scenario).<br />
Source: Office <strong>of</strong> <strong>the</strong> State Demographer.<br />
12
Geographic Distribution <strong>of</strong> Projected <strong>Need</strong> for <strong>Adult</strong> Education <strong>in</strong> Texas<br />
The Office <strong>of</strong> <strong>the</strong> State Demographer determ<strong>in</strong>ed <strong>the</strong> geographic distribution <strong>of</strong> <strong>the</strong> projected need for<br />
adult education throughout Texas by calculat<strong>in</strong>g <strong>the</strong> projected numbers <strong>of</strong> <strong>in</strong>dividuals over <strong>the</strong> age <strong>of</strong> 16<br />
who qualify for adult education <strong>in</strong> each <strong>of</strong> <strong>the</strong> 28 local workforce development areas us<strong>in</strong>g projections<br />
developed by <strong>the</strong> State Data Center. North Central, Rural Capitol, Tarrant, Dallas, <strong>and</strong> South Texas are<br />
projected to have over 100% <strong>in</strong>creases <strong>in</strong> <strong>the</strong> numbers <strong>of</strong> <strong>in</strong>dividuals need<strong>in</strong>g adult education services<br />
between 2010 <strong>and</strong> 2040.<br />
Projection Methodology by LWDA Summary<br />
The numbers were calculated for each LWDA by <strong>the</strong> Office <strong>of</strong> <strong>the</strong> State Demographer us<strong>in</strong>g <strong>the</strong><br />
projection methodology detailed <strong>in</strong> Appendix B. In short, <strong>the</strong> projections assumed rates <strong>of</strong> net<br />
migration that are half <strong>of</strong> those observed <strong>in</strong> <strong>the</strong> 1990s (<strong>the</strong> 0.5 migration scenario), <strong>the</strong>n a portion <strong>of</strong> <strong>the</strong><br />
total foreign-born population was allocated to each work force region based on <strong>the</strong> region’s projected<br />
growth, <strong>and</strong> f<strong>in</strong>ally <strong>the</strong> percentages <strong>of</strong> <strong>the</strong> population need<strong>in</strong>g adult education were calculated for each<br />
LWDA by apply<strong>in</strong>g statewide rates from <strong>the</strong> 2006-2008 American Community Survey.<br />
Summary <strong>of</strong> <strong>the</strong> Geographic Distribution <strong>of</strong> Projected <strong>Need</strong> for <strong>Adult</strong> Education <strong>in</strong><br />
Texas<br />
Appendix C presents <strong>the</strong> projected numbers <strong>of</strong> <strong>in</strong>dividuals over <strong>the</strong> age <strong>of</strong> 16 eligible for adult education<br />
services <strong>in</strong> each LWDA by educational atta<strong>in</strong>ment level. Table 6 summarizes <strong>the</strong> total projected<br />
numbers <strong>of</strong> <strong>in</strong>dividuals eligible for adult education services <strong>in</strong> each LWDA. Projections <strong>in</strong>dicate that<br />
Texas will experience an 88.8% <strong>in</strong>crease <strong>in</strong> <strong>the</strong> numbers <strong>of</strong> <strong>in</strong>dividuals qualify<strong>in</strong>g for adult education<br />
between 2010 <strong>and</strong> 2040. North Central, Rural Capitol, Tarrant, Dallas, <strong>and</strong> South Texas are projected to<br />
have over 100% <strong>in</strong>creases <strong>in</strong> <strong>the</strong> numbers <strong>of</strong> <strong>in</strong>dividuals need<strong>in</strong>g adult education services. The largest<br />
projected <strong>in</strong>crease <strong>in</strong> any category is <strong>the</strong> 188.9% growth rate for non-English fluent <strong>in</strong>dividuals with less<br />
than a high school education <strong>in</strong> North Central.<br />
13
Region<br />
Table 6: Projected Growth <strong>of</strong> Individuals <strong>Need</strong><strong>in</strong>g <strong>Adult</strong> Education by LWDA (2040)<br />
Less than<br />
HS,<br />
English<br />
Fluent<br />
Growth<br />
Rate<br />
from<br />
2010<br />
Less than<br />
HS, Not<br />
English<br />
Fluent<br />
Growth<br />
Rate<br />
from<br />
2010<br />
HS <strong>and</strong><br />
above,<br />
Not<br />
English<br />
Fluent<br />
Growth<br />
Rate<br />
from<br />
2010 Total<br />
Growth<br />
Rate<br />
from<br />
2010<br />
1. Panh<strong>and</strong>le 66,363 61.8% 22,486 71.6% 7,202 35.5% 96,051 61.6%<br />
2. South Pla<strong>in</strong>s 60,892 44.7% 16,114 58.6% 5,044 27.8% 82,050 46.0%<br />
3. North Texas 27,345 33.7% 7,867 67.7% 2,644 37.4% 37,857 39.8%<br />
4. North Central 415,397 153.1% 238,679 188.9% 79,455 127.9% 733,531 160.5%<br />
5. Tarrant County 299,933 104.4% 173,307 127.7% 55,838 79.5% 529,078 108.3%<br />
6. Dallas 514,504 104.9% 381,961 113.6% 120,534 69.0% 1,016,999 102.9%<br />
7. North East 32,226 27.5% 7,891 50.0% 2,658 15.9% 42,775 30.3%<br />
8. East Texas 114,890 56.4% 32,916 98.1% 12,311 66.6% 160,117 64.3%<br />
9. West Central 41,784 30.3% 9,156 46.3% 2,991 17.1% 53,931 31.9%<br />
10. Upper Rio Gr<strong>and</strong>e 171,634 70.5% 128,258 50.9% 36,581 27.4% 336,473 56.9%<br />
11. Permian Bas<strong>in</strong> 63,019 48.3% 28,426 53.7% 8,446 24.3% 99,891 47.4%<br />
12. Concho Valley 22,574 36.0% 7,776 47.2% 2,276 18.4% 32,626 37.1%<br />
13. Heart <strong>of</strong> Texas 52,963 60.6% 15,291 73.4% 5,429 45.9% 73,682 61.9%<br />
14. Capital Area 191,744 109.9% 98,601 98.2% 31,387 53.5% 321,733 99.2%<br />
15. Rural Capitol 162,808 166.5% 62,003 156.4% 21,360 115.0% 246,171 158.5%<br />
16. Brazos Valley 42,110 58.2% 16,197 66.6% 5,659 37.6% 63,966 58.1%<br />
17. Deep East Texas 52,364 46.3% 11,543 72.2% 4,200 43.4% 68,107 50.0%<br />
18. South East Texas 55,094 44.5% 15,562 100.8% 5,257 59.4% 75,913 54.4%<br />
19. Golden Crescent 31,791 45.6% 8,001 49.9% 2,478 25.0% 42,271 45.0%<br />
20. Alamo 380,466 60.6% 142,592 52.8% 41,775 24.3% 564,833 55.2%<br />
21. South Texas 77,893 131.4% 50,930 79.2% 15,611 57.4% 144,433 100.6%<br />
22. Coastal Bend 119,094 54.4% 33,045 55.3% 9,618 32.3% 161,756 53.1%<br />
23. Lower Rio Gr<strong>and</strong>e 220,701 120.3% 163,143 81.6% 48,035 51.8% 431,878 94.8%<br />
24. Cameron County 93,634 88.8% 66,237 63.3% 19,107 38.9% 178,978 72.2%<br />
25. Texoma 23,150 45.7% 5,993 75.0% 2,253 45.6% 31,395 50.5%<br />
26. Central Texas 74,878 94.9% 19,024 117.6% 6,658 74.8% 100,561 97.3%<br />
27. Middle Rio Gr<strong>and</strong>e 34,055 53.9% 22,077 46.9% 5,956 27.7% 62,088 48.5%<br />
28. Gulf Coast 1,096,776 99.9% 785,711 101.4% 248,270 62.5% 2,130,757 95.2%<br />
State Totals 4,540,080 90.2% 2,570,786 96.9% 809,034 60.7% 7,919,901 88.8%<br />
Table Notes: Projections assume rates <strong>of</strong> net migration that are half <strong>of</strong> those observed <strong>in</strong> <strong>the</strong> 1990s (0.5 migration scenario).<br />
Source: Office <strong>of</strong> <strong>the</strong> State Demographer.<br />
14
Next Steps<br />
This report is <strong>the</strong> first companion paper to A Primer on <strong>Adult</strong> Education <strong>in</strong> Texas. The Council worked<br />
with <strong>the</strong> Office <strong>of</strong> <strong>the</strong> State Demographer to conduct fur<strong>the</strong>r analyses <strong>of</strong> <strong>the</strong> current population <strong>in</strong> need<br />
<strong>of</strong> adult education services, a more detailed estimate <strong>of</strong> <strong>the</strong> future need for services based on<br />
projections for <strong>the</strong> Texas population, <strong>and</strong> <strong>the</strong> geographic dispersion <strong>of</strong> need <strong>in</strong> Texas by LWDA. This<br />
report <strong>of</strong>fers a more comprehensive <strong>and</strong> authoritative determ<strong>in</strong>ation <strong>of</strong> <strong>the</strong> current <strong>and</strong> future<br />
populations <strong>in</strong> need <strong>of</strong> adult education services. Additionally, this research can assist policy makers <strong>and</strong><br />
program adm<strong>in</strong>istrators to develop or modify policy <strong>and</strong> service delivery strategies.<br />
Throughout 2010, <strong>the</strong> Council will conduct additional research on adult education topics to <strong>in</strong>form its<br />
policy discussions <strong>and</strong> recommendations. The topics identified for fur<strong>the</strong>r research <strong>in</strong>clude a more<br />
detailed review <strong>of</strong> service delivery models, <strong>in</strong>teragency coord<strong>in</strong>ation, <strong>and</strong> adult education program<br />
outcomes. Recommendations for policy <strong>and</strong> program adm<strong>in</strong>istration will be <strong>of</strong>fered <strong>in</strong> <strong>the</strong>se future<br />
companion publications. This additional research will cont<strong>in</strong>ue <strong>in</strong> 2010 <strong>and</strong> will be published <strong>in</strong><br />
conjunction with <strong>the</strong> Council’s quarterly meet<strong>in</strong>gs.<br />
15
References<br />
Holzer, H. & Lerman, R. (2007). America’s forgotten middle-skill jobs: Education <strong>and</strong> tra<strong>in</strong><strong>in</strong>g<br />
requirements <strong>in</strong> <strong>the</strong> next decade <strong>and</strong> beyond. Retrieved October 2, 2009 from<br />
http://www.skills2compete.org/atf/cf/%7B8E9806BF-4669-4217-AF74-<br />
26F62108EA68%7D/ForgottenJobsReport%20F<strong>in</strong>al.pdf<br />
Murdock, S., White, S., Hoque, M., Pecotte, B., You, X., & Balkan, J. (2002). The new Texas challenge:<br />
<strong>Population</strong> change <strong>and</strong> <strong>the</strong> future <strong>of</strong> Texas, 2003. Retrieved February 3, 2010 from<br />
http://txsdc.utsa.edu/pubsrep/pubs/txchal.php<br />
National Commission on <strong>Adult</strong> Literacy. (2008). Reach higher, America: Overcom<strong>in</strong>g crisis <strong>in</strong> <strong>the</strong> U.S.<br />
Workforce. Retrieved October 2, 2009 from<br />
http://www.nationalcommissiononadultliteracy.org/ReachHigherAmerica/ReachHigher.pdf<br />
Texas State Data Center. (2009). Projections <strong>of</strong> <strong>the</strong> population <strong>of</strong> Texas <strong>and</strong> counties <strong>in</strong> Texas by age,<br />
sex <strong>and</strong> race/ethnicity for 2000-2040. Retrieved February 3, 2010 from<br />
http://txsdc.utsa.edu/tpepp/2008projections/2008_Texas_County_Projection_Methodology.pdf<br />
Texas Workforce Investment Council. (2003). A first look at critical issues surround<strong>in</strong>g adult education<br />
<strong>and</strong> literacy <strong>in</strong> Texas. Retrieved September 10, 2009 from<br />
http://governor.state.tx.us/files/twic/reports/adultliteracy.pdf<br />
Texas Workforce Investment Council. (2010). A primer on adult education <strong>in</strong> Texas. Retrieved February<br />
12, 2010 from<br />
http://governor.state.tx.us/files/twic/A_Primer_on_<strong>Adult</strong>_Education_<strong>in</strong>_Texas.pdf<br />
U.S. Department <strong>of</strong> Labor. (2001). The ag<strong>in</strong>g baby boomers In a new workforce development system.<br />
Retrieved October 2, 2009 from http://www.doleta.gov/Seniors/o<strong>the</strong>r_docs/Ag<strong>in</strong>gBoomers.pdf<br />
U.S. Census Bureau. (2001). Meet<strong>in</strong>g 21st century demographic needs -Implement<strong>in</strong>g <strong>the</strong> American<br />
Community Survey, Report 1: Demonstrat<strong>in</strong>g operational feasibility. Retrieved November 1,<br />
2009 from http://www.census.gov/acs/www/Downloads/Report01.pdf<br />
U.S. Census Bureau. (2009a). American Community Survey (ACS): Us<strong>in</strong>g multiyear estimates. Retrieved<br />
February 3, 2010 from http://www.census.gov/acs/www/UseData/myeoverview.html<br />
U.S. Census Bureau. (2009b). National population projections (2009 supplemental). Retrieved February<br />
3, 2010 from http://www.census.gov/population/www/projections/2009projections.html<br />
U.S. Census Bureau. (2009c). <strong>Population</strong> estimates. Retrieved February 3, 2010 from<br />
http://www.census.gov/popest/states/states.html<br />
U.S. Census Bureau. (2009d). American Community Survey (ACS): Public use microdata sample (PUMS)<br />
files. Retrieved February 3, 2010 from<br />
http://www.census.gov/acs/www/Products/PUMS/<strong>in</strong>dex.html<br />
16
Appendix A: <strong>Current</strong> <strong>Need</strong> for <strong>Adult</strong> Education by LWDA<br />
This appendix presents <strong>the</strong> numbers <strong>of</strong> <strong>in</strong>dividuals over <strong>the</strong> age <strong>of</strong> 16 who qualify for adult education by<br />
each LWDA. The numbers were calculated by <strong>the</strong> Office <strong>of</strong> <strong>the</strong> State Demographer us<strong>in</strong>g <strong>the</strong> American<br />
Community Survey 2006-2008 three year estimates. The three year estimates describe <strong>the</strong> average<br />
social, economic, <strong>and</strong> demographic characteristics for <strong>the</strong> three year time period between 2006 <strong>and</strong><br />
2008. Individuals are considered not English fluent if <strong>the</strong>y report speak<strong>in</strong>g English “not well” or “not at<br />
all.” Percentages represent <strong>in</strong>dividuals <strong>in</strong> each column. The asterisks <strong>in</strong> each table are used as<br />
placeholders s<strong>in</strong>ce English fluent <strong>in</strong>dividuals who have at least graduated high school do not qualify for<br />
adult education.<br />
LWDA 1: Panh<strong>and</strong>le<br />
Counties Served: Armstrong, Briscoe, Carson, Castro, Childress, Coll<strong>in</strong>gsworth, Dallam, Deaf Smith,<br />
Donley, Gray, Hall, Hansford, Hartley, Hemphill, Hutch<strong>in</strong>son, Lipscomb, Moore, Ochilltree, Oldham,<br />
Parmer, Potter, R<strong>and</strong>all, Roberts, Sherman, Swisher, Wheeler.<br />
Table 7: LWDA 1 Panh<strong>and</strong>le- Individuals Eligible for <strong>Adult</strong> Education Services (2006-2008)<br />
Not English Fluent, Not English Fluent,<br />
Educational English Fluent Native Born Foreign Born Total<br />
Atta<strong>in</strong>ment Number Percent Number Percent Number Percent Number Percent<br />
0 to 4th Grade 4,541 9.59% 668 36.36% 3,352 20.83% 8,562 13.12%<br />
5th to 8th<br />
Grade<br />
10,941 23.11% 446 24.28% 6,395 39.74% 17,782 27.24%<br />
9th to 12th<br />
Grade (no<br />
diploma)<br />
31,856 67.30% 183 9.96% 3,211 19.95% 35,251 54.01%<br />
High School<br />
Graduate<br />
* * 357 19.43% 2,084 12.95% 2,441 3.74%<br />
GED * * 78 4.25% 306 1.90% 384 0.59%<br />
Some College<br />
to 2-yr Degree<br />
* * 101 5.50% 347 2.16% 448 0.69%<br />
Bachelors<br />
Degree <strong>and</strong><br />
Higher<br />
* * 4 0.22% 397 2.47% 401 0.61%<br />
Total 47,338 100.00% 1,837 100.00% 16,093 100.00% 65,269 100.00%<br />
17
LWDA 2: South Pla<strong>in</strong>s<br />
Counties Served: Bailey, Cochran, Crosby, Dickens, Floyd, Hale, Hockley, K<strong>in</strong>g, Lamb, Lynn, Motley, Terry,<br />
Yoakum, Garza, Lubbock.<br />
Table 8: LWDA 2 South Pla<strong>in</strong>s- Individuals Eligible for <strong>Adult</strong> Education Services (2006-2008)<br />
Not English Fluent, Not English Fluent,<br />
Educational English Fluent Native Born Foreign Born Total<br />
Atta<strong>in</strong>ment Number Percent Number Percent Number Percent Number Percent<br />
0 to 4th Grade 5,230 11.74% 1,932 48.43% 1,827 25.79% 8,989 16.16%<br />
5th to 8th<br />
Grade<br />
11,484 25.77% 1,058 26.52% 3,094 43.68% 15,635 28.10%<br />
9th to 12th<br />
Grade (no<br />
diploma)<br />
27,856 62.50% 260 6.52% 1,023 14.44% 29,139 52.37%<br />
High School<br />
Graduate<br />
* * 320 8.01% 530 7.49% 850 1.53%<br />
GED * * 39 0.99% 258 3.65% 298 0.54%<br />
Some College<br />
to 2-yr Degree<br />
* * 311 7.80% 125 1.76% 436 0.78%<br />
Bachelors<br />
Degree <strong>and</strong><br />
Higher<br />
* * 69 1.73% 226 3.19% 295 0.53%<br />
Total 44,570 100.00% 3,989 100.00% 7,083 100.00% 55,642 100.00%<br />
18
LWDA 3: North Texas<br />
Counties Served: Archer, Baylor, Clay, Cottle, Foard, Hardeman, Jack, Montague, Wichita, Wilbarger,<br />
Young.<br />
Table 9: LWDA 3 North Texas- Individuals Eligible for <strong>Adult</strong> Education Services (2006-2008)<br />
Not English Fluent, Not English Fluent,<br />
Educational English Fluent Native Born Foreign Born Total<br />
Atta<strong>in</strong>ment Number Percent Number Percent Number Percent Number Percent<br />
0 to 4th<br />
Grade<br />
1,596 6.48% 178 32.79% 813 22.71% 2,586 8.99%<br />
5th to 8th<br />
Grade<br />
5,337 21.66% 49 9.10% 1,359 37.98% 6,746 23.46%<br />
9th to 12th<br />
Grade (no<br />
diploma)<br />
17,703 71.86% 46 8.49% 615 17.17% 18,363 63.86%<br />
High School<br />
Graduate<br />
* * 75 13.78% 542 15.13% 616 2.14%<br />
GED * * 60 11.12% 22 0.61% 82 0.29%<br />
Some College<br />
to 2-yr<br />
Degree<br />
* * 110 20.25% 193 5.39% 303 1.05%<br />
Bachelors<br />
Degree <strong>and</strong><br />
Higher<br />
* * 24 4.46% 36 1.01% 60 0.21%<br />
Total 24,636 100.00% 542 100.00% 3,579 100.00% 28,757 100.00%<br />
19
LWDA 4: North Central<br />
Counties Served: Coll<strong>in</strong>, Denton, Ellis, Erath, Hood, Hunt, Johnson, Kaufman, Navarro, Palo P<strong>in</strong>to, Parker,<br />
Rockwall, Somervell, Wise.<br />
Table 10: LWDA 4 North Central- Individuals Eligible for <strong>Adult</strong> Education Services (2006-2008)<br />
Not English Fluent, Not English Fluent,<br />
Educational English Fluent Native Born Foreign Born Total<br />
Atta<strong>in</strong>ment Number Percent Number Percent Number Percent Number Percent<br />
0 to 4th Grade 13,097 9.00% 831 19.67% 8,895 11.77% 22,822 10.13%<br />
5th to 8th<br />
Grade<br />
31,375 21.57% 559 13.24% 24,710 32.70% 56,645 25.14%<br />
9th to 12th<br />
Grade (no<br />
diploma)<br />
101,015 69.43% 505 11.96% 16,440 21.75% 117,960 52.36%<br />
High School<br />
Graduate<br />
* * 499 11.83% 13,893 18.38% 14,392 6.39%<br />
GED * * 115 2.72% 1,123 1.49% 1,237 0.55%<br />
Some College<br />
to 2-yr Degree<br />
* * 933 22.09% 5,412 7.16% 6,344 2.82%<br />
Bachelors<br />
Degree <strong>and</strong><br />
Higher<br />
* * 781 18.49% 5,098 6.75% 5,879 2.61%<br />
Total 145,488 100.00% 4,223 100.00% 75,570 100.00% 225,281 100.00%<br />
20
Counties Served: Tarrant.<br />
LWDA 5: Tarrant County<br />
Table 11: LWDA 5 Tarrant County- Individuals Eligible for <strong>Adult</strong> Education Services (2006-2008)<br />
Not English Fluent, Not English Fluent,<br />
Educational English Fluent Native Born Foreign Born Total<br />
Atta<strong>in</strong>ment Number Percent Number Percent Number Percent Number Percent<br />
0 to 4th<br />
Grade<br />
10,604 7.92% 927 16.79% 15,159 15.99% 26,690 11.40%<br />
5th to 8th<br />
Grade<br />
27,550 20.58% 905 16.40% 29,105 30.70% 57,560 24.58%<br />
9th to 12th<br />
Grade (no<br />
diploma)<br />
95,737 71.50% 645 11.68% 19,416 20.48% 115,798 49.44%<br />
High School<br />
Graduate<br />
* * 1,213 21.98% 20,692 21.83% 21,905 9.35%<br />
GED * * 79 1.44% 2,078 2.19% 2,157 0.92%<br />
Some College<br />
to 2-yr<br />
Degree<br />
* * 948 17.17% 5,404 5.70% 6,352 2.71%<br />
Bachelors<br />
Degree <strong>and</strong><br />
Higher<br />
* * 803 14.54% 2,947 3.11% 3,750 1.60%<br />
Total 133,891 100.00% 5,520 100.00% 94,801 100.00% 234,211 100.00%<br />
21
Counties Served: Dallas.<br />
LWDA 6: Dallas<br />
Table 12: LWDA 6 Dallas- Individuals Eligible for <strong>Adult</strong> Education Services (2006-2008)<br />
Not English Fluent, Not English Fluent,<br />
Educational English Fluent Native Born Foreign Born Total<br />
Atta<strong>in</strong>ment Number Percent Number Percent Number Percent Number Percent<br />
0 to 4th Grade 21,166 9.55% 1,675 17.52% 44,682 17.81% 67,523 14.00%<br />
5th to 8th<br />
Grade<br />
50,737 22.88% 2,691 28.15% 85,864 34.22% 139,292 28.89%<br />
9th to 12th<br />
Grade (no<br />
diploma)<br />
149,805 67.57% 1,687 17.64% 64,249 25.60% 215,741 44.74%<br />
High School<br />
Graduate<br />
* * 893 9.33% 35,759 14.25% 36,652 7.60%<br />
GED * * 638 6.67% 3,679 1.47% 4,316 0.90%<br />
Some College<br />
to 2-yr Degree<br />
* * 910 9.52% 9,680 3.86% 10,590 2.20%<br />
Bachelors<br />
Degree <strong>and</strong><br />
Higher<br />
* * 1,068 11.17% 7,035 2.80% 8,103 1.68%<br />
Total 221,708 100.00% 9,561 100.00% 250,948 100.00% 482,217 100.00%<br />
22
LWDA 7: North East<br />
Counties Served: Bowie, Cass, Delta, Frankl<strong>in</strong>, Hopk<strong>in</strong>s, Lamar, Morris, Red River, Titus.<br />
Table 13: LWDA 7 North East- Individuals Eligible for <strong>Adult</strong> Education Services (2006-2008)<br />
Not English Fluent, Not English Fluent,<br />
Educational English Fluent Native Born Foreign Born Total<br />
Atta<strong>in</strong>ment Number Percent Number Percent Number Percent Number Percent<br />
0 to 4th Grade 2,119 6.17% 78 19.07% 1,767 22.74% 3,964 9.32%<br />
5th to 8th<br />
Grade<br />
8,308 24.18% 84 20.54% 2,055 26.44% 10,447 24.56%<br />
9th to 12th<br />
Grade (no<br />
diploma)<br />
23,925 69.65% 17 4.16% 1,677 21.58% 25,619 60.23%<br />
High School<br />
Graduate<br />
* * 91 22.25% 1,182 15.21% 1,273 2.99%<br />
GED * * 0 0.00% 313 4.03% 313 0.74%<br />
Some College<br />
to 2-yr Degree<br />
* * 139 33.99% 595 7.66% 734 1.73%<br />
Bachelors<br />
Degree <strong>and</strong><br />
Higher<br />
* * 0 0.00% 183 2.35% 183 0.43%<br />
Total 34,352 100.00% 409 100.00% 7,773 100.00% 42,534 100.00%<br />
23
LWDA 8: East Texas<br />
Counties Served: Anderson, Camp, Cherokee, Gregg, Harrison, Henderson, Marion, Panola, Ra<strong>in</strong>s, Rusk,<br />
Smith, Upshur, Van Z<strong>and</strong>t, Wood.<br />
Table 14: LWDA 8 East Texas- Individuals Eligible for <strong>Adult</strong> Education Services (2006-2008)<br />
Not English Fluent, Not English Fluent,<br />
Educational English Fluent Native Born Foreign Born Total<br />
Atta<strong>in</strong>ment Number Percent Number Percent Number Percent Number Percent<br />
0 to 4th Grade 6,501 6.93% 367 24.29% 4,431 21.35% 11,299 9.74%<br />
5th to 8th<br />
Grade<br />
20,791 22.17% 244 16.15% 7,149 34.44% 28,184 24.29%<br />
9th to 12th<br />
Grade (no<br />
diploma)<br />
66,469 70.89% 198 13.10% 4,156 20.02% 70,823 61.04%<br />
High School<br />
Graduate<br />
* * 299 19.76% 4,028 19.41% 4,327 3.73%<br />
GED * * 14 0.96% 89 0.43% 103 0.09%<br />
Some College<br />
to 2-yr Degree<br />
* * 258 17.07% 366 1.76% 624 0.54%<br />
Bachelors<br />
Degree <strong>and</strong><br />
Higher<br />
* * 131 8.67% 539 2.60% 670 0.58%<br />
Total 93,761 100.00% 1,511 100.00% 20,758 100.00% 116,030 100.00%<br />
24
LWDA 9: West Central<br />
Counties Served: Brown, Callahan, Coleman, Comanche, Eastl<strong>and</strong>, Fisher, Haskell, Jones, Kent, Knox,<br />
Mitchell, Nolan, Runnels, Scurry, Shackelford, Stephens, Stonewall, Taylor, Throckmorton.<br />
Table 15: LWDA 9 West Central- Individuals Eligible for <strong>Adult</strong> Education Services (2006-2008)<br />
Not English Fluent, Not English Fluent,<br />
Educational English Fluent Native Born Foreign Born Total<br />
Atta<strong>in</strong>ment Number Percent Number Percent Number Percent Number Percent<br />
0 to 4th Grade 3,770 9.66% 695 45.55% 1,775 35.86% 6,240 13.72%<br />
5th to 8th<br />
Grade<br />
9,134 23.41% 266 17.40% 1,596 32.24% 10,995 24.17%<br />
9th to 12th<br />
Grade (no<br />
diploma)<br />
26,113 66.93% 185 12.11% 874 17.66% 27,172 59.73%<br />
High School<br />
Graduate<br />
* * 90 5.91% 508 10.26% 598 1.31%<br />
GED * * 27 1.78% 32 0.64% 59 0.13%<br />
Some College<br />
to 2-yr Degree<br />
* * 137 9.00% 79 1.59% 216 0.48%<br />
Bachelors<br />
Degree <strong>and</strong><br />
Higher<br />
* * 126 8.24% 86 1.74% 212 0.47%<br />
Total 39,017 100.00% 1,526 100.00% 4,949 100.00% 45,492 100.00%<br />
25
LWDA 10: Upper Rio Gr<strong>and</strong>e<br />
Counties Served: Brewster, Culberson, El Paso, Hudspeth, Jeff Davis, Presidio.<br />
Table 16: LWDA 10 Upper Rio Gr<strong>and</strong>e- Individuals Eligible for <strong>Adult</strong> Education Services (2006-2008)<br />
Not English Fluent, Not English Fluent,<br />
Educational English Fluent Native Born Foreign Born Total<br />
Atta<strong>in</strong>ment Number Percent Number Percent Number Percent Number Percent<br />
0 to 4th Grade 7,081 11.33% 3,110 23.32% 18,610 20.83% 28,801 17.44%<br />
5th to 8th<br />
Grade<br />
16,016 25.62% 3,240 24.30% 32,799 36.71% 52,055 31.51%<br />
9th to 12th<br />
Grade (no<br />
diploma)<br />
39,404 63.05% 1,949 14.62% 14,281 15.99% 55,635 33.68%<br />
High School<br />
Graduate<br />
* * 1,878 14.08% 10,392 11.63% 12,270 7.43%<br />
GED * * 1,064 7.98% 4,766 5.33% 5,830 3.53%<br />
Some College<br />
to 2-yr Degree<br />
* * 1,398 10.48% 5,387 6.03% 6,784 4.11%<br />
Bachelors<br />
Degree <strong>and</strong><br />
Higher<br />
* * 696 5.22% 3,107 3.48% 3,803 2.30%<br />
Total 62,501 100.00% 13,335 100.00% 89,343 100.00% 165,179 100.00%<br />
26
LWDA 11: Permian Bas<strong>in</strong><br />
Counties Served: Andrews, Borden, Crane, Dawson, Ector, Ga<strong>in</strong>es, Glasscock, Howard, Lov<strong>in</strong>g, Mart<strong>in</strong>,<br />
Midl<strong>and</strong>, Pecos, Reeves, Terrell, Upton, Ward, W<strong>in</strong>kler.<br />
Table 17: LWDA 11 Permian Bas<strong>in</strong>- Individuals Eligible for <strong>Adult</strong> Education Services (2006-2008)<br />
Not English Fluent, Not English Fluent,<br />
Educational English Fluent Native Born Foreign Born Total<br />
Atta<strong>in</strong>ment Number Percent Number Percent Number Percent Number Percent<br />
0 to 4th Grade 4,461 8.76% 1,652 40.73% 5,766 27.35% 11,879 15.62%<br />
5th to 8th<br />
Grade<br />
13,736 26.98% 1,085 26.75% 8,204 38.92% 23,025 30.28%<br />
9th to 12th<br />
Grade (no<br />
diploma)<br />
32,711 64.25% 486 11.98% 3,883 18.42% 37,080 48.76%<br />
High School<br />
Graduate<br />
* * 348 8.58% 1,917 9.09% 2,265 2.98%<br />
GED * * 84 2.08% 352 1.67% 437 0.57%<br />
Some College<br />
to 2-yr Degree<br />
* * 267 6.58% 748 3.55% 1,015 1.33%<br />
Bachelors<br />
Degree <strong>and</strong><br />
Higher<br />
* * 134 3.30% 210 1.00% 344 0.45%<br />
Total 50,908 100.00% 4,057 100.00% 21,080 100.00% 76,044 100.00%<br />
27
LWDA 12: Concho Valley<br />
Counties Served: Coke, Concho, Crockett, Irion, Kimble, Mason, McCulloch, Menard, Reagan, Schleicher,<br />
Sterl<strong>in</strong>g, Sutton, Tom Green.<br />
Table 18: LWDA 12 Concho Valley- Individuals Eligible for <strong>Adult</strong> Education Services (2006-2008)<br />
Not English Fluent, Not English Fluent,<br />
Educational English Fluent Native Born Foreign Born Total<br />
Atta<strong>in</strong>ment Number Percent Number Percent Number Percent Number Percent<br />
0 to 4th Grade 2,076 11.31% 451 32.03% 1,121 26.37% 3,647 15.19%<br />
5th to 8th<br />
Grade<br />
4,660 25.38% 398 28.29% 1,454 34.23% 6,513 27.12%<br />
9th to 12th<br />
Grade (no<br />
diploma)<br />
11,625 63.31% 129 9.17% 943 22.20% 12,697 52.87%<br />
High School<br />
Graduate<br />
* * 82 5.86% 381 8.96% 463 1.93%<br />
GED * * 66 4.72% 203 4.78% 270 1.12%<br />
Some College<br />
to 2-yr Degree<br />
* * 224 15.94% 115 2.69% 339 1.41%<br />
Bachelors<br />
Degree <strong>and</strong><br />
Higher<br />
* * 56 3.99% 33 0.77% 89 0.37%<br />
Total 18,361 100.00% 1,407 100.00% 4,249 100.00% 24,018 100.00%<br />
28
LWDA 13: Heart <strong>of</strong> Texas<br />
Counties Served: Bosque, Falls, Freestone, Hill, Limestone, McLennan.<br />
Table 19: LWDA 13 Heart <strong>of</strong> Texas- Individuals Eligible for <strong>Adult</strong> Education Services (2006-2008)<br />
Not English Fluent, Not English Fluent,<br />
Educational English Fluent Native Born Foreign Born Total<br />
Atta<strong>in</strong>ment Number Percent Number Percent Number Percent Number Percent<br />
0 to 4th<br />
Grade<br />
3,434 8.83% 185 15.84% 2,800 23.62% 6,420 12.37%<br />
5th to 8th<br />
Grade<br />
9,762 25.11% 330 28.19% 4,629 39.04% 14,720 28.36%<br />
9th to 12th<br />
Grade (no<br />
diploma)<br />
25,678 66.05% 209 17.85% 2,792 23.55% 28,679 55.26%<br />
High School<br />
Graduate<br />
* * 95 8.09% 942 7.94% 1,036 2.00%<br />
GED * * 0 0.00% 32 0.27% 32 0.06%<br />
Some College<br />
to 2-yr<br />
Degree<br />
* * 217 18.58% 420 3.54% 637 1.23%<br />
Bachelors<br />
Degree <strong>and</strong><br />
Higher<br />
* * 134 11.46% 242 2.04% 376 0.72%<br />
Total 38,874 100.00% 1,170 100.00% 11,856 100.00% 51,900 100.00%<br />
29
Counties Served: Travis.<br />
LWDA 14: Capital Area<br />
Table 20: LWDA 14 Capital Area- Individuals Eligible for <strong>Adult</strong> Education Services (2006-2008)<br />
Not English Fluent, Not English Fluent,<br />
Educational English Fluent Native Born Foreign Born Total<br />
Atta<strong>in</strong>ment Number Percent Number Percent Number Percent Number Percent<br />
0 to 4th<br />
Grade<br />
7,191 12.66% 905 19.72% 10,526 17.24% 18,622 15.21%<br />
5th to 8th<br />
Grade<br />
14,009 24.67% 972 21.18% 19,915 32.62% 34,896 28.50%<br />
9th to 12th<br />
Grade (no<br />
diploma)<br />
35,595 62.67% 572 12.47% 11,483 18.81% 47,650 38.92%<br />
High School<br />
Graduate<br />
* * 590 12.85% 12,224 20.02% 12,813 10.47%<br />
GED * * 376 8.19% 831 1.36% 1,207 0.99%<br />
Some College<br />
to 2-yr<br />
Degree<br />
* * 349 7.60% 3,611 5.92% 3,960 3.23%<br />
Bachelors<br />
Degree <strong>and</strong><br />
Higher<br />
* * 825 17.99% 2,455 4.02% 3,280 2.68%<br />
Total 56,794 100.00% 4,588 100.00% 61,045 100.00% 122,428 100.00%<br />
30
LWDA 15: Rural Capital<br />
Counties Served: Bastrop, Blanco, Burnet, Caldwell, Fayette, Hays, Lee, Llano, Williamson.<br />
Table 21: LWDA 15 Rural Capital- Individuals Eligible for <strong>Adult</strong> Education Services (2006-2008)<br />
Not English Fluent, Not English Fluent,<br />
Educational English Fluent Native Born Foreign Born Total<br />
Atta<strong>in</strong>ment Number Percent Number Percent Number Percent Number Percent<br />
0 to 4th Grade 5,407 9.81% 1,155 32.79% 4,599 18.00% 11,162 13.26%<br />
5th to 8th<br />
Grade<br />
15,294 27.76% 824 23.39% 7,810 30.57% 23,928 28.43%<br />
9th to 12th<br />
Grade (no<br />
diploma)<br />
34,400 62.43% 282 7.99% 4,671 18.28% 39,352 46.75%<br />
High School<br />
Graduate<br />
* * 572 16.23% 5,236 20.50% 5,808 6.90%<br />
GED * * 70 1.99% 916 3.58% 986 1.17%<br />
Some College<br />
to 2-yr Degree<br />
* * 246 6.98% 1,230 4.82% 1,476 1.75%<br />
Bachelors<br />
Degree <strong>and</strong><br />
Higher<br />
* * 374 10.63% 1,085 4.25% 1,459 1.73%<br />
Total 55,101 100.00% 3,523 100.00% 25,546 100.00% 84,170 100.00%<br />
31
LWDA 16: Brazos Valley<br />
Counties Served: Brazos, Burleson, Grimes, Leon, Madison, Robertson, Wash<strong>in</strong>gton.<br />
Table 22: LWDA 16 Brazos Valley- Individuals Eligible for <strong>Adult</strong> Education Services (2006-2008)<br />
Not English Fluent, Not English Fluent,<br />
Educational English Fluent Native Born Foreign Born Total<br />
Atta<strong>in</strong>ment Number Percent Number Percent Number Percent Number Percent<br />
0 to 4th<br />
Grade<br />
2,101 8.00% 125 26.01% 1,444 16.22% 3,670 10.30%<br />
5th to 8th<br />
Grade<br />
6,679 25.43% 175 36.40% 3,841 43.15% 10,695 30.00%<br />
9th to 12th<br />
Grade (no<br />
diploma)<br />
17,486 66.57% 17 3.57% 1,463 16.44% 18,967 53.20%<br />
High School<br />
Graduate<br />
* * 70 14.55% 1,373 15.43% 1,443 4.05%<br />
GED * * 0 0.00% 0 0.00% 0 0.00%<br />
Some College<br />
to 2-yr<br />
Degree<br />
* * 90 18.68% 570 6.40% 660 1.85%<br />
Bachelors<br />
Degree <strong>and</strong><br />
Higher<br />
* * 4 0.79% 210 2.36% 214 0.60%<br />
Total 26,267 100.00% 481 100.00% 8,901 100.00% 35,648 100.00%<br />
32
LWDA 17: Deep East Texas<br />
Counties Served: Angel<strong>in</strong>a, Houston, Jasper, Nacogdoches, Newton, Polk, Sab<strong>in</strong>e, San August<strong>in</strong>e, San<br />
Jac<strong>in</strong>to, Shelby, Tr<strong>in</strong>ity, Tyler.<br />
Table 23: LWDA 17 Deep East Texas- Individuals Eligible for <strong>Adult</strong> Education Services (2006-2008)<br />
Not English Fluent, Not English Fluent,<br />
Educational English Fluent Native Born Foreign Born Total<br />
Atta<strong>in</strong>ment Number Percent Number Percent Number Percent Number Percent<br />
0 to 4th Grade 3,204 6.48% 127 14.97% 1,930 19.49% 5,261 8.73%<br />
5th to 8th<br />
Grade<br />
11,976 24.20% 82 9.66% 3,740 37.77% 15,798 26.23%<br />
9th to 12th<br />
Grade (no<br />
diploma)<br />
34,303 69.32% 59 6.99% 1,573 15.89% 35,936 59.66%<br />
High School<br />
Graduate<br />
* * 50 5.90% 1,658 16.74% 1,708 2.84%<br />
GED * * 310 36.54% 0 0.00% 310 0.51%<br />
Some College<br />
to 2-yr Degree<br />
* * 58 6.84% 676 6.83% 734 1.22%<br />
Bachelors<br />
Degree <strong>and</strong><br />
Higher<br />
* * 162 19.10% 325 3.28% 487 0.81%<br />
Total 49,484 100.00% 848 100.00% 9,902 100.00% 60,234 100.00%<br />
33
Counties Served: Hard<strong>in</strong>, Jefferson, Orange.<br />
LWDA 18: South East Texas<br />
Table 24: LWDA 18 South East Texas- Individuals Eligible for <strong>Adult</strong> Education Services (2006-2008)<br />
Not English Fluent, Not English Fluent,<br />
Educational English Fluent Native Born Foreign Born Total<br />
Atta<strong>in</strong>ment Number Percent Number Percent Number Percent Number Percent<br />
0 to 4th<br />
Grade<br />
3,109 7.25% 38 9.57% 2,225 25.47% 5,372 10.33%<br />
5th to 8th<br />
Grade<br />
8,967 20.92% 33 8.31% 2,264 25.92% 11,264 21.67%<br />
9th to 12th<br />
Grade (no<br />
diploma)<br />
30,778 71.82% 21 5.29% 2,022 23.15% 32,821 63.13%<br />
High School<br />
Graduate<br />
* * 78 19.65% 1,626 18.61% 1,704 3.28%<br />
GED * * 0 0.00% 137 1.57% 137 0.26%<br />
Some College<br />
to 2-yr<br />
Degree<br />
* * 159 40.05% 313 3.58% 472 0.91%<br />
Bachelors<br />
Degree <strong>and</strong><br />
Higher<br />
* * 68 17.13% 148 1.69% 216 0.42%<br />
Total 42,854 100.00% 397 100.00% 8,735 100.00% 51,986 100.00%<br />
34
LWDA 19: Golden Crescent<br />
Counties Served: Calhoun, DeWitt, Goliad, Gonzales, Jackson, Lavaca, Victoria.<br />
Table 25: LWDA 19 Golden Crescent- Individuals Eligible for <strong>Adult</strong> Education Services (2006-2008)<br />
Not English Fluent, Not English Fluent,<br />
Educational English Fluent Native Born Foreign Born Total<br />
Atta<strong>in</strong>ment Number Percent Number Percent Number Percent Number Percent<br />
0 to 4th<br />
Grade<br />
2,818 11.06% 580 41.38% 1,720 35.67% 5,117 16.14%<br />
5th to 8th<br />
Grade<br />
6,690 26.26% 320 22.83% 1,384 28.71% 8,394 26.48%<br />
9th to 12th<br />
Grade (no<br />
diploma)<br />
15,971 62.68% 136 9.68% 674 13.98% 16,780 52.93%<br />
High School<br />
Graduate<br />
* * 171 12.22% 389 8.07% 560 1.77%<br />
GED * * 17 1.22% 294 6.09% 311 0.98%<br />
Some College<br />
to 2-yr<br />
Degree<br />
* * 123 8.78% 326 6.77% 449 1.42%<br />
Bachelors<br />
Degree <strong>and</strong><br />
Higher<br />
* * 54 3.88% 34 0.70% 88 0.28%<br />
Total 25,479 100.00% 1,400 100.00% 4,820 100.00% 31,700 100.00%<br />
35
LWDA 20: Alamo<br />
Counties Served: Atascosa, B<strong>and</strong>era, Bexar, Comal, Frio, Gillespie, Guadalupe, Karnes, Kendall, Kerr,<br />
Med<strong>in</strong>a, Wilson.<br />
Table 26: LWDA 20 Alamo- Individuals Eligible for <strong>Adult</strong> Education Services (2006-2008)<br />
Not English Fluent, Not English Fluent,<br />
Educational English Fluent Native Born Foreign Born Total<br />
Atta<strong>in</strong>ment Number Percent Number Percent Number Percent Number Percent<br />
0 to 4th Grade 22,111 10.72% 4,975 25.47% 15,728 20.61% 42,814 14.18%<br />
5th to 8th<br />
Grade<br />
52,738 25.58% 4,486 22.96% 22,472 29.45% 79,697 26.39%<br />
9th to 12th<br />
Grade (no<br />
diploma)<br />
131,321 63.70% 2,489 12.74% 13,503 17.69% 147,314 48.78%<br />
High School<br />
Graduate<br />
* * 2,973 15.22% 14,622 19.16% 17,595 5.83%<br />
GED * * 661 3.38% 3,021 3.96% 3,682 1.22%<br />
Some College<br />
to 2-yr Degree<br />
* * 2,585 13.23% 4,584 6.01% 7,169 2.37%<br />
Bachelors<br />
Degree <strong>and</strong><br />
Higher<br />
* * 1,366 6.99% 2,386 3.13% 3,752 1.24%<br />
Total 206,170 100.00% 19,536 100.00% 76,316 100.00% 302,022 100.00%<br />
36
Counties Served: Jim Hogg, Webb, Zapata.<br />
LWDA 21: South Texas<br />
Table 27: LWDA 21 South Texas- Individuals Eligible for <strong>Adult</strong> Education Services (2006-2008)<br />
Not English Fluent, Not English Fluent,<br />
Educational English Fluent Native Born Foreign Born Total<br />
Atta<strong>in</strong>ment Number Percent Number Percent Number Percent Number Percent<br />
0 to 4th<br />
Grade<br />
2,256 10.63% 2,859 28.52% 7,024 18.45% 12,138 17.51%<br />
5th to 8th<br />
Grade<br />
6,749 31.81% 2,145 21.40% 12,506 32.85% 21,399 30.87%<br />
9th to 12th<br />
Grade (no<br />
diploma)<br />
12,211 57.56% 1,766 17.62% 7,348 19.30% 21,326 30.77%<br />
High School<br />
Graduate<br />
* * 1,804 18.00% 5,174 13.59% 6,978 10.07%<br />
GED * * 262 2.62% 631 1.66% 893 1.29%<br />
Some College<br />
to 2-yr<br />
Degree<br />
* * 794 7.92% 3,282 8.62% 4,076 5.88%<br />
Bachelors<br />
Degree <strong>and</strong><br />
Higher<br />
* * 394 3.93% 2,108 5.54% 2,501 3.61%<br />
Total 21,215 100.00% 10,024 100.00% 38,072 100.00% 69,311 100.00%<br />
37
LWDA 22: Coastal Bend<br />
Counties Served: Aransas, Bee, Brooks, Duval, Jim Wells, Kenedy, Kleberg, Live Oak, McMullen, Nueces,<br />
Refugio, San Patricio.<br />
Table 28: LWDA 22 Coastal Bend- Individuals Eligible for <strong>Adult</strong> Education Services (2006-2008)<br />
Not English Fluent, Not English Fluent,<br />
Educational English Fluent Native Born Foreign Born Total<br />
Atta<strong>in</strong>ment Number Percent Number Percent Number Percent Number Percent<br />
0 to 4th Grade 7,228 9.58% 5,392 45.94% 4,002 25.62% 16,623 16.17%<br />
5th to 8th<br />
Grade<br />
20,703 27.45% 3,274 27.89% 6,077 38.89% 30,054 29.24%<br />
9th to 12th<br />
Grade (no<br />
diploma)<br />
47,500 62.97% 1,008 8.59% 1,989 12.73% 50,497 49.12%<br />
High School<br />
Graduate<br />
* * 830 7.07% 2,022 12.94% 2,853 2.78%<br />
GED * * 290 2.47% 295 1.89% 585 0.57%<br />
Some College<br />
to 2-yr Degree<br />
* * 689 5.87% 693 4.44% 1,382 1.34%<br />
Bachelors<br />
Degree <strong>and</strong><br />
Higher<br />
* * 253 2.16% 546 3.50% 799 0.78%<br />
Total 75,431 100.00% 11,737 100.00% 15,624 100.00% 102,793 100.00%<br />
38
Counties Served: Hidalgo, Starr, Willacy.<br />
LWDA 23: Lower Rio Gr<strong>and</strong>e Valley<br />
Table 29: LWDA 23 Lower Rio Gr<strong>and</strong>e Valley- Individuals Eligible for <strong>Adult</strong> Education Services (2006-<br />
2008)<br />
Not English Fluent, Not English Fluent,<br />
Educational English Fluent Native Born Foreign Born Total<br />
Atta<strong>in</strong>ment Number Percent Number Percent Number Percent Number Percent<br />
0 to 4th<br />
Grade<br />
10,448 13.00% 9,538 44.77% 28,572 24.09% 48,559 22.04%<br />
5th to 8th<br />
Grade<br />
24,422 30.38% 6,020 28.26% 43,526 36.69% 73,968 33.57%<br />
9th to 12th<br />
Grade (no<br />
diploma)<br />
45,521 56.62% 2,595 12.18% 19,031 16.04% 67,146 30.48%<br />
High School<br />
Graduate<br />
* * 1,317 6.18% 17,301 14.58% 18,617 8.45%<br />
GED * * 677 3.18% 608 0.51% 1,285 0.58%<br />
Some College<br />
to 2-yr<br />
Degree<br />
* * 804 3.77% 5,154 4.34% 5,958 2.70%<br />
Bachelors<br />
Degree <strong>and</strong><br />
Higher<br />
* * 353 1.66% 4,439 3.74% 4,792 2.18%<br />
Total 80,391 100.00% 21,304 100.00% 118,630 100.00% 220,325 100.00%<br />
39
Counties Served: Cameron.<br />
LWDA 24: Cameron County<br />
Table 30: LWDA 24 Cameron County- Individuals Eligible for <strong>Adult</strong> Education Services (2006-2008)<br />
Not English Fluent, Not English Fluent,<br />
Educational English Fluent Native Born Foreign Born Total<br />
Atta<strong>in</strong>ment Number Percent Number Percent Number Percent Number Percent<br />
0 to 4th<br />
Grade<br />
5,366 13.30% 3,747 38.94% 11,597 22.99% 20,710 20.62%<br />
5th to 8th<br />
Grade<br />
12,480 30.94% 3,042 31.62% 19,632 38.91% 35,154 35.01%<br />
9th to 12th<br />
Grade (no<br />
diploma)<br />
22,493 55.76% 1,158 12.03% 7,964 15.78% 31,615 31.48%<br />
High School<br />
Graduate<br />
* * 800 8.31% 5,098 10.10% 5,898 5.87%<br />
GED * * 0 0.00% 1,208 2.40% 1,208 1.20%<br />
Some College<br />
to 2-yr<br />
Degree<br />
* * 575 5.98% 2,988 5.92% 3,563 3.55%<br />
Bachelors<br />
Degree <strong>and</strong><br />
Higher<br />
* * 300 3.12% 1,967 3.90% 2,267 2.26%<br />
Total 40,339 100.00% 9,622 100.00% 50,454 100.00% 100,415 100.00%<br />
40
Counties Served: Cooke, Fann<strong>in</strong>, Grayson.<br />
LWDA 25: Texoma<br />
Table 31: LWDA 25 Texoma- Individuals Eligible for <strong>Adult</strong> Education Services (2006-2008)<br />
Not English Fluent, Not English Fluent,<br />
Educational English Fluent Native Born Foreign Born Total<br />
Atta<strong>in</strong>ment Number Percent Number Percent Number Percent Number Percent<br />
0 to 4th Grade 1,149 6.10% 50 15.75% 508 12.14% 1,708 7.32%<br />
5th to 8th<br />
Grade<br />
4,249 22.55% 155 48.65% 1,834 43.83% 6,239 26.72%<br />
9th to 12th<br />
Grade (no<br />
diploma)<br />
13,443 71.35% 27 8.45% 1,138 27.21% 14,608 62.57%<br />
High School<br />
Graduate<br />
* * 6 1.79% 531 12.68% 536 2.30%<br />
GED * * 0 0.00% 0 0.00% 0 0.00%<br />
Some College<br />
to 2-yr Degree<br />
* * 41 12.75% 134 3.19% 174 0.75%<br />
Bachelors<br />
Degree <strong>and</strong><br />
Higher<br />
* * 40 12.61% 39 0.94% 80 0.34%<br />
Total 18,841 100.00% 320 100.00% 4,184 100.00% 23,345 100.00%<br />
41
LWDA 26: Central Texas<br />
Counties Served: Bell, Coryell, Hamilton, Lampasas, Milam, Mills, San Saba.<br />
Table 32: LWDA 26 Central Texas- Individuals Eligible for <strong>Adult</strong> Education Services (2006-2008)<br />
Not English Fluent, Not English Fluent,<br />
Educational English Fluent Native Born Foreign Born Total<br />
Atta<strong>in</strong>ment Number Percent Number Percent Number Percent Number Percent<br />
0 to 4th<br />
Grade<br />
3,296 10.16% 198 9.68% 951 15.85% 4,445 10.97%<br />
5th to 8th<br />
Grade<br />
6,783 20.90% 647 31.66% 2,062 34.37% 9,492 23.44%<br />
9th to 12th<br />
Grade (no<br />
diploma)<br />
22,376 68.95% 550 26.91% 1,241 20.68% 24,168 59.67%<br />
High School<br />
Graduate<br />
* * 254 12.42% 986 16.43% 1,240 3.06%<br />
GED * * 53 2.59% 129 2.15% 182 0.45%<br />
Some College<br />
to 2-yr<br />
Degree<br />
* * 229 11.21% 369 6.16% 599 1.48%<br />
Bachelors<br />
Degree <strong>and</strong><br />
Higher<br />
* * 113 5.53% 262 4.37% 375 0.93%<br />
Total 32,455 100.00% 2,044 100.00% 6,001 100.00% 40,500 100.00%<br />
42
LWDA 27: Middle Rio Gr<strong>and</strong>e<br />
Counties Served: Dimmit, Edwards, K<strong>in</strong>ney, LaSalle, Maverick, Real, Uvalde, Val Verde, Zavala.<br />
Table 33: LWDA 27 Middle Rio Gr<strong>and</strong>e- Individuals Eligible for <strong>Adult</strong> Education Services (2006-2008)<br />
Not English Fluent, Not English Fluent,<br />
Educational English Fluent Native Born Foreign Born Total<br />
Atta<strong>in</strong>ment Number Percent Number Percent Number Percent Number Percent<br />
0 to 4th Grade 2,993 15.03% 2,355 39.79% 5,903 31.98% 11,251 25.41%<br />
5th to 8th<br />
Grade<br />
5,751 28.88% 1,884 31.84% 5,585 30.26% 13,219 29.85%<br />
9th to 12th<br />
Grade (no<br />
diploma)<br />
11,166 56.08% 656 11.08% 3,306 17.91% 15,128 34.16%<br />
High School<br />
Graduate<br />
* * 700 11.83% 1,798 9.74% 2,497 5.64%<br />
GED * * 0 0.00% 147 0.80% 147 0.33%<br />
Some College<br />
to 2-yr Degree<br />
* * 172 2.91% 776 4.20% 948 2.14%<br />
Bachelors<br />
Degree <strong>and</strong><br />
Higher<br />
* * 151 2.55% 944 5.11% 1,095 2.47%<br />
Total 19,910 100.00% 5,917 100.00% 18,458 100.00% 44,285 100.00%<br />
43
LWDA 28: Gulf Coast<br />
Counties Served: Aust<strong>in</strong>, Brazoria, Chambers, Colorado, Fort Bend, Galveston, Harris, Liberty,<br />
Matagorda, Montgomery, Walker, Waller, Wharton.<br />
Table 34: LWDA 28 Gulf Coast- Individuals Eligible for <strong>Adult</strong> Education Services (2006-2008)<br />
Not English Fluent, Not English Fluent,<br />
Educational English Fluent Native Born Foreign Born Total<br />
Atta<strong>in</strong>ment Number Percent Number Percent Number Percent Number Percent<br />
0 to 4th<br />
Grade<br />
44,161 8.89% 5,576 21.17% 74,513 16.69% 124,250 12.82%<br />
5th to 8th<br />
Grade<br />
114,745 23.10% 7,021 26.66% 145,640 32.63% 267,406 27.58%<br />
9th to 12th<br />
Grade (no<br />
diploma)<br />
337,794 68.01% 3,557 13.51% 86,281 19.33% 427,632 44.11%<br />
High School<br />
Graduate<br />
* * 4,210 15.98% 84,536 18.94% 88,746 9.15%<br />
GED * * 1,011 3.84% 6,747 1.51% 7,758 0.80%<br />
Some College<br />
to 2-yr<br />
Degree<br />
* * 2,847 10.81% 27,597 6.18% 30,444 3.14%<br />
Bachelors<br />
Degree <strong>and</strong><br />
Higher<br />
* * 2,115 8.03% 21,063 4.72% 23,178 2.39%<br />
Total 496,700 100.00% 26,337 100.00% 446,377 100.00% 969,414 100.00%<br />
44
Appendix B: Projection Methodologies<br />
The technical discussion about <strong>the</strong> projection methodologies conta<strong>in</strong>ed <strong>in</strong> this appendix was provided by<br />
<strong>the</strong> Office <strong>of</strong> <strong>the</strong> State Demographer. This appendix extensively details <strong>the</strong> procedures <strong>and</strong> support<strong>in</strong>g<br />
rationale beh<strong>in</strong>d <strong>the</strong> statewide <strong>and</strong> regional adult education projections. Although <strong>the</strong> tables have been<br />
reformatted <strong>and</strong> m<strong>in</strong>or stylistic edits have been made to be consistent with <strong>the</strong> rest <strong>of</strong> <strong>the</strong> paper, <strong>the</strong><br />
follow<strong>in</strong>g <strong>in</strong>formation <strong>in</strong> this appendix must be credited to <strong>the</strong> Office <strong>of</strong> <strong>the</strong> State Demographer.<br />
Methodology <strong>of</strong> <strong>the</strong> <strong>Adult</strong> Education Projection<br />
The future population <strong>in</strong> need <strong>of</strong> adult education <strong>in</strong> <strong>the</strong> state <strong>of</strong> Texas is strongly <strong>in</strong>fluenced by <strong>the</strong><br />
volume <strong>of</strong> <strong>in</strong>ternational migration to <strong>the</strong> state. This is <strong>the</strong> case because lack <strong>of</strong> English language literacy<br />
<strong>and</strong> low education are two <strong>of</strong> <strong>the</strong> pr<strong>in</strong>cipal markers <strong>of</strong> membership <strong>in</strong> <strong>the</strong> adult education service<br />
population. Both attributes are strongly associated with foreign birth.<br />
The Texas State Data Center prepares projections <strong>of</strong> <strong>the</strong> population <strong>of</strong> <strong>the</strong> state by age, sex, race <strong>and</strong><br />
Hispanic orig<strong>in</strong>, us<strong>in</strong>g a cohort component methodology. This method assumes <strong>the</strong> cont<strong>in</strong>uation <strong>of</strong><br />
current trends <strong>in</strong> age-sex-race-Hispanic orig<strong>in</strong> birth <strong>and</strong> death rates, <strong>and</strong> uses this <strong>in</strong>formation along<br />
with <strong>in</strong>formation about <strong>the</strong> current size <strong>of</strong> <strong>the</strong> population by <strong>the</strong>se attributes to predict future<br />
population. Change to <strong>the</strong> population because <strong>of</strong> migration from o<strong>the</strong>r states <strong>and</strong> o<strong>the</strong>r countries is<br />
h<strong>and</strong>led us<strong>in</strong>g several scenarios <strong>of</strong> possible future migration. The State Data Center publishes four such<br />
scenarios, based respectively on<br />
1. The age-sex-race-Hispanic orig<strong>in</strong> net migration rates observed <strong>in</strong> <strong>the</strong> 1990s (1.0 scenario);<br />
2. An assumed reduction <strong>of</strong> those rates by one-half (0.5 scenario);<br />
3. The <strong>in</strong>ferred net migration rates <strong>in</strong> a period after <strong>the</strong> census (from 2000 to 2004); <strong>and</strong><br />
4. An assumption <strong>of</strong> no migration.<br />
The methodology for <strong>the</strong>se projections is fur<strong>the</strong>r documented on <strong>the</strong> website <strong>of</strong> <strong>the</strong> Texas State Data<br />
Center (Texas State Data Center, 2009).<br />
The last, no migration, projection is not realistic. Texas has experienced net <strong>in</strong>-migration consistently <strong>in</strong><br />
each year s<strong>in</strong>ce <strong>the</strong> state’s recovery from <strong>the</strong> oil bust <strong>of</strong> <strong>the</strong> 1980s. The no migration scenario is<br />
calculated <strong>in</strong> order to serve as a reference tool to underst<strong>and</strong> <strong>the</strong> effects <strong>of</strong> migration on <strong>the</strong> state’s<br />
migration. The Office <strong>of</strong> <strong>the</strong> State Demographer recommends <strong>the</strong> 0.5 scenario (one-half <strong>of</strong> net<br />
migration observed <strong>in</strong> <strong>the</strong> 1990s) as <strong>the</strong> most plausible scenario for predict<strong>in</strong>g long term population<br />
growth <strong>in</strong> <strong>the</strong> state. It recommends <strong>the</strong> 2000-2004 scenario for shorter term projections, for example,<br />
<strong>of</strong> less than 10 years. These are, however, subjective judgments, <strong>and</strong> by no means constitute a<br />
certa<strong>in</strong>ty.<br />
45
The State Data Center projections have frequently been used to project future service dem<strong>and</strong> for <strong>the</strong><br />
state (Murdock et al., 2002). This is done by mak<strong>in</strong>g assumptions about <strong>the</strong> relationship between <strong>the</strong><br />
projected population by detailed demographic group <strong>and</strong> <strong>the</strong> projected characteristic. For example, if<br />
we assume that <strong>the</strong> percentage <strong>of</strong> <strong>the</strong> population with a high school diploma rema<strong>in</strong>s unchanged over<br />
time <strong>in</strong> detailed demographic groups by age-sex-race-Hispanic orig<strong>in</strong>, we could project <strong>the</strong> overall<br />
number <strong>and</strong> percentage <strong>of</strong> persons with a high school diploma, us<strong>in</strong>g <strong>the</strong> projection <strong>of</strong> <strong>the</strong> underly<strong>in</strong>g<br />
demographic characteristics, <strong>and</strong> <strong>the</strong>n apply<strong>in</strong>g <strong>the</strong> current rates. Alternatively, we can apply<br />
assumptions about trends <strong>in</strong> <strong>the</strong> group specific percentage with a diploma, to project future education<br />
levels <strong>in</strong> we believe that rates will <strong>in</strong>crease or decrease.<br />
The State Data Center projections do not explicitly project <strong>the</strong> size <strong>of</strong> <strong>the</strong> <strong>in</strong>ternational immigrant<br />
population. The migration components used <strong>in</strong> <strong>the</strong>se projections comb<strong>in</strong>e domestic <strong>and</strong> <strong>in</strong>ternational<br />
migration, <strong>and</strong> do not explicitly estimate a stock <strong>of</strong> resident <strong>in</strong>-migrants. The rapid growth <strong>of</strong> <strong>the</strong><br />
Hispanic population to some extent gives an <strong>in</strong>dication <strong>of</strong> <strong>the</strong> growth <strong>of</strong> <strong>the</strong> immigrant population, <strong>and</strong><br />
reflects <strong>the</strong> growth <strong>of</strong> a population that has been strongly shaped by recent migration, <strong>and</strong> whose social<br />
characteristics reflect <strong>the</strong> presence <strong>of</strong> a substantial m<strong>in</strong>ority <strong>of</strong> immigrants.<br />
However, as time goes on, <strong>the</strong> composition <strong>of</strong> <strong>the</strong> Hispanic population by nativity status can be<br />
expected to change. As Table 1 shows, <strong>the</strong>re is a sizable population <strong>of</strong> U.S.-born Hispanic children <strong>and</strong><br />
teenagers who are poised to jo<strong>in</strong> <strong>the</strong> workforce age population over <strong>the</strong> next decade <strong>and</strong> a half. Given<br />
current domestic migration patterns, as this population ages, its size will be <strong>in</strong>creased by net migration<br />
<strong>of</strong> Hispanics from o<strong>the</strong>r states. The future composition <strong>of</strong> <strong>the</strong> adult Hispanic population by immigrant<br />
status may change sharply over time as <strong>the</strong>se U.S.-born children age <strong>in</strong>to <strong>the</strong> adult population, Will <strong>the</strong><br />
foreign-born adult Hispanic population keep pace with <strong>the</strong> projected growth <strong>of</strong> <strong>the</strong> U.S.-born<br />
population, or will its share dim<strong>in</strong>ish over time? The size <strong>of</strong> <strong>the</strong> U.S.-born population is relatively easy to<br />
forecast. The answer to this question is conditional on <strong>the</strong> levels <strong>of</strong> net <strong>in</strong>ternational migration to <strong>and</strong><br />
from <strong>the</strong> state.<br />
Table 35: Hispanic <strong>Population</strong> by Age <strong>and</strong> Immigrant Status, 2008<br />
Hispanic <strong>Population</strong> All Less than 18 Age 18 or older<br />
Total 8,870,472 3,111,458 5,759,014<br />
Native 6,051,276 2,867,332 3,183,944<br />
Immigrant 2,819,196 244,126 2,575,070<br />
Percent Immigrant 31.80% 7.80% 44.70%<br />
Source: American Community Survey, 2008.<br />
In order to project <strong>the</strong> number <strong>of</strong> immigrants to <strong>the</strong> state with<strong>in</strong> <strong>the</strong> framework <strong>of</strong> <strong>the</strong> Texas State Data<br />
Center projection program, we used <strong>the</strong> already developed projection scenarios. These scenarios<br />
<strong>in</strong>cluded projections <strong>of</strong> <strong>the</strong> number <strong>of</strong> net migrants by ethnicity for each year out to <strong>the</strong> projection<br />
horizon <strong>of</strong> 2040. We selected two scenarios as most realistic: <strong>the</strong> one-half <strong>of</strong> 1990-2000 scenario (0.5<br />
scenario), <strong>the</strong> recommended long term scenario, <strong>and</strong> <strong>the</strong> 2000-2004 scenario, <strong>the</strong> recommend short-<br />
46
term projection scenario. The numbers <strong>of</strong> net migrants do not dist<strong>in</strong>guish migrants to Texas from o<strong>the</strong>r<br />
states or from o<strong>the</strong>r countries.<br />
We allocated <strong>the</strong>se total net migration numbers <strong>in</strong> each year to foreign <strong>and</strong> domestic migration, by<br />
assign<strong>in</strong>g a share <strong>of</strong> each migration year's estimated total net migration flows to foreign or domestic<br />
migration, us<strong>in</strong>g shares derived from Census Bureau estimates <strong>of</strong> <strong>the</strong> relative size <strong>of</strong> domestic <strong>and</strong><br />
<strong>in</strong>ternational migration flows to Texas <strong>in</strong> this decade. These numbers have fluctuated sharply<br />
throughout <strong>the</strong> decade, from 76% <strong>in</strong>ternational migration <strong>in</strong> 2003-2004 to 31% <strong>in</strong>ternational migration<br />
<strong>in</strong> 2005-2006, when domestic migration was <strong>in</strong>creased by Katr<strong>in</strong>a evacuees. We estimated several<br />
scenarios, <strong>and</strong> <strong>the</strong>n chose to apply <strong>the</strong> assumption that 60% <strong>of</strong> net migration flows anticipated <strong>in</strong> each<br />
projection model were <strong>in</strong>ternational flows, which approximates <strong>the</strong> overall average for this decade,<br />
elim<strong>in</strong>at<strong>in</strong>g <strong>the</strong> Katr<strong>in</strong>a <strong>in</strong>fluenced migration <strong>in</strong> 2005. This result<strong>in</strong>g <strong>in</strong> <strong>the</strong> follow<strong>in</strong>g projected flows to<br />
<strong>the</strong> state:<br />
Table 36: Projected International Migration to Texas, Selected Years Assum<strong>in</strong>g 60% <strong>of</strong> Migration is<br />
International (Texas State Data Center Projections)<br />
Scenario 2010 2020 2030 2040<br />
0.5 Scenario 86,297 107,535 129,918 153,143<br />
2000-2004 Scenario 138,595 192,907 258,727 338,693<br />
We compared <strong>the</strong> result<strong>in</strong>g projection numbers to recent projections for <strong>the</strong> United States by <strong>the</strong><br />
Census Bureau (U.S. Census Bureau, 2009b). The Census Bureau reports four projections that vary by<br />
projected <strong>in</strong>ternational migration scenario. These scenarios have not been calculated for specific states,<br />
but apply<strong>in</strong>g <strong>the</strong> fractional share (10.4%) <strong>of</strong> net <strong>in</strong>ternational migration to <strong>the</strong> United States that was<br />
assigned to Texas <strong>in</strong> Census Bureau estimates reported this decade yields approximate estimates <strong>of</strong> <strong>the</strong><br />
annual Texas share implied by each scenario.<br />
Table 37: Hypo<strong>the</strong>tical Annual Net Migration to Texas, U.S. Bureau <strong>of</strong> <strong>the</strong> Census Migration Projection<br />
Scenarios, Apply<strong>in</strong>g 10.4% Share <strong>of</strong> Net Migration to Texas<br />
Scenario 2010 2020 2030 2040<br />
2008 National Projections 137,814 151,719 171,392 191,065<br />
High Net International Migration Series 159,650 176,748 199,717 222,686<br />
Low Net International Migration Series 119,171 130,192 147,084 163,976<br />
Constant Net International Migration Series 100,425 100,425 100,425 100,425<br />
These comparisons suggest that <strong>the</strong> Texas State Data Center 2000-2004 projection scenario is high<br />
compared with any <strong>of</strong> <strong>the</strong> Census Bureau projections, unless <strong>the</strong> proportional share <strong>of</strong> <strong>in</strong>ternational<br />
migration is greatly reduced relative to domestic flows as we have assumed, or Texas' share <strong>of</strong> net<br />
<strong>in</strong>ternational migration <strong>in</strong>creases. Nei<strong>the</strong>r assumption seems warranted. By contrast <strong>the</strong> assumptions<br />
<strong>in</strong> <strong>the</strong> 0.5 scenario are relatively compatible with those <strong>in</strong> <strong>the</strong> Bureau's Low Net International Migration<br />
series, though <strong>the</strong> Texas totals run beh<strong>in</strong>d those <strong>in</strong> <strong>the</strong> Bureau's model. The <strong>in</strong>ferred migration <strong>in</strong> 2010<br />
47
is compatible with <strong>the</strong> recent volume <strong>of</strong> net <strong>in</strong>ternational migration flows to <strong>the</strong> state as reported <strong>in</strong><br />
census estimates (U.S. Census Bureau, 2009c).<br />
Of course, this exercise is substantially speculative with respect to what will actually happen <strong>in</strong> future<br />
migration to <strong>the</strong> state. Our ability to predict future migration flows on a <strong>the</strong>oretical basis is weak.<br />
However, <strong>the</strong> comparisons illustrate one reason that <strong>the</strong> State Data Center 0.5 migration scenario<br />
rema<strong>in</strong>s <strong>the</strong> preferred one for long term forecasts. All o<strong>the</strong>r scenarios imply ei<strong>the</strong>r a substantial<br />
<strong>in</strong>crease <strong>in</strong> <strong>the</strong> number <strong>of</strong> <strong>in</strong>ternational migrants to <strong>the</strong> state over <strong>the</strong> next several decades, or large<br />
<strong>in</strong>creases <strong>in</strong> domestic migration. Nei<strong>the</strong>r expectation appears strongly grounded <strong>in</strong> <strong>the</strong> demographic<br />
situation <strong>of</strong> <strong>the</strong> state or its pr<strong>in</strong>cipal migration partners. Specifically, <strong>the</strong> decl<strong>in</strong><strong>in</strong>g rate <strong>of</strong> growth <strong>of</strong> <strong>the</strong><br />
Mexican labor force over <strong>the</strong> next several decades may weaken <strong>the</strong> push-factors susta<strong>in</strong><strong>in</strong>g illegal<br />
migration to <strong>the</strong> state from Mexico, while <strong>the</strong> ag<strong>in</strong>g <strong>of</strong> <strong>the</strong> population <strong>of</strong> <strong>the</strong> United States may also put<br />
downward pressure on domestic migration flows.<br />
The last set <strong>of</strong> assumptions about <strong>the</strong> composition <strong>of</strong> <strong>in</strong>ternational migration that we made was derived<br />
by calculat<strong>in</strong>g <strong>the</strong> composition <strong>of</strong> recent immigrants to <strong>the</strong> state from <strong>the</strong> 2006-2008 American<br />
Community Survey microdata file (U.S. Census Bureau, 2009d) by age-sex-race-Hispanic orig<strong>in</strong>. These<br />
were <strong>the</strong>n applied to <strong>the</strong> total number <strong>of</strong> migrants calculated by <strong>the</strong> above methodology. The <strong>in</strong>ferred<br />
migration flows were allocated to age-sex-race-Hispanic orig<strong>in</strong> categories. Mortality assumptions were<br />
applied to <strong>the</strong> <strong>in</strong>ferred immigrant population that were identical to those used for <strong>the</strong> state's resident<br />
population.<br />
The two migration scenarios estimated imply a future growth <strong>of</strong> <strong>the</strong> state's foreign-born population<br />
from approximately 3.9 million today to between 6.5 million (0.5 scenario) <strong>and</strong> 9.8 million (2000-2004<br />
scenario) <strong>in</strong> 2040. Though <strong>the</strong>se <strong>in</strong>creases are large, <strong>the</strong>y also imply modest <strong>in</strong>creases only <strong>in</strong> <strong>the</strong><br />
percentage <strong>of</strong> <strong>the</strong> state's population that is foreign-born, as well as a decl<strong>in</strong><strong>in</strong>g share <strong>of</strong> <strong>the</strong> state's<br />
Hispanic population that is foreign-born. O<strong>the</strong>r significant changes implied by <strong>the</strong>se assumptions are<br />
that <strong>the</strong> Hispanic foreign-born population will significantly age both <strong>in</strong> terms <strong>of</strong> chronological age, but<br />
also <strong>in</strong> terms <strong>of</strong> years <strong>of</strong> experience liv<strong>in</strong>g <strong>in</strong> <strong>the</strong> United States. That is to say, unless <strong>in</strong>ternational<br />
migration to <strong>the</strong> state <strong>in</strong>creases substantially <strong>in</strong> future years, <strong>the</strong> current resident foreign-born<br />
population may be expected to grow older <strong>in</strong> terms <strong>of</strong> age <strong>and</strong> U.S. experience, <strong>and</strong> form <strong>the</strong>reby a<br />
relatively large share <strong>of</strong> <strong>the</strong> state's foreign-born population. Explor<strong>in</strong>g <strong>the</strong> implications <strong>of</strong> <strong>the</strong>se<br />
projected changes is beyond <strong>the</strong> scope <strong>of</strong> this project. Relevant to this project, <strong>the</strong>y do imply ris<strong>in</strong>g<br />
English language fluency <strong>in</strong> <strong>the</strong> foreign-born Hispanic population <strong>in</strong> <strong>the</strong> state.<br />
Allocat<strong>in</strong>g <strong>the</strong> Foreign-Born to Workforce Regions<br />
The adaption <strong>of</strong> <strong>the</strong> projections <strong>of</strong> <strong>the</strong> foreign-born population was calculated at <strong>the</strong> state level, <strong>and</strong><br />
<strong>the</strong>n allocated to work force regions to make estimates <strong>of</strong> <strong>the</strong> population <strong>in</strong> need <strong>of</strong> adult education <strong>in</strong><br />
each region. The allocations were made by assum<strong>in</strong>g that <strong>the</strong> growth <strong>of</strong> <strong>the</strong> foreign-born population <strong>in</strong><br />
each age-sex-race-Hispanic orig<strong>in</strong> group was proportional to <strong>the</strong> projected growth <strong>of</strong> <strong>the</strong> group as a<br />
whole with<strong>in</strong> each region. This growth is conditional on migration, both domestic <strong>and</strong> <strong>in</strong>ternational.<br />
48
This means that areas projected for faster growth based on net migration components <strong>in</strong> <strong>the</strong> base State<br />
Data Center projection models were allocated a larger share <strong>of</strong> <strong>the</strong> foreign-born population. We did not<br />
attempt to forecast chang<strong>in</strong>g regional patterns <strong>of</strong> <strong>in</strong>ternational migration with<strong>in</strong> <strong>the</strong> state. The result<strong>in</strong>g<br />
regional projections were controlled algebraically to equal projected statewide totals <strong>of</strong> <strong>the</strong> foreignborn.<br />
Convert<strong>in</strong>g <strong>the</strong> Foreign-Born Projections to <strong>Adult</strong> Education Projections<br />
The f<strong>in</strong>al step <strong>in</strong> <strong>the</strong> projection <strong>of</strong> adult education need was to apply age-sex-race-ethnicity-immigrant<br />
status-specific rates <strong>of</strong> education <strong>and</strong> English language fluency to <strong>the</strong> projected population <strong>of</strong> <strong>the</strong> state<br />
<strong>and</strong> workforce regions <strong>in</strong> each group. The education categories we used were hold<strong>in</strong>g a high school<br />
diploma or higher credential, versus be<strong>in</strong>g a high school dropout who was at least 16 years old. Fluency<br />
categories were those speak<strong>in</strong>g English only, very well or well versus those speak<strong>in</strong>g English not well,<br />
not at all. These rates were derived from <strong>the</strong> 2006-2008 sample <strong>of</strong> <strong>the</strong> American Community Survey for<br />
Texas. Use <strong>of</strong> more detailed educational atta<strong>in</strong>ment levels did not seem warranted on <strong>the</strong> basis <strong>of</strong><br />
available evidence.<br />
49
Appendix C: Projected <strong>Need</strong> for <strong>Adult</strong> Education by LWDA<br />
This appendix presents <strong>the</strong> projected numbers <strong>of</strong> <strong>in</strong>dividuals over <strong>the</strong> age <strong>of</strong> 16 who will qualify for adult<br />
education by each LWDA <strong>in</strong> 2010, 2020, 2030, <strong>and</strong> 2040. The numbers were calculated by <strong>the</strong> Office <strong>of</strong><br />
<strong>the</strong> State Demographer us<strong>in</strong>g <strong>the</strong> projection methodology detailed <strong>in</strong> Appendix B. In short, <strong>the</strong><br />
projections assumed rates <strong>of</strong> net migration that are half <strong>of</strong> those observed <strong>in</strong> <strong>the</strong> 1990s (<strong>the</strong> 0.5<br />
migration scenario), <strong>the</strong>n a portion <strong>of</strong> <strong>the</strong> total foreign-born population was allocated to each work<br />
force region based on <strong>the</strong> region’s projected growth, <strong>and</strong> f<strong>in</strong>ally <strong>the</strong> percentages <strong>of</strong> <strong>the</strong> population<br />
need<strong>in</strong>g adult education were calculated for each LWDA by apply<strong>in</strong>g statewide rates from <strong>the</strong> 2006-<br />
2008 American Community Survey. Individuals are considered not English fluent if <strong>the</strong>y report speak<strong>in</strong>g<br />
English “not well” or “not at all.”<br />
LWDA 1: Panh<strong>and</strong>le<br />
Table 38: LWDA 1 Panh<strong>and</strong>le- Projected Numbers <strong>of</strong> Individuals Eligible for <strong>Adult</strong> Education Services<br />
(2010-2040)<br />
LWDA Year<br />
Less than HS,<br />
English<br />
Fluent<br />
Less than HS,<br />
Not English<br />
Fluent<br />
HS <strong>and</strong> above,<br />
Not English<br />
Fluent Total<br />
Panh<strong>and</strong>le 2010 41,023 13,102 5,313 59,438<br />
2020 49,158 15,983 5,976 71,117<br />
2030 58,552 19,139 6,536 84,227<br />
2040 66,363 22,486 7,202 96,051<br />
LWDA 2: South Pla<strong>in</strong>s<br />
Table 39: LWDA 2 South Pla<strong>in</strong>s- Projected Numbers <strong>of</strong> Individuals Eligible for <strong>Adult</strong> Education Services<br />
(2010-2040)<br />
LWDA Year<br />
South<br />
Pla<strong>in</strong>s<br />
Less than HS,<br />
English<br />
Fluent<br />
Less than HS,<br />
Not English<br />
Fluent<br />
HS <strong>and</strong> above,<br />
Not English<br />
Fluent Total<br />
2010 42,078 10,158 3,947 56,182<br />
2020 48,599 12,286 4,395 65,280<br />
2030 56,083 14,575 4,775 75,433<br />
2040 60,892 16,114 5,044 82,050<br />
50
LWDA 3: North Texas<br />
Table 40: LWDA 3 North Texas- Projected Numbers <strong>of</strong> Individuals Eligible for <strong>Adult</strong> Education Services<br />
(2010-2040)<br />
LWDA Year<br />
North<br />
Texas<br />
Less than HS,<br />
English<br />
Fluent<br />
Less than HS,<br />
Not English<br />
Fluent<br />
HS <strong>and</strong> above,<br />
Not English<br />
Fluent Total<br />
2010 20,454 4,692 1,925 27,070<br />
2020 22,821 5,772 2,198 30,791<br />
2030 25,831 7,041 2,458 35,330<br />
2040 27,345 7,867 2,644 37,857<br />
LWDA 4: North Central<br />
Table 41: LWDA 4 North Central- Projected Numbers <strong>of</strong> Individuals Eligible for <strong>Adult</strong> Education<br />
Services (2010-2040)<br />
LWDA Year<br />
North<br />
Central<br />
Less than HS,<br />
English<br />
Fluent<br />
Less than HS,<br />
Not English<br />
Fluent<br />
HS <strong>and</strong> above,<br />
Not English<br />
Fluent Total<br />
2010 164,141 82,621 34,868 281,630<br />
2020 233,530 120,667 47,126 401,323<br />
2030 321,256 171,051 61,005 553,313<br />
2040 415,397 238,679 79,455 733,531<br />
LWDA 5: Tarrant County<br />
Table 42: LWDA 5 Tarrant County- Projected Numbers <strong>of</strong> Individuals Eligible for <strong>Adult</strong> Education<br />
Services (2010-2040)<br />
LWDA Year<br />
Tarrant<br />
County<br />
Less than HS,<br />
English<br />
Fluent<br />
Less than HS,<br />
Not English<br />
Fluent<br />
HS <strong>and</strong> above,<br />
Not English<br />
Fluent Total<br />
2010 146,710 76,127 31,107 253,944<br />
2020 191,212 103,921 39,009 334,141<br />
2030 244,798 135,653 46,784 427,234<br />
2040 299,933 173,307 55,838 529,078<br />
51
LWDA 6: Dallas<br />
Table 43: LWDA 6 Dallas- Projected Numbers <strong>of</strong> Individuals Eligible for <strong>Adult</strong> Education Services (2010-<br />
2040)<br />
LWDA Year<br />
Less than HS,<br />
English<br />
Fluent<br />
Less than HS,<br />
Not English<br />
Fluent<br />
HS <strong>and</strong> above,<br />
Not English<br />
Fluent Total<br />
Dallas 2010 251,095 178,852 71,333 501,280<br />
2020 327,645 239,473 87,931 655,049<br />
2030 418,801 307,064 103,914 829,780<br />
2040 514,504 381,961 120,534 1,016,999<br />
LWDA 7: North East<br />
Table 44: LWDA 7 North East- Projected Numbers <strong>of</strong> Individuals Eligible for <strong>Adult</strong> Education Services<br />
(2010-2040)<br />
LWDA Year<br />
Less than HS,<br />
English<br />
Fluent<br />
Less than HS,<br />
Not English<br />
Fluent<br />
HS <strong>and</strong> above,<br />
Not English<br />
Fluent Total<br />
North East 2010 25,284 5,261 2,293 32,838<br />
2020 28,406 6,276 2,495 37,177<br />
2030 31,293 7,126 2,581 41,000<br />
2040 32,226 7,891 2,658 42,775<br />
LWDA 8: East Texas<br />
Table 45: LWDA 8 East Texas- Projected Numbers <strong>of</strong> Individuals Eligible for <strong>Adult</strong> Education Services<br />
(2010-2040)<br />
LWDA Year<br />
Less than HS,<br />
English<br />
Fluent<br />
Less than HS,<br />
Not English<br />
Fluent<br />
HS <strong>and</strong> above,<br />
Not English<br />
Fluent Total<br />
East Texas 2010 73,471 16,612 7,392 97,475<br />
2020 86,725 21,343 8,893 116,961<br />
2030 102,354 26,397 10,297 139,049<br />
2040 114,890 32,916 12,311 160,117<br />
52
LWDA 9: West Central<br />
Table 46: LWDA 9 West Central- Projected Numbers <strong>of</strong> Individuals Eligible for <strong>Adult</strong> Education Services<br />
(2010-2040)<br />
LWDA Year<br />
West<br />
Central<br />
Less than HS,<br />
English<br />
Fluent<br />
Less than HS,<br />
Not English<br />
Fluent<br />
HS <strong>and</strong> above,<br />
Not English<br />
Fluent Total<br />
2010 32,074 6,260 2,553 40,888<br />
2020 35,704 7,291 2,720 45,716<br />
2030 39,987 8,389 2,865 51,242<br />
2040 41,784 9,156 2,991 53,931<br />
LWDA 10: Upper Rio Gr<strong>and</strong>e<br />
Table 47: LWDA 10 Upper Rio Gr<strong>and</strong>e- Projected Numbers <strong>of</strong> Individuals Eligible for <strong>Adult</strong> Education<br />
Services (2010-2040)<br />
LWDA Year<br />
Upper Rio<br />
Gr<strong>and</strong>e<br />
Less than HS,<br />
English<br />
Fluent<br />
Less than HS,<br />
Not English<br />
Fluent<br />
HS <strong>and</strong> above,<br />
Not English<br />
Fluent Total<br />
2010 100,680 85,006 28,706 214,392<br />
2020 121,442 99,515 31,794 252,751<br />
2030 146,925 115,835 34,374 297,134<br />
2040 171,634 128,258 36,581 336,473<br />
LWDA 11: Permian Bas<strong>in</strong><br />
Table 48: LWDA 11 Permian Bas<strong>in</strong>- Projected Numbers <strong>of</strong> Individuals Eligible for <strong>Adult</strong> Education<br />
Services (2010-2040)<br />
LWDA Year<br />
Permian<br />
Bas<strong>in</strong><br />
Less than HS,<br />
English<br />
Fluent<br />
Less than HS,<br />
Not English<br />
Fluent<br />
HS <strong>and</strong> above,<br />
Not English<br />
Fluent Total<br />
2010 42,483 18,494 6,796 67,773<br />
2020 49,380 21,961 7,461 78,802<br />
2030 57,542 25,719 8,008 91,269<br />
2040 63,019 28,426 8,446 99,891<br />
53
LWDA 12: Concho Valley<br />
Table 49: LWDA 12 Concho Valley- Projected Numbers <strong>of</strong> Individuals Eligible for <strong>Adult</strong> Education<br />
Services (2010-2040)<br />
LWDA Year<br />
Concho<br />
Valley<br />
Less than HS,<br />
English<br />
Fluent<br />
Less than HS,<br />
Not English<br />
Fluent<br />
HS <strong>and</strong> above,<br />
Not English<br />
Fluent Total<br />
2010 16,594 5,283 1,922 23,799<br />
2020 18,957 6,182 2,081 27,220<br />
2030 21,395 7,187 2,199 30,782<br />
2040 22,574 7,776 2,276 32,626<br />
LWDA 13: Heart <strong>of</strong> Texas<br />
Table 50: LWDA 13 Heart <strong>of</strong> Texas- Projected Numbers <strong>of</strong> Individuals Eligible for <strong>Adult</strong> Education<br />
Services (2010-2040)<br />
LWDA Year<br />
Heart <strong>of</strong><br />
Texas<br />
Less than HS,<br />
English<br />
Fluent<br />
Less than HS,<br />
Not English<br />
Fluent<br />
HS <strong>and</strong> above,<br />
Not English<br />
Fluent Total<br />
2010 32,981 8,821 3,720 45,522<br />
2020 39,083 10,734 4,280 54,097<br />
2030 46,725 13,085 4,826 64,636<br />
2040 52,963 15,291 5,429 73,682<br />
LWDA 14: Capital Area<br />
Table 51: LWDA 14 Capital Area- Projected Numbers <strong>of</strong> Individuals Eligible for <strong>Adult</strong> Education<br />
Services (2010-2040)<br />
LWDA Year<br />
Capital<br />
Area<br />
Less than HS,<br />
English<br />
Fluent<br />
Less than HS,<br />
Not English<br />
Fluent<br />
HS <strong>and</strong> above,<br />
Not English<br />
Fluent Total<br />
2010 91,331 49,741 20,443 161,515<br />
2020 122,204 64,580 24,429 211,212<br />
2030 158,540 82,456 28,352 269,348<br />
2040 191,744 98,601 31,387 321,733<br />
54
LWDA 15: Rural Capital<br />
Table 52: LWDA 15 Rural Capital- Projected Numbers <strong>of</strong> Individuals Eligible for <strong>Adult</strong> Education<br />
Services (2010-2040)<br />
LWDA Year<br />
Rural<br />
Capitol<br />
Less than HS,<br />
English<br />
Fluent<br />
Less than HS,<br />
Not English<br />
Fluent<br />
HS <strong>and</strong> above,<br />
Not English<br />
Fluent Total<br />
2010 61,102 24,184 9,933 95,220<br />
2020 87,557 33,815 13,091 134,463<br />
2030 123,240 46,415 16,710 186,365<br />
2040 162,808 62,003 21,360 246,171<br />
LWDA 16: Brazos Valley<br />
Table 53: LWDA 16 Brazos Valley- Projected Numbers <strong>of</strong> Individuals Eligible for <strong>Adult</strong> Education<br />
Services (2010-2040)<br />
LWDA Year<br />
Brazos<br />
Valley<br />
Less than HS,<br />
English<br />
Fluent<br />
Less than HS,<br />
Not English<br />
Fluent<br />
HS <strong>and</strong> above,<br />
Not English<br />
Fluent Total<br />
2010 26,625 9,720 4,114 40,459<br />
2020 31,877 11,529 4,587 47,993<br />
2030 37,813 13,861 5,091 56,765<br />
2040 42,110 16,197 5,659 63,966<br />
LWDA 17: Deep East Texas<br />
Table 54: LWDA 17 Deep East Texas- Projected Numbers <strong>of</strong> Individuals Eligible for <strong>Adult</strong> Education<br />
Services (2010-2040)<br />
LWDA Year<br />
Deep East<br />
Texas<br />
Less than HS,<br />
English<br />
Fluent<br />
Less than HS,<br />
Not English<br />
Fluent<br />
HS <strong>and</strong> above,<br />
Not English<br />
Fluent Total<br />
2010 35,782 6,704 2,930 45,416<br />
2020 41,556 8,188 3,340 53,085<br />
2030 47,902 9,745 3,703 61,350<br />
2040 52,364 11,543 4,200 68,107<br />
55
LWDA 18: South East Texas<br />
Table 55: LWDA 18 South East Texas- Projected Numbers <strong>of</strong> Individuals Eligible for <strong>Adult</strong> Education<br />
Services (2010-2040)<br />
LWDA Year<br />
South East<br />
Texas<br />
Less than HS,<br />
English<br />
Fluent<br />
Less than HS,<br />
Not English<br />
Fluent<br />
HS <strong>and</strong> above,<br />
Not English<br />
Fluent Total<br />
2010 38,129 7,751 3,298 49,179<br />
2020 43,708 10,025 3,930 57,663<br />
2030 50,246 12,595 4,516 67,356<br />
2040 55,094 15,562 5,257 75,913<br />
LWDA 19: Golden Crescent<br />
Table 56: LWDA 19 Golden Crescent- Projected Numbers <strong>of</strong> Individuals Eligible for <strong>Adult</strong> Education<br />
Services (2010-2040)<br />
LWDA Year<br />
Golden<br />
Crescent<br />
Less than HS,<br />
English<br />
Fluent<br />
Less than HS,<br />
Not English<br />
Fluent<br />
HS <strong>and</strong> above,<br />
Not English<br />
Fluent Total<br />
2010 21,834 5,339 1,983 29,156<br />
2020 25,235 6,192 2,151 33,578<br />
2030 29,163 7,159 2,304 38,626<br />
2040 31,791 8,001 2,478 42,271<br />
LWDA 20: Alamo<br />
Table 57: LWDA 20 Alamo - Projected Numbers <strong>of</strong> Individuals Eligible for <strong>Adult</strong> Education Services<br />
(2010-2040)<br />
LWDA Year<br />
Less than HS,<br />
English<br />
Fluent<br />
Less than HS,<br />
Not English<br />
Fluent<br />
HS <strong>and</strong> above,<br />
Not English<br />
Fluent Total<br />
Alamo 2010 236,925 93,298 33,617 363,839<br />
2020 286,374 110,546 36,965 433,885<br />
2030 339,461 128,193 39,459 507,113<br />
2040 380,466 142,592 41,775 564,833<br />
56
LWDA 21: South Texas<br />
Table 58: LWDA 21 South Texas- Projected Numbers <strong>of</strong> Individuals Eligible for <strong>Adult</strong> Education Services<br />
(2010-2040)<br />
LWDA Year<br />
South<br />
Texas<br />
Less than HS,<br />
English<br />
Fluent<br />
Less than HS,<br />
Not English<br />
Fluent<br />
HS <strong>and</strong> above,<br />
Not English<br />
Fluent Total<br />
2010 33,666 28,423 9,915 72,004<br />
2020 44,850 35,168 11,746 91,763<br />
2030 60,038 42,872 13,588 116,498<br />
2040 77,893 50,930 15,611 144,433<br />
LWDA 22: Coastal Bend<br />
Table 59: LWDA 22 Coastal Bend - Projected Numbers <strong>of</strong> Individuals Eligible for <strong>Adult</strong> Education<br />
Services (2010-2040)<br />
LWDA Year<br />
Coastal<br />
Bend<br />
Less than HS,<br />
English<br />
Fluent<br />
Less than HS,<br />
Not English<br />
Fluent<br />
HS <strong>and</strong> above,<br />
Not English<br />
Fluent Total<br />
2010 77,146 21,272 7,268 105,686<br />
2020 91,197 25,295 8,104 124,596<br />
2030 106,907 29,848 8,908 145,662<br />
2040 119,094 33,045 9,618 161,756<br />
LWDA 23: Lower Rio Gr<strong>and</strong>e Valley<br />
Table 60: LWDA 23 Lower Rio Gr<strong>and</strong>e Valley- Projected Numbers <strong>of</strong> Individuals Eligible for <strong>Adult</strong><br />
Education Services (2010-2040)<br />
LWDA Year<br />
Lower Rio<br />
Gr<strong>and</strong>e<br />
Less than HS,<br />
English<br />
Fluent<br />
Less than HS,<br />
Not English<br />
Fluent<br />
HS <strong>and</strong> above,<br />
Not English<br />
Fluent Total<br />
2010 100,181 89,815 31,652 221,648<br />
2020 132,487 112,016 37,123 281,627<br />
2030 173,671 136,204 42,229 352,103<br />
2040 220,701 163,143 48,035 431,878<br />
57
LWDA 24: Cameron County<br />
Table 61: LWDA 24 Cameron County- Projected Numbers <strong>of</strong> Individuals Eligible for <strong>Adult</strong> Education<br />
Services (2010-2040)<br />
LWDA Year<br />
Cameron<br />
County<br />
Less than HS,<br />
English<br />
Fluent<br />
Less than HS,<br />
Not English<br />
Fluent<br />
HS <strong>and</strong> above,<br />
Not English<br />
Fluent Total<br />
2010 49,602 40,558 13,756 103,916<br />
2020 61,914 49,003 15,673 126,589<br />
2030 77,492 57,978 17,428 152,898<br />
2040 93,634 66,237 19,107 178,978<br />
LWDA 25: Texoma<br />
Table 62: LWDA 25 Texoma- Projected Numbers <strong>of</strong> Individuals Eligible for <strong>Adult</strong> Education Services<br />
(2010-2040)<br />
LWDA Year<br />
Less than HS,<br />
English<br />
Fluent<br />
Less than HS,<br />
Not English<br />
Fluent<br />
HS <strong>and</strong> above,<br />
Not English<br />
Fluent Total<br />
Texoma 2010 15,888 3,423 1,547 20,858<br />
2020 18,364 4,278 1,806 24,448<br />
2030 21,314 5,152 2,019 28,485<br />
2040 23,150 5,993 2,253 31,395<br />
LWDA 26: Central Texas<br />
Table 63: LWDA 26 Central- Projected Numbers <strong>of</strong> Individuals Eligible for <strong>Adult</strong> Education Services<br />
(2010-2040)<br />
LWDA Year<br />
Central<br />
Texas<br />
Less than HS,<br />
English<br />
Fluent<br />
Less than HS,<br />
Not English<br />
Fluent<br />
HS <strong>and</strong> above,<br />
Not English<br />
Fluent Total<br />
2010 38,418 8,744 3,808 50,970<br />
2020 48,977 11,825 4,763 65,565<br />
2030 62,386 15,731 5,797 83,914<br />
2040 74,878 19,024 6,658 100,561<br />
58
LWDA 27: Middle Rio Gr<strong>and</strong>e<br />
Table 64: LWDA 27 Middle Rio Gr<strong>and</strong>e- Projected Numbers <strong>of</strong> Individuals Eligible for <strong>Adult</strong> Education<br />
Services (2010-2040)<br />
LWDA Year<br />
Middle Rio<br />
Gr<strong>and</strong>e<br />
Less than HS,<br />
English<br />
Fluent<br />
Less than HS,<br />
Not English<br />
Fluent<br />
HS <strong>and</strong> above,<br />
Not English<br />
Fluent Total<br />
2010 22,131 15,025 4,663 41,820<br />
2020 25,760 17,560 5,203 48,523<br />
2030 29,975 19,961 5,594 55,530<br />
2040 34,055 22,077 5,956 62,088<br />
LWDA 28: Gulf Coast<br />
Table 65: LWDA 28 Gulf Coast- Projected Numbers <strong>of</strong> Individuals Eligible for <strong>Adult</strong> Education Services<br />
(2010-2040)<br />
LWDA Year<br />
Less than HS,<br />
English<br />
Fluent<br />
Less than HS,<br />
Not English<br />
Fluent<br />
HS <strong>and</strong> above,<br />
Not English<br />
Fluent Total<br />
Gulf Coast 2010 548,775 390,119 152,794 1,091,689<br />
2020 714,044 512,647 185,842 1,412,533<br />
2030 906,842 647,383 216,633 1,770,858<br />
2040 1,096,776 785,711 248,270 2,130,757<br />
59