A molecular genetic map of cassava (Manihot esculenta Crantz)
A molecular genetic map of cassava (Manihot esculenta Crantz)
A molecular genetic map of cassava (Manihot esculenta Crantz)

Create successful ePaper yourself
Turn your PDF publications into a flip-book with our unique Google optimized e-Paper software.
436<br />
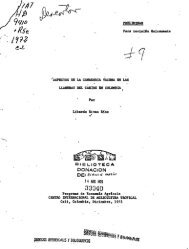
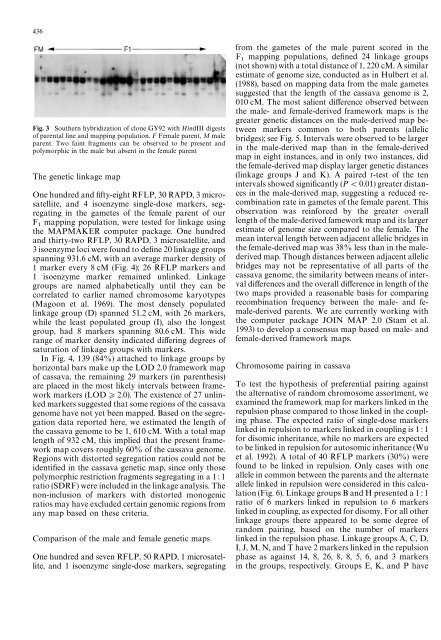
Fig. 3 Southern hybridization <strong>of</strong> clone GY92 with HindIII digests<br />
<strong>of</strong> parental line and <strong>map</strong>ping population. F Female parent, M male<br />
parent. Two faint fragments can be observed to be present and<br />
polymorphic in the male but absent in the female parent<br />
The <strong>genetic</strong> linkage <strong>map</strong><br />
One hundred and fifty-eight RFLP, 30 RAPD, 3 microsatellite,<br />
and 4 isoenzyme single-dose markers, segregating<br />
in the gametes <strong>of</strong> the female parent <strong>of</strong> our<br />
F <strong>map</strong>ping population, were tested for linkage using<br />
the MAPMAKER computer package. One hundred<br />
and thirty-two RFLP, 30 RAPD, 3 microsatellite, and<br />
3 isoenzyme loci were found to define 20 linkage groups<br />
spanning 931.6 cM, with an average marker density <strong>of</strong><br />
1 marker every 8 cM (Fig. 4); 26 RFLP markers and<br />
1 isoenzyme marker remained unlinked. Linkage<br />
groups are named alphabetically until they can be<br />
correlated to earlier named chromosome karyotypes<br />
(Magoon et al. 1969). The most densely populated<br />
linkage group (D) spanned 51.2 cM, with 26 markers,<br />
while the least populated group (I), also the longest<br />
group, had 8 markers spanning 80.6 cM. This wide<br />
range <strong>of</strong> marker density indicated differing degrees <strong>of</strong><br />
saturation <strong>of</strong> linkage groups with markers.<br />
In Fig. 4, 139 (84%) attached to linkage groups by<br />
horizontal bars make up the LOD 2.0 framework <strong>map</strong><br />
<strong>of</strong> <strong>cassava</strong>, the remaining 29 markers (in parenthesis)<br />
are placed in the most likely intervals between framework<br />
markers (LOD*2.0). The existence <strong>of</strong> 27 unlinked<br />
markers suggested that some regions <strong>of</strong> the <strong>cassava</strong><br />
genome have not yet been <strong>map</strong>ped. Based on the segregation<br />
data reported here, we estimated the length <strong>of</strong><br />
the <strong>cassava</strong> genome to be 1, 610 cM. With a total <strong>map</strong><br />
length <strong>of</strong> 932 cM, this implied that the present framework<br />
<strong>map</strong> covers roughly 60% <strong>of</strong> the <strong>cassava</strong> genome.<br />
Regions with distorted segregation ratios could not be<br />
identified in the <strong>cassava</strong> <strong>genetic</strong> <strong>map</strong>, since only those<br />
polymorphic restriction fragments segregating in a 1 : 1<br />
ratio (SDRF) were included in the linkage analysis. The<br />
non-inclusion <strong>of</strong> markers with distorted monogenic<br />
ratios may have excluded certain genomic regions from<br />
any <strong>map</strong> based on these criteria.<br />
Comparison <strong>of</strong> the male and female <strong>genetic</strong> <strong>map</strong>s<br />
One hundred and seven RFLP, 50 RAPD, 1 microsatellite,<br />
and 1 isoenzyme single-dose markers, segregating<br />
TAG 018<br />
from the gametes <strong>of</strong> the male parent scored in the<br />
F <strong>map</strong>ping populations, defined 24 linkage groups<br />
(not shown) with a total distance <strong>of</strong> 1, 220 cM. A similar<br />
estimate <strong>of</strong> genome size, conducted as in Hulbert et al.<br />
(1988), based on <strong>map</strong>ping data from the male gametes<br />
suggested that the length <strong>of</strong> the <strong>cassava</strong> genome is 2,<br />
010 cM. The most salient difference observed between<br />
the male- and female-derived framework <strong>map</strong>s is the<br />
greater <strong>genetic</strong> distances on the male-derived <strong>map</strong> between<br />
markers common to both parents (allelic<br />
bridges); see Fig. 5. Intervals were observed to be larger<br />
in the male-derived <strong>map</strong> than in the female-derived<br />
<strong>map</strong> in eight instances, and in only two instances, did<br />
the female-derived <strong>map</strong> display larger <strong>genetic</strong> distances<br />
(linkage groups J and K). A paired t-test <strong>of</strong> the ten<br />
intervals showed significantly (P(0.01) greater distances<br />
in the male-derived <strong>map</strong>, suggesting a reduced recombination<br />
rate in gametes <strong>of</strong> the female parent. This<br />
observation was reinforced by the greater overall<br />
length <strong>of</strong> the male-derived famework <strong>map</strong> and its larger<br />
estimate <strong>of</strong> genome size compared to the female. The<br />
mean interval length between adjacent allelic bridges in<br />
the female-derived <strong>map</strong> was 38% less than in the malederived<br />
<strong>map</strong>. Though distances between adjacent allelic<br />
bridges may not be representative <strong>of</strong> all parts <strong>of</strong> the<br />
<strong>cassava</strong> genome, the similarity between means <strong>of</strong> interval<br />
differences and the overall difference in length <strong>of</strong> the<br />
two <strong>map</strong>s provided a reasonable basis for comparing<br />
recombination frequency between the male- and female-derived<br />
parents. We are currently working with<br />
the computer package JOIN MAP 2.0 (Stam et al.<br />
1993) to develop a consensus <strong>map</strong> based on male- and<br />
female-derived framework <strong>map</strong>s.<br />
Chromosome pairing in <strong>cassava</strong><br />
To test the hypothesis <strong>of</strong> preferential pairing against<br />
the alternative <strong>of</strong> random chromosome assortment, we<br />
examined the framework <strong>map</strong> for markers linked in the<br />
repulsion phase compared to those linked in the coupling<br />
phase. The expected ratio <strong>of</strong> single-dose markers<br />
linked in repulsion to markers linked in coupling is 1 : 1<br />
for disomic inheritance, while no markers are expected<br />
to be linked in repulsion for autosomic inheritance (Wu<br />
et al. 1992). A total <strong>of</strong> 40 RFLP markers (30%) were<br />
found to be linked in repulsion. Only cases with one<br />
allele in common between the parents and the alternate<br />
allele linked in repulsion were considered in this calculation<br />
(Fig. 6). Linkage groups B and H presented a 1 : 1<br />
ratio <strong>of</strong> 6 markers linked in repulsion to 6 markers<br />
linked in coupling, as expected for disomy. For all other<br />
linkage groups there appeared to be some degree <strong>of</strong><br />
random pairing, based on the number <strong>of</strong> markers<br />
linked in the repulsion phase. Linkage groups A, C, D,<br />
I, J, M, N, and T have 2 markers linked in the repulsion<br />
phase as against 14, 8, 26, 8, 8, 5, 6, and 3 markers<br />
in the groups, respectively. Groups E, K, and P have