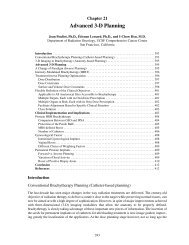
Comparison of inverse planning simulated annealing and geometrical
Comparison of inverse planning simulated annealing and geometrical
Comparison of inverse planning simulated annealing and geometrical

Create successful ePaper yourself
Turn your PDF publications into a flip-book with our unique Google optimized e-Paper software.
Brachytherapy 3 (2004) 147–152<br />
<strong>Comparison</strong> <strong>of</strong> <strong>inverse</strong> <strong>planning</strong> <strong>simulated</strong> <strong>annealing</strong> <strong>and</strong> <strong>geometrical</strong><br />
optimization for prostate high-dose-rate brachytherapy<br />
I-Chow J. Hsu 1, *, Etienne Lessard 1 , Vivian Weinberg 2 , Jean Pouliot 1<br />
1 Department <strong>of</strong> Radiation Oncology, University <strong>of</strong> California San Francisco, Comprehensive Cancer Center, San Francisco, CA<br />
2 Biostatistics Core, University <strong>of</strong> California San Francisco, Comprehensive Cancer Center, San Francisco, CA<br />
ABSTRACT PURPOSE: An <strong>inverse</strong> <strong>planning</strong> <strong>simulated</strong> <strong>annealing</strong> (IPSA) algorithm for optimization <strong>of</strong> highdose-rate<br />
(HDR) brachytherapy has been previously described. In this study, IPSA is compared<br />
with <strong>geometrical</strong> optimization (GO) for prostate brachytherapy.<br />
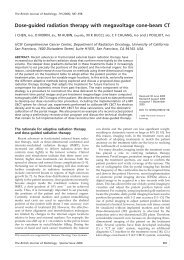
METHODS AND MATERIALS: Using CT data collected from 10 patients, treatment plans were<br />
prepared using GO <strong>and</strong> IPSA. The clinical target volume (CTV) <strong>and</strong> critical organs (CO) including<br />
bladder, rectum, <strong>and</strong> urethra were contoured using Plato Version 14.2.1 (Nucletron Corp., Veenendaal,<br />
The Netherl<strong>and</strong>s). Implant catheters were digitized using the CT <strong>planning</strong> system. All dwell positions<br />
outside <strong>of</strong> the CTV were turned <strong>of</strong>f. Two optimized plans were generated for each implant using<br />
GO <strong>and</strong> IPSA. The same set <strong>of</strong> dose constraints were used for all <strong>inverse</strong> <strong>planning</strong> calculations <strong>and</strong><br />
no manual adjustment <strong>of</strong> the dwell weight was used. Two prescription methods were used. Using<br />
the first method, coverage was prioritized: the prescription dose was normalized to the isodose<br />
volume that covers 98% <strong>of</strong> the CTV (V100 98% <strong>of</strong> CTV). The dose volume histograms (DVH)<br />
<strong>of</strong> CO were generated for comparison. Using the second method, sparing was prioritized: the<br />
prescription dose was normalized such that no urethra volume received 150% <strong>of</strong> the prescription<br />
dose (V150-urethra 0 cc). The DVH <strong>of</strong> CTV <strong>and</strong> CO were generated, <strong>and</strong> the homogeneity index<br />
(HI) <strong>and</strong> conformal index (COIN) were calculated for comparison <strong>and</strong> compared using the Wilcoxon<br />
matched-pairs test.<br />
RESULTS: Using the coverage-prioritized method, the difference in V80-bladder dose was not<br />
statistically significant (p 0.09; median: IPSA 0.62 cc, GO 1.05 cc). The V80-rectum ranged<br />
from 0.20–4.8 cc, <strong>and</strong> 0.05–1.4 cc using GO <strong>and</strong> IPSA, respectively. IPSA’s V80-rectum was<br />
significantly lower (p 0.005; median: IPSA 0.38 cc, GO 1.31 cc). V150-urethra ranged from<br />
0.02–0.75 cc <strong>and</strong> 0.0–0.01 cc using GO <strong>and</strong> IPSA, respectively. The V150-urethra was significantly<br />
lower using IPSA (p 0.005; median: IPSA 0.00 cc, GO 0.33 cc). Using the sparing prioritized<br />
method, the V100-prostate ranged from 30–97% <strong>and</strong> 95–100% using GO <strong>and</strong> IPSA, respectively.<br />
This difference was statistically significant (p 0.008). The HI <strong>and</strong> COIN were statistically higher<br />
using IPSA (p 0.005).<br />
CONCLUSION: Anatomy-based <strong>inverse</strong> optimization using IPSA is superior to dwell-positionbased<br />
optimization using GO as it: (1) Improves target coverage <strong>and</strong> conformality while sparing<br />
normal structures, (2) Improves dose homogeneity within the target, <strong>and</strong> (3) Minimizes volume<br />
<strong>of</strong> non-contoured normal tissue irradiated. Routine application <strong>of</strong> three-dimensional brachytherapy<br />
<strong>planning</strong> <strong>and</strong> anatomy-based <strong>inverse</strong> dwell time optimization is recommended. 2004 American<br />
Brachytherapy Society. All rights reserved.<br />
Keywords: Optimization; Inverse <strong>planning</strong>; Simulated <strong>annealing</strong>; Geometric optimization; HDR prostate brachytherapy<br />
This abstract was presented at the American Brachytherapy Society<br />
Annual Meeting in Orl<strong>and</strong>o, Florida, 2002.<br />
* Corresponding author. Department <strong>of</strong> Radiation Oncology, University<br />
<strong>of</strong> California San Francisco Comprehensive Cancer Center, 1600<br />
Divisadero Street, Suite H1031, San Francisco, CA 94143-1708. Tel.: 1-<br />
415-353-7175; fax: 1-415-353-9883.<br />
E-mail address: hsu@radonc17.ucsf.edu (I.-C.J. Hsu).<br />
Introduction<br />
1538-4721/04/$ – see front matter 2004 American Brachytherapy Society. All rights reserved.<br />
doi:10.1016/j.brachy.2004.05.007<br />
One <strong>of</strong> the advantages <strong>of</strong> having remote afterloading<br />
brachytherapy is the ability to control the dose delivered by<br />
altering the dwell times. For any given implant with hundreds<br />
<strong>of</strong> dwell positions, there are a very large number <strong>of</strong> combinations<br />
<strong>of</strong> dwell times. One <strong>of</strong> the challenges in brachytherapy
148<br />
is to select the optimal combination for a particular clinical<br />
scenario. There are various optimization programs, including<br />
dose point optimization, <strong>geometrical</strong> optimization, <strong>and</strong> <strong>inverse</strong><br />
optimization that can be applied (1–3). The purpose<br />
<strong>of</strong> this study is to compare <strong>geometrical</strong> optimization (GO)<br />
with our in-house <strong>inverse</strong> <strong>planning</strong> <strong>simulated</strong> <strong>annealing</strong><br />
(IPSA) method. These two programs represent the traditional<br />
dwell-position-based dwell time optimization approach (GO)<br />
<strong>and</strong> an anatomy-based dwell time optimization approach<br />
(IPSA). The present study was developed to perform a statistical<br />
comparison <strong>of</strong> the dosimetry using data from a cohort<br />
<strong>of</strong> patients treated at our institution. The <strong>planning</strong> systems<br />
are compared using a hypothetical scenario where there is no<br />
additional human intervention such as modification <strong>of</strong> active<br />
dwell positions, adjustment <strong>of</strong> the dwell time, or adjustment<br />
<strong>of</strong> optimization parameters. Eliminating the influence <strong>of</strong> the<br />
planner’s experience on the results permits a fair evaluation<br />
<strong>of</strong> the optimization programs.<br />
Method <strong>and</strong> materials<br />
Implant procedure<br />
All patients had localized prostate cancer <strong>and</strong> underwent<br />
a course <strong>of</strong> external beam radiotherapy to 45Gy to the whole<br />
pelvis in 5 weeks followed by one HDR prostate implant<br />
delivering 19 Gy in 2 fractions. The prostate implant was done<br />
with transrectal ultrasound (TRUS) guidance under epidural<br />
anesthesia. At the beginning <strong>of</strong> the implant, a Foley catheter<br />
is inserted to help visualize the urethra. Each Flexi-guide<br />
catheter was inserted by following the tip <strong>of</strong> the catheter<br />
from the apex <strong>of</strong> the prostate to the base <strong>of</strong> the prostate<br />
using ultrasound <strong>and</strong> a stepper. All catheters were kept just<br />
within the TRUS-defined prostatic capsule. Generally, 16<br />
catheters were used with 75% <strong>of</strong> catheters located on the<br />
periphery <strong>and</strong> 25% around the urethra. The depth <strong>of</strong> each<br />
catheter was adjusted using flexible cystoscopy. The tips<br />
<strong>of</strong> catheters were always kept below the bladder mucosa<br />
<strong>and</strong> out <strong>of</strong> the urethra. After the catheters were inserted,<br />
they were secured to the perineum using sutures.<br />
Treatment <strong>planning</strong><br />
After the implant, a treatment <strong>planning</strong> pelvic CT was<br />
done. Three-millimeter-thick CT slices were collected using<br />
a spiral CT. The clinical target volume (CTV) <strong>and</strong> critical<br />
organs (CO) including bladder, rectum, <strong>and</strong> urethra were<br />
contoured using the Nucletron Plato Version 14.2.1 (Nucletron<br />
B.V., Veenendaal, The Netherl<strong>and</strong>s). The CTV included only<br />
the prostate <strong>and</strong> no margin was added. When outlining the<br />
bladder <strong>and</strong> rectum, the outer most mucosa surface was<br />
contoured. The urethra was defined by the outer surface <strong>of</strong><br />
the Foley catheter. Only the urethral volume within the CTV<br />
was contoured. The COs were contoured on all CT images<br />
containing the CTV <strong>and</strong> at least two additional images above<br />
<strong>and</strong> below. Implant catheters were digitized using the CT<br />
Hsu et al. / Brachytherapy 3 (2004) 147–152<br />
reconstruction. Only dwell positions that were inside the<br />
CTV were activated.<br />
Optimization programs<br />
GO selects the dwell time <strong>of</strong> a particular dwell position<br />
based on the sum <strong>of</strong> the square distances to other dwell<br />
positions (1, 3, 4). As a result, the relative dwell time at a<br />
dwell position is <strong>inverse</strong>ly proportional to contributions from<br />
all the other active dwell positions. The relative dwell time<br />
is based on the equation below:<br />
{ Ti n<br />
j1<br />
j≠i<br />
T j[(x jx i) 2 (y jy i) 2 (z jz i) 2 ] 1}<br />
where T i is the relative time for dwell position i, <strong>and</strong> T j<br />
is the relative time for all the other active dwell positions.<br />
Similarly, xi, yi, <strong>and</strong> zi are coordinates <strong>of</strong> the dwell position<br />
i; <strong>and</strong> x j, y j, <strong>and</strong> z j are the coordinates <strong>of</strong> all the other active<br />
dwell positions.<br />
In a <strong>geometrical</strong>ly optimized implant, the dwell times <strong>of</strong><br />
dwell positions near the periphery <strong>of</strong> the implant tend to<br />
be longer, because they are further away from other dwell<br />
positions. Geometric optimization is ideal for volume implants<br />
where the dwell positions are evenly spaced among<br />
each other. Geometrical optimization improves the coverage<br />
<strong>of</strong> the implanted volume <strong>and</strong> decreases hot spots within<br />
the implant. It is a very fast optimization algorithm but it<br />
does not optimize based on anatomy.<br />
IPSA identifies the combination <strong>of</strong> dwell time that best<br />
conforms to dose constraints <strong>of</strong> target volumes, <strong>and</strong> critical<br />
organs. After contouring the volume <strong>of</strong> interest, dose constraints<br />
are given to dose calculation points within each<br />
volume. For each contoured volume, there are two types <strong>of</strong><br />
dose calculation points. One set <strong>of</strong> dose calculation points<br />
is located near the surface <strong>of</strong> the contour <strong>and</strong> the other<br />
set is located near the dwell positions. The adjustment dose<br />
to the first set <strong>of</strong> dose points controls the target coverage <strong>and</strong><br />
conformality, <strong>and</strong> adjustment <strong>of</strong> dose to the second set <strong>of</strong><br />
dose points controls the dose homogeneity. The specific dose<br />
constraints used for all cases in this study are listed below:<br />
Dmin Mmin Dmax Mmax<br />
Targetsurface 950 100 1425 100<br />
Targetinside 950 100 1425 70<br />
Urethra surface 950 100 1140 60<br />
Urethra inside 950 100 1140 60<br />
Bladdersurface 0 0 475 40<br />
Rectum surface 0 0 475 40<br />
where D min <strong>and</strong> D max represent the lower <strong>and</strong> the upper range<br />
<strong>of</strong> acceptable doses. If the dose goes below or above
Table 1<br />
Results from the coverage-prioritized method (V100 98%)<br />
Hsu et al. / Brachytherapy 3 (2004) 147–152 149<br />
IPSA GO<br />
Prostate Target Bladder Rectum Urethra Target Target Bladder Rectum Urethra Target<br />
size (cc) %V100 V80 (cc) V80 (cc) V150 (cc) V150 (cc) %V100 V80 (cc) V80 (cc) V150 (cc) V150 (cc)<br />
1 23 98 1.2 0.07 0 10 98 1.9 0.62 0.26 20<br />
2 48 98 0.65 1.4 0.01 24 98 1.5 3.0 0.43 37<br />
3 30 98 0.02 0.08 0 12 98 0.11 0.20 0.52 23<br />
4 23 98 0.59 0.16 0 12 98 0.67 1.1 0.20 20<br />
5 31 98 1.6 0.37 0 17 98 1.9 1.1 0.28 30<br />
6 32 98 0.48 0.05 0 20 98 0.45 1.7 0.38 28<br />
7 47 98 2.6 0.44 0 24 98 3.0 0.83 0.02 33<br />
8 41 98 2.2 0.38 0 19 98 1.4 1.5 0.75 45<br />
9 39 98 0.24 0.64 0 20 98 0.58 2.6 0.39 36<br />
10 57 98 0.14 1.2 0 26 98 0.15 4.8 0.17 51<br />
IPSA <strong>inverse</strong> <strong>planning</strong> <strong>simulated</strong> <strong>annealing</strong>; Go <strong>geometrical</strong> optimization.<br />
the range, the penalty increases at rates M min <strong>and</strong> M max<br />
respectively. Adjustment <strong>of</strong> M min <strong>and</strong> M max sets the relative<br />
importance between structures. Once the dose constraints<br />
are set, IPSA finds the dwell time combination with the least<br />
amount <strong>of</strong> penalty using the <strong>simulated</strong> <strong>annealing</strong> algorithm.<br />
Dosimetric comparison<br />
Using CT data collected from our first 10 patients who<br />
underwent CT-based HDR prostate brachytherapy, treatment<br />
plans were prepared using GO <strong>and</strong> IPSA. IPSA automatically<br />
<strong>and</strong> selectively activates dwell positions in relation to the<br />
CTV <strong>and</strong> CO. However, GO does not have the same capability,<br />
so all dwell positions outside <strong>of</strong> the CTV were turned<br />
<strong>of</strong>f for the comparison. Optimized plans were generated for<br />
each implant using GO <strong>and</strong> IPSA. For the IPSA, the same<br />
dose constraints were used for all <strong>inverse</strong> <strong>planning</strong> calculations<br />
<strong>and</strong> no manual adjustment <strong>of</strong> the dwell weight was<br />
used. Similarly, no manual adjustment <strong>of</strong> the dwell weight<br />
was used in GO.<br />
Two prescription methods were used. The first method<br />
prioritized coverage. The prescription dose was normalized<br />
to the isodose volume that covers 98% <strong>of</strong> the CTV<br />
(V100 98% <strong>of</strong> CTV). This method <strong>of</strong> prescribing dose<br />
ensures the target coverage is uniform, so the focus <strong>of</strong><br />
the comparison is on sparing <strong>of</strong> critical organs.<br />
The second method prioritized sparing <strong>of</strong> CO inside the<br />
target volume. The prescription dose was normalized such<br />
Fig. 1. A plot <strong>of</strong> absolute dwell times from a 16-catheter prostate implant based on the coverage-prioritized method. Note many dwell positions are<br />
completely turned <strong>of</strong>f in the IPSA plan.
150<br />
Fig. 2. An illustration <strong>of</strong> the isodose distribution from the center slice <strong>of</strong><br />
a 16-catheter prostate implant. The clinical target volume is the bright red<br />
line <strong>and</strong> the 100% isodose line is in dark red. The V100 covers 98% <strong>of</strong><br />
the target volume with both methods.<br />
that no urethral volume received 150% <strong>of</strong> the prescription<br />
dose. (V150-urethra 0 cc). This was done to simulate a<br />
commonly encountered clinical situation where the prostatic<br />
urethra dose has to be limited. In this case, the focus <strong>of</strong> the<br />
comparison was on the target coverage.<br />
The homogeneity index (HI) was calculated for all the<br />
plans for comparison (5). HI is defined as:<br />
HI V 100 V 150<br />
V 100<br />
This index is used to assess the volume <strong>of</strong> the hot spot<br />
generated relative to the treated volume.<br />
Hsu et al. / Brachytherapy 3 (2004) 147–152<br />
Similarly, conformal index (COIN) was calculated for all<br />
the plans for comparison (6). COIN is defined as:<br />
COIN (CTV ref/CTV)<br />
(CTV ref/V ref)<br />
CTV ref is defined as the volume within CTV that is also<br />
within the referenced isodose, <strong>and</strong> V ref is defined as the<br />
volume (inside <strong>and</strong> outside <strong>of</strong> CTV) within the referenced<br />
isodose. COIN is a unique index that accounts for the entire<br />
dose inside the treated volume, not just inside the target<br />
volume, but also outside <strong>of</strong> any contoured structures. Any<br />
unintentional or artificial dumping <strong>of</strong> dose outside <strong>of</strong> contoured<br />
structures affects this index. Statistical comparison <strong>of</strong><br />
all the indices <strong>and</strong> doses were done using the Wilcoxon<br />
matched pair test.<br />
Results<br />
The CTV ranged from 23–57 cc for the 10 patients, with<br />
a median <strong>of</strong> 36 cc. The optimization time was less than 1<br />
min using either algorithm. Examples <strong>of</strong> the result <strong>of</strong> the<br />
optimization are shown in Table 1, Fig. 1, <strong>and</strong> Fig. 2. IPSA<br />
showed a greater range <strong>of</strong> relative dwell times; some with<br />
very long dwell times <strong>and</strong> in others dwell positions are<br />
completely turned <strong>of</strong>f. In GO, none <strong>of</strong> the dwell times<br />
are completely turned <strong>of</strong>f even if the dwell position is next<br />
to a critical structure. The total dwell time <strong>of</strong> GO plans tends<br />
to be longer.<br />
Using the coverage-prioritized method, the V80-bladder<br />
ranged from 0.11–3.05 cc <strong>and</strong> 0.02–2.65 cc using GO <strong>and</strong><br />
Fig. 3. <strong>Comparison</strong> <strong>of</strong> the dose to normal structures with geometric optimization (GO) <strong>and</strong> with <strong>inverse</strong> <strong>planning</strong> <strong>simulated</strong> <strong>annealing</strong> (IPSA). With the<br />
prescription dose normalized so that at least 98% <strong>of</strong> the clinical target volume received the prescribed dose (V100 98% CTV), the dose to the bladder,<br />
rectum, <strong>and</strong> urethra is compared with the two optimization methods. The horizontal lines represent the 10 th percentile, 25 th percentile, 50 th percentile, 75 th<br />
percentile, <strong>and</strong> 90 th percentile <strong>of</strong> each set <strong>of</strong> data.
Hsu et al. / Brachytherapy 3 (2004) 147–152 151<br />
Fig. 4. <strong>Comparison</strong> <strong>of</strong> coverage <strong>of</strong> the clinical target volume with geometric optimization (GO) <strong>and</strong> with <strong>inverse</strong> <strong>planning</strong> <strong>simulated</strong> <strong>annealing</strong> (IPSA).<br />
With the prescription dose normalized such that the urethra dose is less than 150% <strong>of</strong> the prescribed dose (V150 urethra 0), coverage <strong>of</strong> the clinical<br />
target volume is compared with the two optimization methods. The horizontal lines represent the 10 th percentile, 25 th percentile, 50 th percentile, 75 th<br />
percentile, <strong>and</strong> 90 th percentile <strong>of</strong> each set <strong>of</strong> data. The open circles represent the maximum dose <strong>and</strong> the minimum dose.<br />
IPSA, respectively. There was a suggestion <strong>of</strong> a decrease in<br />
bladder dose using IPSA but it was not statistically significant<br />
(p 0.09; median: IPSA 0.62 cc, GO 1.05 cc)<br />
(Fig. 3). The V80-rectum ranged from 0.20–4.8 cc <strong>and</strong><br />
0.05–1.4 cc using GO <strong>and</strong> IPSA, respectively. IPSA’s V80rectum<br />
was significantly lower (p 0.005; median: IPSA <br />
0.38 cc, GO 1.31 cc) (Fig. 3). V150-urethra ranged from<br />
0.02–0.75 cc <strong>and</strong> 0.0–0.01 cc using GO <strong>and</strong> IPSA, respectively.<br />
The V150-urethra was significantly lower using IPSA<br />
(p 0.005; median: IPSA 0.00 cc, GO 0.33 cc) (Fig.3).<br />
These results show that IPSA can maintain target coverage<br />
while minimizing dose to normal structures. The range <strong>of</strong><br />
Fig. 5. <strong>Comparison</strong> <strong>of</strong> the homogeneity index (HI) <strong>and</strong> conformal index (COIN) with geometric optimization (GO) <strong>and</strong> with <strong>inverse</strong> <strong>planning</strong> <strong>simulated</strong><br />
<strong>annealing</strong> (IPSA). With the prescription dose normalized to the prescribed dose (V100 98% CTV), two commonly used indices (HI, COIN) were<br />
calculated for comparison.
152<br />
dose to normal structures was also narrower using IPSA.<br />
This suggests the sparing effect is more consistent <strong>and</strong> less<br />
dependent on the location <strong>of</strong> dwell positions.<br />
Using the sparing prioritized method, the V100-prostate<br />
ranged from 30–97% <strong>and</strong> 95–100% using GO <strong>and</strong> IPSA,<br />
respectively. This difference was statistically significant<br />
(p 0.008) (Fig. 4). The variation <strong>of</strong> target coverage was<br />
smaller using IPSA. This shows that IPSA minimized high<br />
dose regions inside the target volume <strong>and</strong> was able to spare the<br />
urethra while maintaining consistently good target coverage.<br />
Using the coverage-prioritized method, the calculated HI<br />
ranged from 0.39–0.51 <strong>and</strong> 0.57–0.69 using GO <strong>and</strong> IPSA,<br />
respectively. The HI was statistically higher using IPSA<br />
(p 0.005) (Fig. 5). Besides having better coverage while<br />
sparing normal structures, the total volume <strong>of</strong> the hot spot<br />
was less with IPSA.<br />
The COIN ranged from 0.54–0.76 <strong>and</strong> 0.66–0.81 using<br />
GO <strong>and</strong> IPSA, respectively. The COIN was statistically<br />
higher using IPSA (p 0.005) (Fig. 5). Higher COIN is a<br />
reflection <strong>of</strong> the combination <strong>of</strong> better target coverage <strong>and</strong><br />
less normal tissue treated outside <strong>of</strong> the target volume.<br />
Discussion<br />
We started using IPSA for CT/MR-based prostate HDR<br />
treatments in 2001. The algorithm has also been beta-tested<br />
at a different facility. Their early clinical experience with<br />
IPSA was recently reported (7, 8), <strong>and</strong> showed that after IPSA<br />
implementation their prostate implants had improved target<br />
coverage <strong>and</strong> critical organs protection compared with their<br />
GO-based techniques.<br />
This study has shown that IPSA is superior to GO for<br />
improving coverage <strong>of</strong> the prostate while minimizing the<br />
dose to normal structures. IPSA also decreased the volume<br />
<strong>of</strong> the hot spot within a target volume <strong>and</strong> dose to noncontoured<br />
normal structures outside <strong>of</strong> the implant. This was<br />
illustrated via quantitative comparisons <strong>of</strong> DVH <strong>and</strong> two<br />
dosimetric indices. IPSA accomplished this by utilizing anatomical<br />
information provided by three-dimensional <strong>planning</strong>.<br />
Data from this study supports the need to move to<br />
three-dimensional brachytherapy treatment <strong>planning</strong> <strong>and</strong> the<br />
use <strong>of</strong> anatomy-based dwell time optimization for prostate<br />
HDR brachytherapy.<br />
In this study, the two systems were compared using hypothetical<br />
plans without any manual adjustments, though this<br />
may not reflect common clinical practices. We acknowledge<br />
that better GO plans can be obtained with additional manual<br />
adjustments, <strong>and</strong> that a modified implant technique or adding<br />
a few catheters can improve results. However, manual adjustments<br />
are not always practical, <strong>and</strong> very few prostates would<br />
Hsu et al. / Brachytherapy 3 (2004) 147–152<br />
fit in <strong>geometrical</strong>ly perfect implants. Based on the magnitude<br />
<strong>of</strong> differences in dwell times <strong>and</strong> the degree <strong>of</strong> customization<br />
demonstrated by IPSA optimization (Fig. 1), we believe<br />
HDR brachytherapy should follow the example set by conformal<br />
external beam radiotherapy <strong>and</strong> intensity modulated<br />
radiotherapy <strong>and</strong> incorporate anatomy based optimization.<br />
Clinical correlation <strong>of</strong> the dosimetric advantage <strong>of</strong> IPSA<br />
with clinical outcomes needs to be demonstrated. Although<br />
the dosimetric advantages <strong>of</strong> IPSA have been shown, this<br />
may not be reflected in the clinical experience. However,<br />
IPSA has given us improved control over dosimetry <strong>of</strong><br />
our brachytherapy treatments. This improved control, combined<br />
with the collection <strong>of</strong> three-dimensional dosimetry<br />
data, may yield more accurate information regarding normal<br />
tissue tolerance <strong>and</strong> establish dose response.<br />
Conclusions<br />
Anatomy-based <strong>inverse</strong> optimization using IPSA is superior<br />
to dwell-position-based optimization using GO as it: (1)<br />
Improves target coverage <strong>and</strong> conformality while sparing<br />
normal structures, (2) Improves dose homogeneity within the<br />
target, <strong>and</strong> (3) Minimizes volume <strong>of</strong> non-contoured normal<br />
tissue irradiated. Routine application <strong>of</strong> three-dimensional<br />
brachytherapy <strong>planning</strong> <strong>and</strong> anatomy-based <strong>inverse</strong> dwell<br />
time optimization is recommended.<br />
References<br />
[1] Edmundson GK. Volume optimization: An American viewpoint. In:<br />
Mould RF, Battermann JJ, Martinez AA, et al., eds. Brachytherapy<br />
from radium to optimization. Wageningen, The Netherl<strong>and</strong>s: Nucletron<br />
International; 1994. p. 314–318.<br />
[2] Lessard E, Pouliot J. Inverse <strong>planning</strong> anatomy-based dose optimization<br />
for HDR-brachytherapy <strong>of</strong> the prostate using fast <strong>simulated</strong> <strong>annealing</strong><br />
algorithm <strong>and</strong> dedicated objective function. Med Phys 2001;28:773–<br />
779.<br />
[3] Kolkman-Deurloo IKK, Visser AG, Niël CGJH, et al. Optimization <strong>of</strong><br />
interstitial volume implants. Radiother Oncol 1994;31:229–239.<br />
[4] Edmundson GK. Geometry-based optimization for stepping source implants.<br />
In: Martinez AA, Orton CG, Mould RF, eds. Brachytherapy<br />
HDR <strong>and</strong> LDR. Columbia, MD: Nucletron; 1990. p. 184–192.<br />
[5] Wu A, Ulin K, Sternick ES. A dose homogeneity index for evaluating<br />
192 Ir interstitial breast implant. Med Phys 1988;15:104–107.<br />
[6] Baltas D, Kolotas C, Geramani K, et al. A conformal index (COIN)<br />
to evaluate implant quality <strong>and</strong> dose specification in brachytherapy.<br />
Int J Radiat Oncol Biol Phys 1998;40:515–524.<br />
[7] Lachance B, Beliveau-Nadeau D, Lessard E, et al. Early clinical experience<br />
with anatomy-based <strong>inverse</strong> <strong>planning</strong> dose optimization for highdose-rate<br />
boost <strong>of</strong> the prostate. Int J Radiat Oncol Biol Phys 2002;54:<br />
86–100.<br />
[8] Ménard C, Susil R, Choyke P, et al. MRI-guided HDR prostate brachytherapy<br />
in a st<strong>and</strong>ard 1.5T scanner. Int J Radiat Oncol Biol Phys<br />
2004;59:1414–1423.