The Racial Resegregation of Los Angeles County, 1940-2000
The Racial Resegregation of Los Angeles County, 1940-2000
The Racial Resegregation of Los Angeles County, 1940-2000

Create successful ePaper yourself
Turn your PDF publications into a flip-book with our unique Google optimized e-Paper software.
1.0 0<br />
0.90<br />
0.80<br />
0.70<br />
0.60<br />
0.50<br />
0.40<br />
0.30<br />
0.20<br />
0.10<br />
0.00<br />
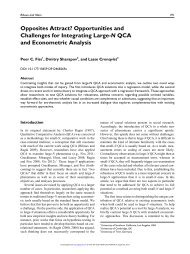
CHART 4a: WHITE NEIGHBORS<br />
Probability that Whites, Blacks, Hispanics, and Asians<br />
in <strong>Los</strong> <strong>Angeles</strong> <strong>County</strong> w ill have White Neighbors, <strong>1940</strong>-<strong>2000</strong><br />
19 4 0 19 50 19 6 0 19 70 19 8 0 19 9 0 2 0 0 0<br />
Whites with Whites 0.95 0.94 0.90 0.81 0.72 0.64 0.57<br />
Asians wit h Whites 0.77 0.63 0.57 0.53 0.49 0.39 0.23<br />
Hispanics with Whites 0.82 0.55 0.58 0.52 0.34 0.23 0.18<br />
Blacks with Whites 0.45 0.32 0.22 0.15 0.17 0.18 0.17<br />
Chart 4a, “Probability that Whites, Blacks, Hispanics, and Asians in <strong>Los</strong> <strong>Angeles</strong> <strong>County</strong> will<br />
have White Neighbors, <strong>1940</strong>-<strong>2000</strong>,” uses a much more powerful and revealing measure or<br />
segregation than the Index <strong>of</strong> Dissimilarity. <strong>The</strong> measure used in Charts 4a through 7b is the<br />
“Exposure Index,” which measures the probability that members <strong>of</strong> one group will have neighbors <strong>of</strong><br />
any other group. It ranges from 0 to 1. Unlike the relatively crude Index <strong>of</strong> Dissimilarity, the<br />
Exposure Index takes into account the relative size <strong>of</strong> different groups, and is capable <strong>of</strong> measuring<br />
the segregation conditions between multiple racial groups simultaneously. In order to make these<br />
patterns as clear as possible, we present them in pairs, each pair exploring the experience <strong>of</strong> each <strong>of</strong><br />
the four principal racial groups.<br />
Chart 4a tells us the probability that Whites, Blacks, Hispanics and Asians will have White neighbors.<br />
<strong>The</strong> probability that Whites will have white neighbors is a measure <strong>of</strong> their “isolation,” and we see<br />
here that Whites have become less and less likely to have White neighbors. On the face <strong>of</strong> it, this<br />
seems like clear evidence <strong>of</strong> desegregation. But that is not the case. Notice that all racial groups have<br />
been less and less likely to have White neighbors since <strong>1940</strong>! Indeed, Asians, Hispanics and Blacks in<br />
<strong>2000</strong> had less than a 24% chance <strong>of</strong> sharing their neighborhoods with Whites.<br />
Blacks have been no more likely to have White neighbors in all the years since 1960.<br />
Whites with Whites<br />
Asians with Whit es<br />
Hispanics with Whites<br />
Blacks with Whites<br />
<strong>The</strong> simple fact explaining the patterns in Chart 4a is that Whites are only seeming to be less<br />
isolated because they are grossly outnumbered, and some greater level <strong>of</strong> “exposure” to other<br />
racial groups is inevitable as the length <strong>of</strong> the perimeter, or circumference, around the<br />
segregated core <strong>of</strong> the metropolis continues to grow. Chart 4b will better clarify this<br />
situation.<br />
Race Contours <strong>2000</strong> –<strong>Resegregation</strong> <strong>of</strong> <strong>Los</strong> <strong>Angeles</strong> <strong>County</strong>, <strong>1940</strong>-<strong>2000</strong> 13