MicroBlaze Development Kit Tutorial - Xilinx
MicroBlaze Development Kit Tutorial - Xilinx
MicroBlaze Development Kit Tutorial - Xilinx

Create successful ePaper yourself
Turn your PDF publications into a flip-book with our unique Google optimized e-Paper software.
<strong>MicroBlaze</strong> <strong>Development</strong> <strong>Kit</strong> <strong>Tutorial</strong><br />
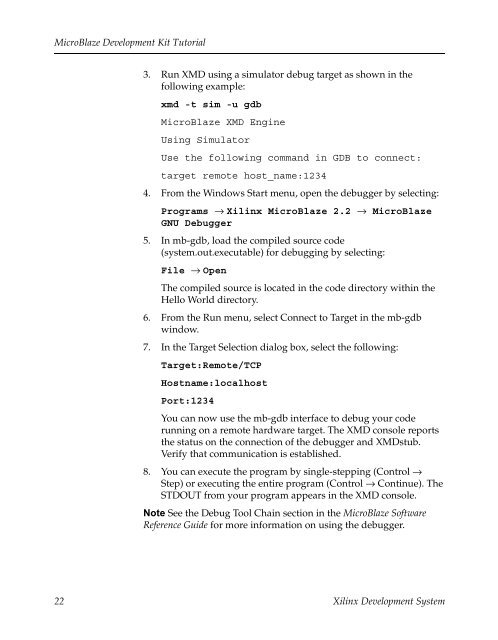
3. RunXMDusingasimulatordebugtargetasshowninthe<br />
following example:<br />
xmd -t sim -u gdb<br />
<strong>MicroBlaze</strong> XMD Engine<br />
Using Simulator<br />
Use the following command in GDB to connect:<br />
target remote host_name:1234<br />
4. From the Windows Start menu, open the debugger by selecting:<br />
Programs → <strong>Xilinx</strong> <strong>MicroBlaze</strong> 2.2 → <strong>MicroBlaze</strong><br />
GNU Debugger<br />
5. In mb-gdb, load the compiled source code<br />
(system.out.executable) for debugging by selecting:<br />
File → Open<br />
The compiled source is located in the code directory within the<br />
Hello World directory.<br />
6. From the Run menu, select Connect to Target in the mb-gdb<br />
window.<br />
7. In the Target Selection dialog box, select the following:<br />
Target:Remote/TCP<br />
Hostname:localhost<br />
Port:1234<br />
You can now use the mb-gdb interface to debug your code<br />
running on a remote hardware target. The XMD console reports<br />
the status on the connection of the debugger and XMDstub.<br />
Verify that communication is established.<br />
8. You can execute the program by single-stepping (Control →<br />
Step) or executing the entire program (Control → Continue). The<br />
STDOUT from your program appears in the XMD console.<br />
Note See the Debug Tool Chain section in the <strong>MicroBlaze</strong> Software<br />
Reference Guide for more information on using the debugger.<br />
22 <strong>Xilinx</strong> <strong>Development</strong> System