Longevity among Hunter-Gatherers: A cross-cultural examination
Longevity among Hunter-Gatherers: A cross-cultural examination
Longevity among Hunter-Gatherers: A cross-cultural examination

Create successful ePaper yourself
Turn your PDF publications into a flip-book with our unique Google optimized e-Paper software.
<strong>Longevity</strong> Among<br />
<strong>Hunter</strong>-<strong>Gatherers</strong>:<br />
A Cross-Cultural<br />
Examination<br />
MICHAEL GURVEN<br />
HILLARD KAPLAN<br />
AVERAGE WORLDWIDE HUMAN life expectancy reached 66 years in the first<br />
quinquennium of the twenty-first century, with extremes at the country<br />
level ranging from 39 years in Zambia to 82 years in Japan (United Nations<br />
2007). Average life expectancy has increased linearly at almost three months<br />
per year over the past 160 years, with improvements in sanitation, nutrition,<br />
and public health accounting for much of this change (Riley 2001; Oeppen<br />
and Vaupel 2003). As a consequence of longevity in the developed world,<br />
women currently live more than a third of their lives in a post-reproductive<br />
state following menopause.<br />
Such high survival rates almost surely had never occurred before in<br />
human history. Agriculture and pastoralism have been practiced for only<br />
about 10,000 years, and most extensively in the past 5,000 years. The genus<br />
Homo has existed for about 2 million years, and humans have lived as<br />
hunter-gatherers for the vast majority of their evolutionary history. While<br />
some important genetic changes may have occurred in populations after the<br />
advent of agriculture, the major distinctive features of our species (Wang et<br />
al. 2006), such as large brains, long lives, marriage and male investment in<br />
offspring, long child dependency on parents, and grandparental support of<br />
grandchildren, appear to have evolved during our preagri<strong>cultural</strong> history<br />
(see Kaplan 1997 for reviews; Kaplan et al. 2000, 2001). Despite recent improvements<br />
in human survivorship, it is likely that the age-specific mortality<br />
pattern and the timing and pace of development and senescence evolved<br />
during our hunter-gatherer past as well.<br />
The purpose of this article is to assess the evolved human mortality<br />
profile and particularly the pattern of senescent mortality change with age.<br />
We address five questions:<br />
P O P U L A T I O N A N D D E V E L O P M E N T R E V I E W 3 3 ( 2 ) : 3 2 1 – 3 6 5 ( J U N E 2 0 0 7 ) 3 2 1<br />
PDR 33.2 Gurven-Kaplan-FINAL.indd 321 5/22/07 2:16:33 PM
3 2 2 L O N G E V I T Y A M O N G H U N T E R - G A T H E R E R S<br />
1) Is there a characteristic shape to the human mortality profile, as it<br />
decreases first during childhood and then increases with aging?<br />
2) How robust is the occurrence of a post-reproductive life span, and<br />
how likely is it that older adults were alive and available in human populations?<br />
3) Is there a characteristic modal age at death for adults, and what can<br />
this mode tell us about aging and the evolution of the human life span?<br />
4) How variable is this mortality profile <strong>among</strong> populations, and what<br />
factors shape any variation?<br />
5) How do the mortality patterns of modern hunter-gatherers compare<br />
with estimates of the mortality profiles of both chimpanzees, our closest<br />
living primate relative, and prehistoric populations derived from funerary<br />
samples, and what implications can be derived from those comparisons?<br />
Our approach is to assess and analyze available demographic data on<br />
extant hunter-gatherers and forager-horti<strong>cultural</strong>ists (i.e., peoples who mix<br />
hunting and gathering with swidden agriculture). To understand the processes<br />
that shaped the evolution of our life course, it would be useful to have<br />
data on mortality and fertility a<strong>cross</strong> populations and over evolutionary time.<br />
Because these data do not exist, we critically evaluate data on modern groups<br />
as one lens into our past, however imperfect.<br />
Our conclusion is that there is a characteristic life span for our species,<br />
in which mortality decreases sharply from infancy through childhood,<br />
followed by a period in which mortality rates remain essentially constant to<br />
about age 40 years, after which mortality rises steadily in Gompertz fashion.<br />
The modal age of adult death is about seven decades, before which time<br />
humans remain vigorous producers, and after which senescence rapidly<br />
occurs and people die. We hypothesize that human bodies are designed to<br />
function well for about seven decades in the environment in which our species<br />
evolved. Mortality rates differ <strong>among</strong> populations and <strong>among</strong> periods,<br />
especially in risks of violent death. However, those differences are small in a<br />
comparative <strong>cross</strong>-species perspective, and the similarity in mortality profiles<br />
of traditional peoples living in varying environments is impressive.<br />
After publishing their life table for Yanomamo Amerindians of Venezuela<br />
30 years ago, Neel and Weiss (1975) made an “appeal to anthropologists…to<br />
produce comparable bodies of [demographic] data.” This is<br />
our attempt to synthesize the best information about mortality in relatively<br />
isolated, small-scale foraging-based populations. The sample of groups used<br />
in this analysis is larger than in any other previous study (e.g., Kaplan et al.<br />
2000; Kennedy 2003; Pennington 2001; Gage 1998). This is our best opportunity<br />
to examine the mortality structure of humans living a lifestyle most<br />
similar to the lifestyles of our foraging ancestors. These populations are acculturating<br />
at a rapid rate, thus future data are unlikely to be forthcoming.<br />
For example, 33 of 105 isolated indigenous groups in Brazil became extinct<br />
between 1900 and 1957, and only 33 groups remain isolated (Ribeiro 1967:<br />
PDR 33.2 Gurven-Kaplan-FINAL.indd 322 5/22/07 2:16:34 PM
M I C H A E L G U R V E N / H I L L A R D K A P L A N 3 2 3<br />
92). There are few extant groups of human hunter-gatherers, and probably<br />
no large group for which detailed demographic information on people of all<br />
ages is available. The few groups that exist are relatively small, disrupted by<br />
infectious disease and interactions with miners, colonists, or other nationals.<br />
It is therefore unlikely that more than a few new societies will be added to<br />
the sample presented in this article.<br />
Methodology<br />
Our approach is to assess the mortality profiles of all extant hunter-gatherers<br />
for which sufficient high-quality demographic data exist. Table 1 provides the<br />
study years, time period covered, sample sizes of individuals, total person-years<br />
and person-years for individuals aged 50 and older, and sources of the data.<br />
The societies in the sample are described in Appendix 1. We include in our<br />
data set small-scale populations that also engage in slash and burn horticulture<br />
because these groups share similar characteristics with modern foraging<br />
populations. Whereas forager-horti<strong>cultural</strong>ists have engaged in horticulture for<br />
many generations, groups in our acculturated hunter-gatherer category have<br />
either recently started horticulture and/or have been exposed to medicines,<br />
markets, and other modern amenities. All groups in our ethnographic sample<br />
of hunter-gatherers have had minimal or no exposure to modern medicine, and<br />
minimal or no inclusion of products of horticulture or market-derived foods<br />
in their diet. Other traits commonly associated with a foraging lifestyle vary<br />
<strong>among</strong> hunter-gatherer groups, such as mobility, an egalitarian ethic, widespread<br />
sharing, minimal storage, and other social traits (Kelly 1995). The designation<br />
of high-quality data means that age estimation is reasonably accurate<br />
and there is no systematic bias in the underreporting of deaths. Most importantly,<br />
survivorship and mortality profiles for these populations are based on<br />
actual deaths from prospective or retrospective studies, and not on model life<br />
tables fitted to scanty data or census data. These profiles therefore make no<br />
assumptions about stable or stationary populations, which can bias estimates<br />
of adult mortality. Stable population theory requires that mortality and fertility<br />
schedules remain constant over long periods of time, while stationary distributions<br />
additionally require zero population growth. If a population is actually<br />
growing, and stationarity is instead assumed, the death rate is usually overestimated<br />
(see Pennington 1996). Additional criteria, borrowed from Early and<br />
Peters (2000: 71), require that demographic data collection was an objective<br />
of research and that data were subject to rigorous error-checking.<br />
Although this sample is the most complete set of preindustrial populations<br />
available, data limitations make it necessary to rely upon subsets of the<br />
populations for specific analyses. For example, the Agta and Warao demographies<br />
lack sufficient age resolution at later ages for us to trust mortality<br />
profiles after the age of 45 or 50 years. Age estimates for older adults <strong>among</strong><br />
the Gainj are unreliable, with no age categories beyond age 60. Data on older<br />
PDR 33.2 Gurven-Kaplan-FINAL.indd 323 5/22/07 2:16:34 PM
TABLE 1 Sample of study populations<br />
Years Years No. of in- Person- No. of Person-years Age Data Data<br />
Group Type studied covered dividuals years deaths over age 50 intervals collection source<br />
<strong>Hunter</strong>-gatherers<br />
!Kung HG 1963–74 1963–74 500 1,767 96
M I C H A E L G U R V E N / H I L L A R D K A P L A N 3 2 5<br />
adults are sparse <strong>among</strong> Machiguenga. The Aborigine data may suffer from<br />
underreporting of infant deaths. The highest-quality data a<strong>cross</strong> the entire life<br />
span exist for Hadza, Ache, !Kung, Hiwi, Tsimane, and Yanomamo Xilixana.<br />
These populations are used in focused analyses of mortality at older ages.<br />
To illustrate patterns of mortality, we present age-specific survivorship<br />
curves, l(x), and log mortality hazard rates, lnh x . We model each group’s<br />
mortality using a Siler competing hazard model, chosen for its simplicity,<br />
robustness, and the interpretability of its parameters (Siler 1979; Gage 1989,<br />
1991; but see Wood et al. 2002). The Siler model includes three components<br />
of mortality: declining mortality from birth through childhood, a constant<br />
mortality hazard a<strong>cross</strong> the life span, and an increasing component in older<br />
ages. Infant and child mortality are thus modeled with a negative Gompertz<br />
function. The final component is the familiar Gompertz exponential, and the<br />
constant term is the Makeham (1860) addition of age-independent mortality.<br />
Our use of the Gompertz function is based on convenience and tradition.<br />
Gompertz is not derived from first biological principles, although different<br />
explanations have been proposed to produce Gompertz-like mortality (Olshansky<br />
and Carnes 1997; Gavrilov and Gavrilova 2001). Other survival<br />
models that show monotonically increasing mortality rates over time, such as<br />
Weibull and Gamma, often explain data as accurately as Gompertz (Ricklefs<br />
and Scheuerlein 2002; Wood et al. 1994).<br />
The Siler hazard has the following functional form:<br />
h( x) = a exp( − b x) + a + a exp( b x)<br />
1 1 2 3 3 (1)<br />
This is a five-parameter model. The parameter a 1 describes the initial infant<br />
mortality rate, and b 1 describes the rate of mortality decline. The proportion<br />
of deaths due to juvenile mortality is captured by the first component as<br />
exp(–a 1 /b 1 ). The parameter a 2 describes age-independent mortality, which is<br />
usually interpreted as exogenous mortality due to environmental conditions.<br />
The parameter a 3 is the initial adult mortality rate, and b 3 describes the rate of<br />
mortality increase. Because the survivorship, l(x), is equal to the product of<br />
the three survivorship components, the formula for survivorship at age x is:<br />
⎛ a<br />
⎞<br />
⎛ a<br />
⎞<br />
1<br />
3<br />
l( x)<br />
= exp ⎜ − ( 1− exp( b x)) exp( a x)<br />
e<br />
⎝ b<br />
⎟ ⋅ − ⋅ xp ( exp( b x))<br />
1 2 ⎜ 1− 3<br />
⎠<br />
⎝ b<br />
⎟<br />
⎠<br />
1<br />
We estimate Siler parameters based on fits of (1) to the h(x) values. In view of<br />
the discrete nature of the age intervals, we assign the ages for the Siler model<br />
to the midpoint between two successive age intervals. All estimation is done<br />
using weighted nonlinear regression (PROC NONLIN) with SAS version 9.1,<br />
where weights are assigned according to the number of age-specific risk years<br />
for each population. Regression of log mortality hazards on age by population<br />
is done using the generalized linear model (GLM) procedure in SAS.<br />
PDR 33.2 Gurven-Kaplan-FINAL.indd 325 5/22/07 2:16:36 PM<br />
3<br />
(2)
3 2 6 L O N G E V I T Y A M O N G H U N T E R - G A T H E R E R S<br />
Results<br />
Survivorship, mortality hazards, and<br />
post-reproductive life<br />
Table 2 presents the results of modeling mortality hazards with the Siler<br />
model, and Figures 1 and 2 show the age-specific survivorship (l x ) and the<br />
log mortality hazard (lnh x ) curves, based on the life tables derived from the<br />
raw data. The results are presented for five hunter-gatherer, four foragerhorti<strong>cultural</strong>ist,<br />
and five acculturated hunter-gatherer populations. In the<br />
table and in panel D of both figures, we compare the averages a<strong>cross</strong> groups<br />
with data from chimpanzees (Hill et al. 2001) and from eighteenth-century<br />
Sweden. The estimated survival curves from the Siler models (not shown)<br />
are very close to those generated from the life tables in Figure 1.<br />
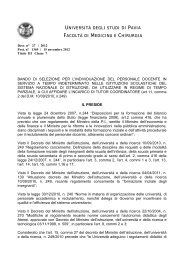
In Table 2, we see that on average 57 percent, 64 percent, and 67 percent<br />
of children born survive to age 15 years <strong>among</strong> hunter-gatherers, foragerhorti<strong>cultural</strong>ists,<br />
and acculturated hunter-gatherers. Of those who reach<br />
age 15, 64 percent of traditional hunter-gatherers and 61 percent of foragerhorti<strong>cultural</strong>ists<br />
reach age 45. The acculturated hunter-gatherers show lower<br />
young adult mortality rates, with 79 percent surviving to age 45, conditional<br />
on reaching age 15.<br />
All groups show evidence of significant post-reproductive life <strong>among</strong><br />
women. Mean number of expected years of life, conditional on reaching age<br />
45, is about two decades (20.7, 19.8, and 24.6 for hunter-gatherers, foragerhorti<strong>cultural</strong>ists,<br />
and acculturated hunter-gatherers). Traditional huntergatherers<br />
and forager-horti<strong>cultural</strong>ists are almost identical in the adult life<br />
course, and, on average, acculturation improves adult life expectancy.<br />
There is some variability <strong>among</strong> groups. Among traditional huntergatherers,<br />
the average life expectancy at birth (e 0 ) varies from 21 to 37 years,<br />
the proportion surviving to age 45 varies between 26 percent and 43 percent,<br />
and life expectancy at age 45 varies from 14 to 24 years (Figure 1; Table 2 and<br />
Figure 3). Ache show higher infant and child survivorship than the other<br />
groups, and Agta mortality is high at all ages. These patterns are verified in<br />
the parameter estimates of the Siler model (Table 2). Initial immature mortality<br />
(a 1 ) for the Ache is about half that of other foragers, while for the Agta<br />
it is two to three times greater. 1<br />
Forager-horti<strong>cultural</strong>ists also vary significantly in infant mortality,<br />
with a threefold difference between Neel and Weiss’s Yanomamo sample<br />
and the Tsimane. Survival to age 45 varies between 19 and 54 percent, and<br />
those aged 45 live an average of 12–24 additional years. The Tsimane show<br />
earlier accelerations in adult mortality than the Yanomamo and the forager<br />
populations. The raw and simulated Gainj population shows earlier mortality<br />
accelerations, although the raw data do not permit a strong inference about<br />
ages greater than 55.<br />
PDR 33.2 Gurven-Kaplan-FINAL.indd 326 5/22/07 2:16:36 PM
TABLE 2 Parameter estimates of the Siler mortality model<br />
MRDT<br />
95 percent C.I. 95 percent C.I.<br />
Population a b a a b Lower Upper MRDT Lower Upper l l e e 1 1 2 3 3 15 45 15 45<br />
Hadza (e =34) 0.351 0.895 0.011 6.70E-06 0.125 0.078 0.173 5.5 4.0 8.9 0.57 0.40 42.5 24.2<br />
0<br />
Ache forest (e =37) 0.157 0.721 0.013 4.80E-05 0.103 0.048 0.158 6.7 4.4 14.6 0.66 0.43 38.5 21.1<br />
0<br />
Hiwi (e =27) 0.458 1.390 0.020 6.32E-09 0.251 0.127 0.374 2.8 1.9 5.4 0.53 0.29 32.2 17.9<br />
0<br />
!Kung (e =36) 0.340 0.913 0.010 3.31E-04 0.077 0.045 0.110 9.0 6.3 15.6 0.59 0.39 38.1 19.7<br />
0<br />
Agta (e =21) 0.961 1.506 N/A 7.57E-03 0.040 0.016 0.063 17.5 10.9 44.1 0.45 0.26 28.6 13.7<br />
0<br />
Average huntergatherer<br />
0.422 1.131 0.013 1.47E-04 0.086 0.051 0.174 8.1 4.0 13.6 0.57 0.36 37.7 20.7<br />
Yanomamo Mucaj (e =39) 0.624 3.058 0.011 9.60E-05 0.086 0.039 0.134 8.0 5.2 17.9 0.69 0.47 41.3 23.5<br />
0<br />
Yanomamo (e =21) 0.752 1.663 0.024 1.82E-04 0.086 0.056 0.117 8.0 5.9 12.4 0.44 0.19 28.3 16.8<br />
0<br />
Tsimane (e =42) 0.221 1.193 0.009 2.30E-05 0.119 0.084 0.155 5.8 4.5 8.3 0.73 0.54 41.6 20.6<br />
0<br />
Machiguenga 0.367 1.471 0.016 N/A N/A N/A N/A N/A N/A N/A 0.62 0.39 N/A N/A<br />
Gainj (e =30) 0.277 0.917 0.002 3.18E-03 0.059 0.045 0.073 11.8 9.5 15.5 0.67 0.33 29.6 11.9<br />
0<br />
Average foragerhorti<strong>cultural</strong>ist<br />
0.418 1.657 0.012 3.65E-04 0.074 0.024 0.181 9.4 3.8 28.9 0.64 0.39 36.4 19.8<br />
!Kung 1963–74 (e =50) 0.282 1.089 0.001 3.06E-04 0.073 0.034 0.111 9.5 6.3 20.1 0.76 0.67 50.9 25.2<br />
0<br />
Ache reservation (e =50) 0.248 0.985 0.003 6.20E-05 0.092 0.003 0.180 7.6 3.9 219.4 0.74 0.64 52.0 27.2<br />
0<br />
Northern Territory<br />
Aborigines (e =49) 0.242 1.031 0.000 7.13E-04 0.063 0.056 0.070 11.0 9.9 12.4 0.77 0.65 47.6 23.1<br />
0<br />
Hiwi post-1960 (e =28) 0.478 0.828 0.011 4.30E-05 0.098 –0.075 0.272 7.1 2.6 N/A 0.48 0.33 41.9 23.8<br />
0<br />
Agta transition (e =28) 0.404 0.848 0.012 1.01E-07 0.230 0.112 0.349 3.0 2.0 6.2 0.52 0.37 35.7 14.8<br />
0<br />
Agta peasant (e =21) 0.405 0.587 0.004 2.98E-03 0.056 0.010 0.102 12.4 6.8 72.1 0.44 0.25 30.6 13.4<br />
0<br />
Average acculturated HG 0.248 0.816 0.006 1.78E-04 0.079 0.048 0.104 8.8 6.7 14.4 0.67 0.53 46.4 24.6<br />
Sweden 1751–59 (e =34) 0.400 1.074 0.008 2.01E-04 0.083 0.078 0.087 8.3 7.9 8.9 0.60 0.43 40.0 20.0<br />
0<br />
Overall human average 0.309 1.138 0.009 1.31E-04 0.090 0.052 0.128 7.7 5.4 13.4 0.66 0.47 40.3 20.8<br />
Wild chimpanzees (e =13) 0.248 0.608 0.028 7.53E-03 0.063 –0.037 0.162 11.0 4.3 N/A 0.37 0.03 14.0 5.0<br />
0<br />
Captive chimpanzees (e =26) 0.389 2.465 0.017 9.96E-04 0.094 0.086 0.102 7.4 6.8 8.1 0.64 0.20 22.3 7.2<br />
0<br />
PDR 33.2 Gurven-Kaplan-FINAL.indd 327 5/22/07 2:16:37 PM<br />
MRDT=mortality rate doubling time in years, defined as ln2/b 3 . Groups in italics refer to data of questionable quality (see text for details).
FIGURE 1 Survivorship (l ) for (a) hunter-gatherers, (b) forager-hori<strong>cultural</strong>ists, and (c) acculturated hunter-<br />
x<br />
gatherers using the Siler competing hazards model to estimate mortality. Panel (d) illustrates average l for each of<br />
x<br />
b) Forager-horti<strong>cultural</strong>ists<br />
these group sets and compares l from wild chimpanzees and from Sweden, 1751–59<br />
x<br />
1.0<br />
1.0<br />
0.9<br />
a) <strong>Hunter</strong>-gatherers<br />
0.9<br />
0.8<br />
0.8<br />
Yanomamo Mucaj<br />
0.7<br />
!Kung<br />
Ache<br />
0.7<br />
0.6<br />
0.6<br />
Tsimane<br />
0.5<br />
Agta<br />
0.5<br />
0.4<br />
0.4<br />
Yanomamo<br />
0.3<br />
Proportion surviving<br />
Hadza<br />
0.3<br />
Gainj<br />
Hiwi<br />
Proportion surviving<br />
0.2<br />
0.2<br />
0.1<br />
0.1<br />
0.0<br />
1.0<br />
0.0<br />
1.0<br />
0.9<br />
c) Acculturated hunter-gatherers<br />
N. Terr. aborigines<br />
0.9<br />
0.8<br />
0.8<br />
Ache (settled)<br />
0.7<br />
0.7<br />
!Kung1963–74<br />
0.6<br />
0.6<br />
0.5<br />
Agta (trans) <strong>Hunter</strong>-gatherers<br />
0.4<br />
0.5<br />
0.4<br />
Agta (peasant)<br />
0.3<br />
Proportion surviving<br />
0.3<br />
Proportion surviving<br />
PDR 33.2 Gurven-Kaplan-FINAL.indd 328 5/22/07 2:16:38 PM<br />
d) Average survivorship<br />
Forager-horti<strong>cultural</strong>ists<br />
Acculturated hunter-gatherers<br />
Sweden 1751–59<br />
Wild chimpanzees<br />
approximated<br />
0.2<br />
0.2<br />
0.1<br />
Hiwi post-1960<br />
0.1<br />
0.0<br />
0.0<br />
0 5 10 15 20 25 30 35 40 45 50 55 60 65 70 75 80<br />
Age<br />
0 5 10 15 20 25 30 35 40 45 50 55 60 65 70 75 80<br />
Age
)) for (a) hunter-gatherers, (b) forager-hori<strong>cultural</strong>ists, and<br />
x<br />
(c) acculturated hunter-gatherers , and (d) same group averages from Figure 1.<br />
0.0<br />
0.0<br />
b) Forager-horti<strong>cultural</strong>ists<br />
a) <strong>Hunter</strong>-gatherers<br />
–1.0<br />
–1.0<br />
Tsimane<br />
–2.0<br />
Hiwi<br />
Ache<br />
–2.0<br />
Gainj<br />
!Kung<br />
–3.0<br />
–3.0<br />
Yanomamo<br />
Hadza<br />
Yanomamo Xilixana<br />
–4.0<br />
Log mortality hazard<br />
–4.0<br />
–5.0<br />
–5.0<br />
Agta<br />
–6.0<br />
0.0<br />
–6.0<br />
0.0<br />
c) Acculturated hunter-gatherers<br />
–1.0<br />
–1.0<br />
Log mortality hazard FIGURE 2 Log mortality hazards (ln(h<br />
Nor. Terr. aborigines<br />
–2.0<br />
–2.0<br />
–3.0<br />
–3.0<br />
Agta (peas)<br />
Warao<br />
–4.0<br />
–4.0<br />
Log mortality hazard<br />
–5.0<br />
Log mortality hazard<br />
PDR 33.2 Gurven-Kaplan-FINAL.indd 329 5/22/07 2:16:39 PM<br />
d) Average log hazards<br />
Agta (trans)<br />
Wild chimpanzees<br />
Forager-horti<strong>cultural</strong>ists<br />
Sweden 1751–59<br />
<strong>Hunter</strong>-gatherers<br />
!Kung1963–74<br />
–5.0<br />
Acculturated hunter-gatherers<br />
–6.0<br />
Ache (settled)<br />
–6.0<br />
–7.0<br />
0 5 10 15 20 25 30 35 40 45 50 55 60 65 70 75 80<br />
Age<br />
0 5 10 15 20 25 30 35 40 45 50 55 60 65 70 75 80<br />
Age<br />
NOTE: All estimates are based on raw data clumped into 5-year age groups.
3 3 0 L O N G E V I T Y A M O N G H U N T E R - G A T H E R E R S<br />
Acculturated foragers vary most in their likelihood of reaching age 45<br />
(ranging from 26 percent <strong>among</strong> the peasant Agta population to about 67<br />
percent <strong>among</strong> sedentary !Kung, Aborigines, and Ache), but show a range<br />
of 13–27 additional years of life upon reaching age 45, similar to the range<br />
for less acculturated foragers and forager-horti<strong>cultural</strong>ists. Adult mortality<br />
is also highly variable. For example, life expectancy at age 15 is 48 years for<br />
Aborigines, 52 and 51 for settled Ache and !Kung, yet 31 and 36 for peasant<br />
and transitional Agta. Hiwi show similarly low life expectancy. The acculturated<br />
category shows a range of mortality experiences associated with<br />
acculturation.<br />
The rate at which mortality rates double is a measure of the senescence<br />
rate. Finch et al. (1990) report mortality rate doubling times (MRDTs) of 7–8<br />
years for a variety of recent human populations with a wide range in overall<br />
mortality. 2 Despite the overall high mortality of hunter-gatherer populations,<br />
we find that the adult mortality rate also doubles in 7 years <strong>among</strong> Ache and<br />
9 years <strong>among</strong> !Kung (Table 2). Hadza MRDT of 6 years is just outside the<br />
reported range of other human populations. The Hiwi MRDT shows rapid<br />
senescence (2.8 years). Among the Agta, where high adult mortality is placed<br />
in the a 3 rather than a 2 , senescence appears very slow for the forager and<br />
peasant samples (MRDT=18, 12).<br />
Several forager-horti<strong>cultural</strong>ists and acculturated foragers show a similar<br />
MRDT of 8 years, including two Yanomamo samples and settled Ache. The<br />
sample of forager-horti<strong>cultural</strong>ists shows MRDTs within the range of 6–12<br />
years. The acculturated foragers show a MRDT range of 7–11 years. Only the<br />
two acculturated Agta samples deviate from this range. The highest-quality<br />
data mostly show a MRDT range of 6–10 years for our study groups (Table 2,<br />
groups not in italics). Combining all groups within each of the three subcategories<br />
in the same Siler model, we find a more restricted range for MRDT<br />
of 8–9 years (Table 2).<br />
Among groups, differences in early juvenile mortality largely explain<br />
the differences in overall mortality. Infant and child mortality varies widely<br />
<strong>among</strong> small-scale traditional populations. Indeed, a linear regression of e 1<br />
on the infant mortality rate using the full sample of populations shows that<br />
56 percent of the variation in e 1 is explained by differences in IMR. IMR<br />
also predicts 52 percent of the variation in age-independent mortality, a 2 .<br />
The largest departure from mortality hazards at later ages appears <strong>among</strong><br />
the Agta, whose mortality data we earlier described as being circumspect<br />
at later ages.<br />
In spite of this variation, a clear premodern human pattern emerges.<br />
Age profiles of mortality risk over the life span are remarkably similar. The<br />
mortality hazard has slowed to 0.01 by age 10, doubled to about 0.02 by age<br />
40, doubled yet again before age 60, and again by age 70. Low mortality therefore<br />
persists until about age 40, when mortality acceleration becomes evident.<br />
PDR 33.2 Gurven-Kaplan-FINAL.indd 330 5/22/07 2:16:39 PM
M I C H A E L G U R V E N / H I L L A R D K A P L A N 3 3 1<br />
The adult mortality rate doubles every 7–10 years. The results obtained from<br />
these groups are similar to those from Sweden in 1751 (see panel d in Figures<br />
1 and 2), where mean life expectancy was 34 years and e 45 was an additional<br />
20 years (Berkeley Mortality Database). For groups living without access to<br />
modern health care, public sanitation, immunizations, or adequate and predictable<br />
food supply, it seems that still at least one-fourth of the population<br />
is likely to live as grandparents for 15–20 years.<br />
Figure 3 shows expected future years of life remaining (e x ), conditional<br />
on living to each age, for the human groups with the most reliable data and<br />
for wild and captive chimpanzees. While there is significant variation a<strong>cross</strong><br />
human groups in life expectancy at early ages, there is significant convergence<br />
after about age 30. With the exception of the Hiwi, who have over 10<br />
fewer years remaining during early ages and over 5 fewer years remaining<br />
during adulthood, and of the Hadza, whose life expectancy at each age is<br />
about 2 years longer than the rest at most adult ages, all other groups, including<br />
eighteenth-century Sweden, are hardly distinguishable from one<br />
another. Figure 3 also shows that at age 40, the expected age at death is<br />
about 63–66 (i.e., 23–26 additional expected years of life), whereas by age<br />
65, expected age at death is only about 70–76 years of age. By age 65, death<br />
rates become very high.<br />
Chimpanzees show a very different life course, with higher mortality<br />
and lower age-specific survival, especially during adulthood. While chimpanzee<br />
MRDT values are similar to those of human foragers, the onset of mortality<br />
rate doubling occurs at least ten years earlier <strong>among</strong> chimpanzees.<br />
It is of interest to note how the protected environment of captivity affects<br />
chimpanzee mortality profiles (Dyke et al. 1995). Captivity raises infant<br />
and juvenile survival greatly, from 37 percent surviving to age 15 in the wild<br />
to 64 percent in captivity, with the latter being similar to the human averages.<br />
However, while the proportion surviving to age 45 increases sevenfold,<br />
from 3 percent in the wild to 20 percent with captivity, it is still just half as<br />
high as for humans living in premodern conditions. The difference between<br />
chimpanzees and humans after age 45 is even greater, with an expected additional<br />
life span for chimpanzees in captivity of only 7 years, about a third<br />
of the human expectation. It appears that chimpanzees age much faster than<br />
humans and die earlier, even in protected environments.<br />
Nonlinearity in rates of senescence<br />
Senescence is usually defined as an increase in the endogenous rate of mortality<br />
(Finch, Pike, and Whitten 1990; Rose 1991). In many populations mortality<br />
reaches its minimum at reproductive maturity and increases thereafter at<br />
a constant proportional (Gompertz) rate, although noticeable decreases in<br />
vital functions do not occur until at least age 30 (Shock 1981; Weale 2004).<br />
PDR 33.2 Gurven-Kaplan-FINAL.indd 331 5/22/07 2:16:39 PM
3 3 2 L O N G E V I T Y A M O N G H U N T E R - G A T H E R E R S<br />
FIGURE 3 Age-specific life expectancy: Expected number of years<br />
remaining for six sample populations with sufficient data quality<br />
and Sweden, 1751–59<br />
50<br />
Life expectancy at age x<br />
45<br />
40<br />
35<br />
30<br />
X<br />
X<br />
XXXX XXXXXXXXXXXXXXXXXXXXXXXXXXXXXXXXXXXXXXXXXXXXXXXXXXXXXXXXXXXXXXXXXXXXXXXXXXX<br />
É<br />
É<br />
ÉÉÉÉÉÉÉÉÉÉÉÉÉÉÉÉÉÉÉÉÉÉÉÉÉÉÉÉÉÉÉÉÉÉÉÉÉÉÉÉÉÉÉÉÉÉÉÉÉÉÉÉÉÉÉÉÉÉ<br />
25<br />
20<br />
15<br />
10<br />
5<br />
É<br />
0<br />
0 5 10 15 20 25 30 35 40<br />
Age<br />
45 50 55 60 65 70 75 80<br />
!Kung e 0 =36<br />
Hadza e 0 =34<br />
Hiwi e 0 =27<br />
Ache e 0 =37<br />
Tsimane e 0 =42<br />
NOTE: Curves are based on life-table estimtes using the Siler model.<br />
Yanomamo e 0 =40<br />
Sweden 1751–59 e 0 =34<br />
XXXX XXXX X Prehistoric e0 =20<br />
ÉÉÉÉÉ ÉÉÉÉÉ É Wild chimps e0 =13<br />
The demographic literature often varies on the starting point for expected<br />
mortality increases in the Gompertz relationship (for examples see Olshansky<br />
and Carnes 1997). Here we examine whether traditional human populations<br />
reveal a constant proportional increase in mortality rates. Our goal is to determine<br />
whether an extended period of non-senescence during adulthood<br />
plays a role in the exceptional longevity of our species.<br />
We do so in two ways. First, we disaggregate the regression of log mortality<br />
rate on age into two components, age 15–40 and age 40+. The results<br />
are shown in Table 3. For most populations, especially <strong>among</strong> those with the<br />
most reliable data (marked in bold), we find strong evidence of departure<br />
from linearity. The slope of mortality increase is greater after age 40 than<br />
before that age. Among the Hiwi and Hadza, mortality rates actually decline<br />
from age 15 until about 35. The remaining groups show very little increase<br />
in mortality rates, ranging from about 1 percent a year <strong>among</strong> the Ache,<br />
PDR 33.2 Gurven-Kaplan-FINAL.indd 332 5/22/07 2:16:40 PM
M I C H A E L G U R V E N / H I L L A R D K A P L A N 3 3 3<br />
TABLE 3 Model of log mortality hazard lnh(x) by age<br />
Age 15–40 Age 40+<br />
Group ´α p exp(β) R2 MRDT ´α p exp(β) R2 MRDT<br />
Ache 0.0006 0.0113 0.00 1,216.0 0.0564 ** 0.0150 0.91 12.3<br />
Hiwi –0.0157 0.0238 0.30 0.0812 * 0.0137 0.72 8.5<br />
Hadza –0.0010 0.0081 0.00 0.0621 ** 0.0105 0.89 11.2<br />
!Kung 0.0423 * 0.0076 0.85 16.4 0.0696 ** 0.0106 0.68 10.0<br />
Agta ‡ Average hunter-<br />
0.0834 * 0.0064 0.80 5.4 0.0330 # 0.0376 0.61 21.0<br />
gatherer<br />
Yanomamo-<br />
0.0219 0.0115 31.7 0.0604 0.0175 11.5<br />
Mucaj 0.0065 0.0125 0.12 106.0 0.0535 *** 0.0112 0.96 13.0<br />
Tsimane 0.0136 0.0088 0.50 51.1 0.0856 *** 0.0097 0.92 8.1<br />
Yanomamo ‡ 0.0052 0.0301 0.99 134.1 0.0487 *** 0.0263 0.92 14.2<br />
Gainj ‡ Average forager-<br />
0.0499 ** 0.0111 0.91 13.9 0.0535 *** 0.0422 0.99 13.0<br />
horti<strong>cultural</strong>ist 0.0188 0.0156 36.9 0.0603 0.0224 11.5<br />
!Kung 1963–74 0.0805 + 0.0011 0.91 8.6 0.0882 ** 0.0044 0.80 7.9<br />
Ache reservation<br />
Northern Territory<br />
0.0212 0.0018 0.13 32.7 0.0672 *** 0.0098 0.99 10.3<br />
Aborigines 0.0301 * 0.0037 0.86 23.1 0.0610 ** 0.0038 0.87 11.4<br />
Agta transition 0.0490 * 0.0065 0.75 14.1 0.1110 * 0.0112 0.82 6.2<br />
Agta peasant ‡ 0.0844 * 0.0050 0.86 8.2 0.0463 ** 0.0340 0.91 15.0<br />
Warao<br />
Average<br />
0.0055 0.0119 0.09 126.3 N/A<br />
acculturated HG 0.0451 0.0050 15.4 0.0747 0.0126 9.3<br />
Overall average 0.0304 0.0100 22.8 0.0655 0.0172 10.6<br />
***p
3 3 4 L O N G E V I T Y A M O N G H U N T E R - G A T H E R E R S<br />
FIGURE 4 Modal ages of adult death<br />
f(x)<br />
0.040<br />
0.035<br />
0.030<br />
0.025<br />
0.020<br />
0.015<br />
0.010<br />
0.005<br />
<strong>Hunter</strong>-gatherers<br />
Acculturated hunter-gatherers<br />
Sweden 1751–59<br />
United States 2002<br />
Forager-horti<strong>cultural</strong>ists<br />
0.000<br />
15 25 35 45 55<br />
Age<br />
65 75 85 95<br />
NOTE: Frequency distribution of ages at death f(x) for individuals over age 15 shows strong peaks for huntergatherers,<br />
forager-horti<strong>cultural</strong>ists, acculturated hunter-gatherers, Sweden 1751–79, and the United States<br />
2002 (both sexes). All curves except for Sweden and the United States are smoothed using Siler estimates.<br />
4 shows the frequency distribution, f(x), of deaths at age x, conditional upon<br />
surviving to age 15, for our composite categories of hunter-gatherers, foragerhorti<strong>cultural</strong>ists,<br />
and acculturated hunter-gatherers using all populations with<br />
high data quality and age specificity. All curves (except those for Sweden and<br />
the United States) are based on Siler models. Data from historic Sweden and<br />
contemporary United States are shown for comparative purposes. The sample<br />
of premodern populations shows an average modal adult life span of about<br />
72 years, with a range of 68–78 years (Table 4).<br />
While modal age at death is not the same as the effective end of the life<br />
span, because modal age refers to a peak in the distribution of deaths, it may<br />
reflect an important stage in physiological decline. While there is significant<br />
individual variation in rates of aging, the modal age at death may be the age<br />
at which most people experience sufficient physical decline such that if they<br />
do not die from one cause, they soon die from another. This is consistent<br />
with our anecdotal impressions of frailty and work in these societies. While<br />
many individuals remain healthy and vigorous workers through their 60s,<br />
few are in good health and capable of significant work in their 70s, and it is<br />
the rare individual who survives to age 80.<br />
Settled Ache show a modal age at adult death that is 7 years greater<br />
than that of pre-contact Ache, consistent with their improved conditions after<br />
PDR 33.2 Gurven-Kaplan-FINAL.indd 334 5/22/07 2:16:42 PM
M I C H A E L G U R V E N / H I L L A R D K A P L A N 3 3 5<br />
TABLE 4 Modal ages at death<br />
Percent of Percent of<br />
Modal age Standard adult deaths adult deaths at<br />
Population at death deviation at mode year and above mode<br />
Hadza 76 6.0 2.5 24.1<br />
Hiwi 68 3.3 3.3 17.9<br />
Ache 71 7.7 2.1 24.5<br />
Yanomamo Xilixana 75 7.3 1.9 22.8<br />
Tsimane 78 5.9 3.0 30.5<br />
!Kung 1963–74 74 7.8 2.7 35.4<br />
Ache reservation 78 5.9 3.0 30.5<br />
Aborigines 74 7.8 2.7 35.4<br />
Wild chimpanzees 15 16.8 4.6 100.0<br />
Captive chimpanzees 42 7.5 2.6 38.5<br />
Sweden 1751–59 72 7.4 2.3 24.3<br />
United States 2002 85 1.7 3.5 35.3<br />
NOTE: The extent of variation around the mode is usually defined as four standard deviation units around the<br />
mode (Cheung et al. 2005).<br />
settlement. There is much greater variability in the ages of adult death within<br />
each of these populations than typically found in modern industrial populations<br />
(Cheung et al. 2005), in part because of the higher age-independent<br />
mortality (a 2 ) <strong>among</strong> the Ache. Lexis (1878) considered such mortality to<br />
be different from the “normal” course of aging. For example, re-estimating<br />
Hadza mortality without an age-independent mortality component (a 2 =0)<br />
increases the mode from 76 to 78, and decreases the standard deviation<br />
around the mode from 6.0 to 5.1. The modes derived from the Siler model<br />
are therefore less peaked, accounting for less than 3 percent of adult deaths<br />
within the year marking the mode. Of the three study population groups,<br />
acculturated hunter-gatherers show the greatest proportion of deaths after<br />
age 55, possibly indicating that as some causes of death (such as violence) are<br />
reduced, age-related causes of death become more substantial, leading to a<br />
greater share of deaths around the mode (Figure 4).<br />
Variation in mortality rates and the effects of changing<br />
conditions<br />
The relationship between juvenile and adult mortality rates a<strong>cross</strong> populations. Some<br />
historical cohort evidence indicates that high infant and child mortality have<br />
substantial impact on survivorship later in the life span (Costa 2000; Wilmoth,<br />
Vallin, and Caselli 1990). Finch and Crimmins (2004) show that the level<br />
of child mortality explains 85 percent of the variance in old-age mortality<br />
in cohorts in Sweden and the United States, and that early mortality has a<br />
threefold greater predictive effect on old-age mortality for those cohorts than<br />
PDR 33.2 Gurven-Kaplan-FINAL.indd 335 5/22/07 2:16:42 PM
3 3 6 L O N G E V I T Y A M O N G H U N T E R - G A T H E R E R S<br />
period measures of early mortality. Figure 5 presents the results of regressing<br />
life expectancy at 45 (e 45 ) on survival to age 15 (l 15 ), and compares those<br />
results with historical cohort evidence from Denmark (1835–2002) and<br />
Sweden (1751–2003) (Berkeley Human Mortality Database). In the range<br />
of survival probabilities in the traditional foraging sample, the relationship<br />
between juvenile survival and later adult mortality rates is almost the same<br />
<strong>among</strong> foragers as it is for northern Europeans. An additional 15–20 years of<br />
life are expected upon reaching age 45.<br />
The effects of contact and acculturation. One of the best ways to examine the<br />
effects of acculturation on traditional small-scale populations is to compare<br />
mortality profiles of the same groups at different time periods. These diachronic<br />
comparisons can be made for the Yanomamo, Ache, Agta, Hiwi, and !Kung.<br />
As was noted above, demographic data exist on these groups before and after<br />
some critical period, be it contact (Yanomamo, Ache) or acculturation and<br />
transition to peasant status (Agta and !Kung). Because similar data are available<br />
for the Herero, a group of agro-pastoralists in Botswana and Namibia<br />
(Pennington and Harpending 1993), we include them in this comparison.<br />
Figure 6 shows the ratio of age-specific mortality hazards from more and less<br />
acculturated time periods. Figure 6a displays populations whose survivorship<br />
has improved with acculturation (!Kung, Ache, Herero, Hiwi) and Figure 6b<br />
populations whose condition has worsened (Agta and Yanomamo).<br />
FIGURE 5 Juvenile survivorship and life expectancy at age 45<br />
Life expectancy at age 45 (years)<br />
24<br />
22<br />
20<br />
18<br />
16<br />
14<br />
Denmark<br />
1835–2002<br />
e 45 from l 15 for sample of small-scale societies<br />
Sweden<br />
1751–2003<br />
12<br />
0.4 0.45 0.5 0.55 0.6 0.65 0.7<br />
Proportion surviving from birth to age 45<br />
NOTE: Linear regression estimates of life expectancy at age 45 (e ) from survivorship to age 15 (l ).<br />
45 15<br />
Relationship shown for our sample of small-scale populations, and for Sweden (using longitudinal cohort data<br />
from 1751 to 2003) and Denmark (from 1835 to 2002).<br />
PDR 33.2 Gurven-Kaplan-FINAL.indd 336 5/22/07 2:16:43 PM
M I C H A E L G U R V E N / H I L L A R D K A P L A N 3 3 7<br />
FIGURE 6 Diachronic changes in age-specific mortality patterns<br />
within populations<br />
Ratio h(x) post vs. pre-contact<br />
Ratio h(x) post vs. pre-contact<br />
2<br />
1.75<br />
1.5<br />
1.25<br />
1<br />
0.75<br />
0.5<br />
0.25<br />
1.5<br />
0.5<br />
a) improved conditions<br />
Hiwi<br />
Ache<br />
!Kung<br />
Herero<br />
0<br />
0 5 10 15 20 25 30 35 40 45 50 55 60 65 70 75 80<br />
4<br />
3.5<br />
3<br />
2.5<br />
2<br />
1<br />
b) worse conditions<br />
Agta<br />
Yanomamo<br />
0<br />
0 5 10 15 20 25 30 35 40<br />
Age<br />
45 50 55 60 65 70 75 80<br />
NOTE: The ratio of estimated mortality hazards from post-contact or acculturated time perids and pre-contact<br />
or relatively unacculturated time periods from the same populations. Panel (a) shows mortality hazard ratio<br />
for populations with improvements in survivorship after contact for much of the life span, while (b) shows<br />
those with higher survivorship before contact and interaction with outsiders.<br />
Contact and acculturation had large effects on mortality rates in some<br />
groups. Among the Ache, Hill and Hurtado (1996) divide the demography<br />
into three periods: pre-contact, contact, and post-contact. The period of<br />
contact brought catastrophic diseases to the Ache, about 40 percent of whom<br />
PDR 33.2 Gurven-Kaplan-FINAL.indd 337 5/22/07 2:16:44 PM
3 3 8 L O N G E V I T Y A M O N G H U N T E R - G A T H E R E R S<br />
died less than a decade after contact. Here we compare the post-contact with<br />
the pre-contact period. After a period of contact, mortality increased during<br />
infancy but diminished to about one-fourth to one-third of pre-contact<br />
levels for late childhood and adulthood. The effects of improved conditions<br />
are greater at younger ages and gradually decline with age. Reduced mortality<br />
<strong>among</strong> settled Ache is largely due to reductions in homicide and forestrelated<br />
accidents attendant on missionary influence and state intervention<br />
(Hill and Hurtado 1996). Medical attention has also helped lower mortality<br />
<strong>among</strong> Ache.<br />
A similar pattern is found for the !Kung, with the exception that<br />
survival improves at all ages. Although settled !Kung frequently complain<br />
about meat scarcity and changing norms of resource distribution, they also<br />
benefit from increased access to milk, protein-rich weaning foods, and a<br />
more predictable diet through greater association with cattleposts and receipt<br />
of government rations (Harpending and Wandsnider 1982). It is possible,<br />
however, that we have overestimated the effects of acculturation on !Kung<br />
survivorship because of gaps in the prospective life table created by Howell<br />
(1979: Table 4.6). 4<br />
Among the Hiwi, contact has greatly increased infant mortality, but<br />
decreased mortality after infancy by about a half; data on the very old are<br />
insufficient to ascertain what happens after age 60. Among the Herero, there<br />
is a small increase in childhood mortality, but an improvement at older ages.<br />
The initially higher level of survival <strong>among</strong> the Herero probably accounts for<br />
the smaller effect of acculturation on mortality rates.<br />
Two groups appear to show deleterious effects of contact. Early child<br />
and adult mortality are much higher <strong>among</strong> “acculturated peasant” Agta and<br />
Xilixana Yanomamo. Infant mortality may be buffered by protective effects<br />
of breastfeeding, and so post-weaning mortality seems to worsen more in<br />
acculturated settings <strong>among</strong> both Agta and Yanomamo. Peasant Agta are<br />
landless agri<strong>cultural</strong>ists living in more populated and degraded environments<br />
with few foraging options, and they no longer maintain close trading<br />
relationships with nearby horti<strong>cultural</strong>ists (Early and Headland 1998). Early<br />
and Headland suggest that cumulative effects of malnutrition and infectious<br />
diseases such as measles have increased child mortality during the peasant<br />
phase, and they verify this through comparison of postneonatal and neonatal<br />
mortality rates. Additionally, malaria, tuberculosis, and other infectious<br />
diseases were believed to be largely absent in the forager phase <strong>among</strong> both<br />
Agta and Yanomamo but have reached epidemic proportions in the past<br />
30 years. Lower adult mortality <strong>among</strong> Yanomamo may be due to reduced<br />
warfare and homicide in recent years (Early and Peters 2000). It is unclear<br />
why the negative impact of infectious disease appears to affect adults over<br />
age 40 <strong>among</strong> Yanomamo whereas it affects reproductive-age adults <strong>among</strong><br />
Agta. One possibility is that susceptibility attributable to differential prior<br />
exposure may vary by age groups.<br />
PDR 33.2 Gurven-Kaplan-FINAL.indd 338 5/22/07 2:16:44 PM
M I C H A E L G U R V E N / H I L L A R D K A P L A N 3 3 9<br />
Studies that have focused on the effects of sedentism on mortality show<br />
a general decrease in child mortality, consistent with our description of the<br />
experience of !Kung, Herero, and Ache. These include the Ghanzi !Kung<br />
(Harpending and Wandsnider 1982), Kutchin Athapaskans (Roth 1981),<br />
Turkana pastoralists (Brainard 1986), and Nunamiut (Binford and Chasko<br />
1976). On the other hand, a slight increase in child mortality was observed<br />
<strong>among</strong> the Adavasi Juang agri<strong>cultural</strong>ists of India (Roth and Ray 1985). Fertility<br />
increases <strong>among</strong> members of all of these populations, and often does so<br />
before a noticeable decline in mortality.<br />
Acculturation in the past several decades is likely to be very different<br />
from the transitions to sedentary agri<strong>cultural</strong> or peasant life in the more remote<br />
past. Even when foragers become the new underclass of national society<br />
and foraging behavior becomes rarer, recent post-contact recovery periods<br />
are often accompanied by immunization campaigns and public health and<br />
sanitation measures that can substantially improve survivorship. It is likely<br />
that a worsening of physical health, or at best a lack of improvement, occurs<br />
when these benefits are absent or unavailable.<br />
To put these changes in perspective, Figure 7 shows the ratio of the<br />
average hunter-gatherer mortality hazards to US hazards in 2002. Infant<br />
mortality is over 30 times greater <strong>among</strong> hunter-gatherers, and early child<br />
mortality is over 100 times greater than encountered in the United States.<br />
Even late childhood mortality is about 80 times greater <strong>among</strong> hunter-gath-<br />
FIGURE 7 Two extremes in human mortality hazards: Ratio of<br />
Siler-estimated mortality hazards (h ) for hunter-gatherer<br />
x<br />
composite sample and the United States 2002<br />
200<br />
Ratio of mortality hazards<br />
175<br />
150<br />
125<br />
100<br />
75<br />
50<br />
25<br />
0<br />
0 5 10 15 20 25 30 35 40<br />
Age<br />
45 50 55 60 65 70 75 80<br />
PDR 33.2 Gurven-Kaplan-FINAL.indd 339 5/22/07 2:16:46 PM
3 4 0 L O N G E V I T Y A M O N G H U N T E R - G A T H E R E R S<br />
erers. Not until the late teens does the relationship flatten, with over a tenfold<br />
difference in mortality. This difference is only fivefold by age 50, fourfold by<br />
age 60, and threefold by age 70.<br />
Causes of mortality. It is important to investigate causes of death <strong>among</strong><br />
groups and at different ages to ascertain whether mortality patterns are the<br />
result of unique circumstances and history, ecological conditions, or genetic<br />
predispositions. We have seen that several of the study groups showed erratic<br />
mortality profiles that highlight the need for further <strong>examination</strong>, even after<br />
taking into account discrepancies in methodology. Many causes of death are<br />
difficult to assess in traditional populations without physicians or autopsies,<br />
and especially when causes of death are elicited during retrospective interviews.<br />
Even in modern hospitals, determining cause of death is sometimes<br />
elusive or ambiguous because of multiple levels of causation. Malnutrition,<br />
infections, and disease are common in our study populations, making designation<br />
of the primary cause of death problematic, if not inevitably incomplete.<br />
Accidents and homicides are usually easier to identify, and estimates of these<br />
causes should be less subject to error. Table 5 presents causes of death <strong>among</strong><br />
the populations for which such data exist. It also includes published causes<br />
of death for Aka Pygmies of the Congo (Hewlett, van de Koppel, and van de<br />
Koppel 1986) and Bakairi of Brazil (Picchi 1994). The table shows the overall<br />
percentage of deaths attributed to illness, degenerative disease, and accidents<br />
or violence. Our sample includes 3,328 deaths. Where age-specific data exist,<br />
cause of death is listed for juveniles (
TABLE 5 Causes of death <strong>among</strong> study populations (in percent)<br />
Northern<br />
Total<br />
Yano- Ache Ache Tsi- Machi- Territory<br />
Hadza mamo forest settled !Kung mane Aka Agta Hiwi guenga Aborigines Bakairi Gainj Number Percent<br />
a)
3 4 2 L O N G E V I T Y A M O N G H U N T E R - G A T H E R E R S<br />
nian groups, Black (1975) reports that most infectious diseases are absent in<br />
newly contacted groups, because small, mobile populations cannot support<br />
these contagious vectors. Post-contact prevalence of infectious disease <strong>among</strong><br />
Ache is similar to rates <strong>among</strong> Yanomamo (Hill and Hurtado 1996). Tsimane<br />
show a similar importance of respiratory disease at 20 percent of illness-related<br />
deaths. Bakairi have suffered repeated epidemics of respiratory illness,<br />
especially tuberculosis and whooping cough (Picchi 1994). Pneumonia and<br />
tuberculosis are claimed to be the top killers of adults and older children<br />
<strong>among</strong> !Kung (Howell 1979: 63). Gainj mortality and more recent mortality<br />
<strong>among</strong> Agta also show high rates of infectious disease.<br />
Degenerative deaths are relatively few, confined largely to problems<br />
early in infancy and late-age cerebrovascular problems, as well as attributions<br />
of “old age” in the absence of obvious symptoms or pathology. Heart attacks<br />
and strokes appear rare and do not account for these old-age deaths (see<br />
Eaton, Konner, and Shostak 1988), which tend to occur when sleeping. It<br />
has often been remarked that few risk factors for cardiovascular disease exist<br />
<strong>among</strong> active members of small-scale societies (Eaton et al. 1994), although<br />
compromised lung or kidney functioning can interact with cardiac fibrosis or<br />
moderate arterial stenosis to cause cardiac arrest. Obesity is rare, hypertension<br />
is low, cholesterol and triglyceride levels are low, and maximal oxygen<br />
uptake is high. Overall, degenerative disease accounts for 6–24 percent (average<br />
9 percent) of deaths, with the highest representation <strong>among</strong> Northern<br />
Territory Aborigines. Neoplasms and heart disease each accounted for 9 of<br />
the 42 deaths due to degenerative illness. It should be pointed out, however,<br />
that chronic illnesses as causes of death are the most difficult to identify,<br />
since more proximate causes are likely to be mentioned. To our knowledge<br />
there have been no focused studies or mention of Alzheimer’s, Parkinson’s,<br />
or other forms of dementia.<br />
Violence and warfare are variable a<strong>cross</strong> groups. Agta, Ache, Yanomamo,<br />
and Hiwi suffer from high levels of homicide, affecting adult males<br />
disproportionately. Homicide is low <strong>among</strong> Hadza, Tsimane, and Northern<br />
Territory Aborigines. Ache display a very high level of homicide, although<br />
much of this is infanticide, child homicide, and a result of skirmishes with<br />
rural Paraguayans. Infanticide is fairly high <strong>among</strong> Ache and Yanomamo,<br />
occasional <strong>among</strong> !Kung and Tsimane, and rare <strong>among</strong> Hadza. Infants most<br />
susceptible to infanticide include those born with obvious defects, those<br />
perceived as weak, twins, and those of questionable paternity. It seems likely<br />
that violent deaths decrease with increased state-level intervention and missionary<br />
influence in many small-scale groups around the world (e.g., Agta,<br />
Ache, Aborigines, !Kung, Yanomamo). The composition of accidental deaths<br />
varies a<strong>cross</strong> groups, including falls, river drownings, animal predation, accidental<br />
poisonings, burns, and getting lost in the environment. Only one<br />
Hadza death (1 percent) was accidental, with remaining groups showing<br />
PDR 33.2 Gurven-Kaplan-FINAL.indd 342 5/22/07 2:16:47 PM
M I C H A E L G U R V E N / H I L L A R D K A P L A N 3 4 3<br />
4–13 percent of deaths as unintentional or accidental. Together, accidental<br />
and violent deaths account for 4–69 percent (average 19 percent) of all<br />
deaths. The high proportion of Ache deaths due to violence is a consequence<br />
of few illness-related deaths in the pre-contact sample. The post-contact Ache<br />
sample shows only 14 percent violent and accidental deaths, with 68 percent<br />
of deaths due to illness.<br />
The sample of deaths for Agta, pre-contact Xilixana Yanomamo, and<br />
Gainj is small. Early and Headland (1998) and Early and Peters (2000)<br />
surmise that a large percentage of unknown deaths <strong>among</strong> Agta is due to<br />
infectious disease. Among Gainj, most adult deaths are due to infectious disease.<br />
The very high adult mortality <strong>among</strong> Agta results from a combination<br />
of maternal mortality, homicide, and infectious disease. The rates of Agta<br />
death for maternal mortality and homicide are the highest reported for any<br />
population in the world.<br />
Traditional humans, chimpanzees, and<br />
paleodemography<br />
Figure 8 examines five mortality ratios as a function of age: 1) traditional to<br />
acculturated hunter-gatherers, 2) wild to captive chimpanzees, 3) wild chimpanzees<br />
to traditional foragers, 4) captive chimpanzees to traditional foragers,<br />
and 5) estimates for prehistoric populations to traditional foragers. The<br />
first two comparisons reflect the effects of changed conditions. The next two<br />
comparisons allow for the assessment of the interaction of changed conditions<br />
and species differences. The last combines the effects of errors in estimation<br />
and changes in mortality rates over time.<br />
The effects of improved conditions have similar within-species effects<br />
on humans and chimpanzees. Captivity <strong>among</strong> chimpanzees, which provides<br />
medical attention, abundant feeding, and protection from predation, exerts<br />
a very large effect on infant and juvenile survival rates. The effects of captivity<br />
diminish with age. Among traditional humans, the effects of improved<br />
conditions seem to be greatest during childhood and middle adulthood,<br />
tapering off with age.<br />
The age-specific differences between humans and chimpanzees are<br />
revealing. The difference between foragers and wild chimpanzees increases<br />
dramatically with age. The ratio of mortality hazards is over three times as<br />
high <strong>among</strong> chimpanzees during childhood, and then increases to about<br />
eight times as high at age 45. Improved conditions for captive chimpanzees<br />
actually generate lower mortality during infancy and early childhood than<br />
<strong>among</strong> some foragers. However, the species differences then overcome the<br />
effects of conditions, with captive chimpanzee mortality rates being over<br />
three times as high as that of foragers by age 40.<br />
PDR 33.2 Gurven-Kaplan-FINAL.indd 343 5/22/07 2:16:47 PM
3 4 4 L O N G E V I T Y A M O N G H U N T E R - G A T H E R E R S<br />
FIGURE 8 Ratio of mortality hazards for humans and chimpanzees<br />
Ratio of mortality hazards<br />
14<br />
12<br />
10<br />
8<br />
6<br />
4<br />
2<br />
Ratio of wild to<br />
captive chimps<br />
Ratio of wild<br />
chimps to HGs<br />
Ratio of<br />
prehistoric<br />
humans to HGs<br />
Ratio of captive<br />
chimps to HGs<br />
Ratio of traditional HGs<br />
to acculturated HGs<br />
0<br />
0 5 10 15 20 25 30 35<br />
Age<br />
40 45 50 55 60 65 70<br />
NOTE: Comparisons in mortality based on hazard ratios for unacculturated and acculturated huntergatherers,<br />
wild and captive chimpanzees, wild chimps and hunter-gatherers, captive chimps and huntergatherers,<br />
and prehistoric humans and hunter-gatherers. See text for description of samples.<br />
SOURCES: Wild chimpanzees (Siler estimated based on Hill et al. 2001); captive chimpanzees (Siler estimated<br />
based on Dyke et al. 1995); prehistoric humans (Gage 2002).<br />
It is usually reported that Paleolithic humans had life expectancies of<br />
15–20 years and that this brief life span persisted over thousands of generations<br />
(Cutler 1975; Weiss 1981) until early agriculture less than 10,000 years<br />
ago caused appreciable increases to about 25 years. Several prehistoric life<br />
tables support this trend, such as those for the Libben site in Ohio (Lovejoy et<br />
al. 1977), Indian Knoll in Kentucky (Herrmann and Konigsberg 2002), and<br />
Carlston Annis in Kentucky (Mensforth 1990). Gage (1998) has compiled a<br />
set of reconstructed prehistoric life tables with similar life expectancies and<br />
computed Siler estimates for a composite prehistoric mortality profile. This<br />
and most other prehistoric profiles show l 50 of 2–9 percent and e 45 values of<br />
3–7 years. There is a large paleodemographic literature concerning problems<br />
of age estimation in skeletal samples and bias in bone preservation <strong>among</strong><br />
older individuals (see Buikstra and Konigsberg 1985; Buikstra 1997; Walker,<br />
Johnson, and Lambert 1988; Hoppa and Vaupel 2002). Howell (1976) has<br />
identified many problems with prehistoric life tables. This literature is too<br />
large to discuss here and we direct readers to recent treatments by O’Connell<br />
et al. (1999), Kennedy (2003), and Konigsberg and Herrmann (2006).<br />
The comparison of Siler estimates of prehistoric humans with those for<br />
traditional modern foragers poses a further challenge to the historical data<br />
(consistent with the criticisms discussed above). Mortality rates in prehistoric<br />
PDR 33.2 Gurven-Kaplan-FINAL.indd 344 5/22/07 2:16:48 PM
M I C H A E L G U R V E N / H I L L A R D K A P L A N 3 4 5<br />
populations are estimated to be lower than those for traditional foragers until<br />
about age 2 years. Estimated mortality rates then increase dramatically for<br />
prehistoric populations, so that by age 45 they are over seven times greater<br />
than those for traditional foragers, even worse than the ratio of captive chimpanzees<br />
to foragers. Because these prehistoric populations cannot be very different<br />
genetically from the populations surveyed here, there must be systematic<br />
biases in the samples and/or in the estimation procedures at older ages<br />
where presumably endogenous senescence should dominate as primary cause<br />
of death. While excessive warfare could explain the shape of one or more of<br />
these typical prehistoric forager mortality profiles, it is improbable that these<br />
profiles represent the long-term prehistoric forager mortality profile. Such<br />
rapid mortality increase late in life would have severe consequences for our<br />
human life history evolution, particularly for senescence in humans.<br />
It may be possible to use the data from modern foragers to adjust those<br />
estimates for prehistoric foragers. Longitudinal analyses and <strong>cross</strong>-<strong>cultural</strong><br />
comparisons have shown that in the Gompertz–Makeham model, the overall<br />
rate of mortality is negatively associated with the rate of mortality increase<br />
with age. Strehler and Mildvan (1960) referred to this relationship as the<br />
compensation law of mortality, where high initial adult mortality is offset by<br />
lower values of the mortality slope. Their argument assumes a decline in<br />
“vitality” with age and an inverse relationship between the frequency of environmental<br />
stresses and the intensity of those stresses on the body. Mortality<br />
compensation implies that differences in mortality rates <strong>among</strong> populations<br />
should decrease with age and converge on a common species-typical pattern<br />
of senescence (Gavrilov and Gavrilova 1991; Yashin et al. 2001). While the<br />
theory underlying mortality compensation is controversial, the robust inverse<br />
relationship between the two Gompertz parameters is not. In the Siler<br />
formulation, the intercept and slope parameters are a 3 and b 3, respectively.<br />
In the forager dataset, the best-fit equation for the relationship between lna 3<br />
and b 3 is:<br />
ln a = −64. 983b − 2. 9888<br />
(3)<br />
3 3<br />
This relationship is highly significant (r=0.994, p
3 4 6 L O N G E V I T Y A M O N G H U N T E R - G A T H E R E R S<br />
The Siler estimates of a 3 and b 3 for the prehistoric composite life table<br />
provided by Gage (1998) are extreme outliers from the regression equation<br />
(3). The average mortality profile for our forager populations is similar to that<br />
for Sweden in 1751, and early European populations and foraging populations<br />
show similar negative relationships between a 3 and b 3 . If we fix a 3 and<br />
solve for the appropriate b 3 based on equation (3), we find that b 3 should<br />
be 0.038, or one-half of the estimate by Gage. Calculation of the life table<br />
with this revised value of b 3 changes l 50 from 4 percent to 24 percent and e 45<br />
from 6 years to 19 years. Overall life expectancy only changes from 20 to<br />
28 years. Alternatively, if we fix b 3 and instead recalculate a 3 , we find that<br />
an a 3 consistent with the linear relationship of equation (4) is 1/12 of Gage’s<br />
estimate. A life table with this revised a 3 estimate shifts l 50 to 36 percent, e 45<br />
to 18 years, and mean life expectancy to 33 years.<br />
Critics may argue that the uniformitarian mortality assumption does<br />
not apply to those prehistoric populations that tend to show relatively low<br />
infant and child mortality but excessively high adult mortality. If not based<br />
on erroneous assumptions about population growth and model life tables,<br />
such adult mortality would presumably be due to violence and warfare<br />
and not to widespread infectious disease or intrinsic senescence. Infectious<br />
disease is unlikely to reach epidemic proportions in small, isolated populations<br />
(Black 1975). In our sample, widespread lethal infectious disease was<br />
most common in groups that had been interacting with large populations<br />
of outsiders. Intrinsic senescence is also unlikely to have been much higher<br />
in the past because evidence also suggests that early and late-age mortality<br />
are closely linked <strong>among</strong> cohorts as a result of the cascading effects of early<br />
infections and undernutrition (Kuh and Ben-Shlomo 1997; Costa 2000;<br />
Finch and Crimmins 2004).<br />
Making inferences about population growth<br />
in the past by reference to modern foragers<br />
One of the criticisms of making inferences about ancestral populations from<br />
the study of ethnographic foragers is that the high population growth rates<br />
of some modern groups could not possibly be representative of ancestral foragers<br />
for long periods of time. Figure 9 displays “iso-growth” curves, which<br />
are lines of equal population growth as a function of different levels of the<br />
total fertility rate (TFR) and survivorship to age 15 (l 15 ). 5 Defining curves in<br />
terms of these two variables is useful because TFR and l 15 exist for many more<br />
groups than our sample of societies used here. Other foraging groups included<br />
here are the Chenchu, Mbuti, Aka, Batak, and Greenland Inuit. Additional<br />
horti<strong>cultural</strong>ists include the Bari, Dusun, Kapauku, Ngbaka, Semai, Talensi,<br />
Tamang, and 23 South American Amazonian groups. Additional pastoralists<br />
include the Datoga, Kipsigis, and Sebei. These groups were largely compiled<br />
from Hewlett (1991) and Salzano and Callegari-Jacques (1988). Although<br />
PDR 33.2 Gurven-Kaplan-FINAL.indd 346 5/22/07 2:16:50 PM
M I C H A E L G U R V E N / H I L L A R D K A P L A N 3 4 7<br />
FIGURE 9 Iso-growth curves: Iso-clines of equal population growth<br />
rates are shown as a function of total fertility rate (TFR) and<br />
survivorship to age 15 (l 15 )<br />
Total fertility rate<br />
10<br />
9<br />
8<br />
7<br />
6<br />
5<br />
4<br />
3<br />
2<br />
1<br />
N<br />
N<br />
G<br />
N<br />
I<br />
N<br />
G<br />
I<br />
N<br />
G<br />
I<br />
Ç<br />
I<br />
I<br />
I<br />
I<br />
G<br />
I<br />
G I<br />
I<br />
G<br />
GB<br />
B<br />
NI<br />
Ç<br />
N<br />
I N<br />
I Ç N<br />
I<br />
N<br />
IN<br />
I<br />
G<br />
G<br />
I I<br />
Ç<br />
0<br />
0.3 0.4 0.5 0.6 0.7 0.8 0.9 1<br />
Proportion surviving to age 15<br />
G forager<br />
N Forager-horti<strong>cultural</strong>ist<br />
NOTE: Each data point refers to a single population.<br />
forager mortality is narrowly confined, fertility ranges widely from below<br />
4 to as high as 8 children per woman. At the forager average l 15 of 0.55,<br />
population growth is zero at a TFR of about 4. At the forager average TFR of<br />
5.7, population growth is zero at an l 15 of 0.41. The average observed forager<br />
population shows a growth rate of about 1 percent per year. Although several<br />
groups have fertility and mortality levels implying zero or negative population<br />
growth, the majority of small-scale foraging populations show positive<br />
growth. Forager-horti<strong>cultural</strong> and horti<strong>cultural</strong> populations both have an<br />
average l 15 of about 0.67 and TFR of 6.2. Their implied average growth rate<br />
thus exceeds 2 percent. Pastoralists have an average l 15 of 0.72 and TFR of<br />
5.6, indicating an average growth rate also above 2 percent.<br />
Of the foraging populations, just under half show population growth<br />
rates near zero (two are just below replacement and three just above), and the<br />
remainder show higher population growth rates. At least two explanations<br />
of these results are possible. One possibility is that past population growth<br />
rates were close to zero and that current positive growth rates in some groups<br />
I<br />
I horti<strong>cultural</strong>ist<br />
B<br />
II<br />
N<br />
B sedentary forager<br />
N<br />
I<br />
I<br />
Ç<br />
N<br />
r = 0.03<br />
r = 0.02<br />
r = 0.01<br />
r = 0<br />
r = –0.01<br />
Ç pastoralist<br />
PDR 33.2 Gurven-Kaplan-FINAL.indd 347 5/22/07 2:16:51 PM
3 4 8 L O N G E V I T Y A M O N G H U N T E R - G A T H E R E R S<br />
are unrepresentative of past populations. Levels of homicide and intergroup<br />
warfare may have been greater in the past. Also, some groups may have had<br />
greater access to food during the sample period than in the past. For example,<br />
the northern Ache experienced high growth rates throughout the twentieth<br />
century, and the depopulation of Guarani horti<strong>cultural</strong> groups in their area,<br />
caused by slave trading and warfare, may have been a factor. The southern<br />
Ache, in contrast, were on the verge of extinction because of increasing encroachment<br />
on their traditional range by outsiders. As illustrated in Figure<br />
9, zero population growth requires either a significant decrease in fertility<br />
below that observed in almost all foraging groups, or a decrease in survivorship<br />
below that ever observed <strong>among</strong> modern or prehistoric foraging populations.<br />
Even with the inclusion of an additional nine values of l 15 from other<br />
foraging populations, mean survivorship drops only to 0.53 (s.d.=0.07). 6 This<br />
probably means that the fertility of sample populations would have to have<br />
been closer to 4.5 in order for population growth to remain at zero.<br />
A second possibility is that although long-term population growth must<br />
have been nearly zero over long periods of time, population dynamics over<br />
shorter time periods resembled a “saw-tooth” pattern (Hill and Hurtado<br />
1996), characterized by rapid population increases and subsequent crashes.<br />
Most time is therefore spent in a growing state, consistent with the high<br />
growth rates seen in many ethnographic reports on hunter-gatherers. Binford<br />
(personal communication) recounts the case of an Nunamiut Eskimo group<br />
that perished in its entirety, having been snowed in without sufficient food<br />
supplies to survive through the winter.<br />
It is difficult to evaluate these two hypotheses in light of current knowledge<br />
about past conditions. While evidence suggests that climate varied<br />
widely throughout the Pleistocene and into the Holocene epoch (see Richerson,<br />
Bettinger, and Boyd 2005), the extent to which past foragers typically<br />
experienced increasing, declining, or zero growth in past environments is<br />
unknown. Perhaps some combination of the two hypotheses is the correct<br />
answer. Mortality experiences of infants and children and adult mortality due<br />
to violence and trauma probably varied significantly over time and place.<br />
Summary of results<br />
We summarize our main findings to this point:<br />
Post-reproductive longevity is a robust feature of hunter-gatherers and<br />
of the life cycle of Homo sapiens. Survivorship to grandparental age is achieved<br />
by over two-thirds of people who reach sexual maturity and can last an average<br />
of 20 years.<br />
Adult mortality appears to be characterized by two stages. Mortality<br />
rates remain stable and fairly low at around 1 percent per year from the age<br />
of maturity until around age 40. After age 40, the rate of mortality increase<br />
is exponential (Gompertz) with a mortality rate doubling time of about 6–9<br />
PDR 33.2 Gurven-Kaplan-FINAL.indd 348 5/22/07 2:16:51 PM
M I C H A E L G U R V E N / H I L L A R D K A P L A N 3 4 9<br />
years. The two decades without detectable senescence in early and mid-adulthood<br />
appear to be an important component of human life span extension.<br />
The average modal age of adult death for hunter-gatherers is 72 with a<br />
range of 68–78 years. This range appears to be the closest functional equivalent<br />
of an “adaptive” human life span.<br />
Departures from this general pattern in published estimates of life expectancy<br />
in past populations (e.g., low child and high adult mortality) are<br />
most likely due to a combination of high levels of contact-related infectious<br />
disease, excessive violence or homicide, and methodological problems that<br />
lead to poor age estimates of older individuals and inappropriate use of model<br />
life tables for deriving demographic estimates.<br />
Illnesses account for 70 percent, violence and accidents for 20 percent,<br />
and degenerative diseases for 9 percent of all deaths in our sample. Illnesses<br />
largely include infectious and gastrointestinal disease, although less than half<br />
of all deaths in our sample are from contact-related disease.<br />
Comparisons <strong>among</strong> hunter-gatherers, acculturated hunter-gatherers,<br />
wild chimpanzees, and captive chimpanzees illustrate the interaction of<br />
improved conditions and species differences. Within species, improved conditions<br />
tend to decrease mortality rates at all ages, with a diminishing effect at<br />
older ages. Human and chimpanzee mortality diverge dramatically at older<br />
ages, revealing selection for a longer adult period in humans.<br />
Discussion and conclusions: The evolved<br />
human life span<br />
A fundamental conclusion we draw from this analysis is that extensive longevity<br />
appears to be a novel feature of Homo sapiens. Our results contradict<br />
Vallois’s (1961: 222) claim that <strong>among</strong> early humans, “few individuals passed<br />
forty years, and it is only quite exceptionally that any passed fifty,” and the<br />
more traditional Hobbesian view of a nasty, brutish, and short human life (see<br />
also King and Jukes 1969; Weiss 1981). The data show that modal adult life<br />
span is 68–78 years, and that it was not uncommon for individuals to reach<br />
these ages, suggesting that inferences based on paleodemographic reconstruction<br />
are unreliable. One recent study that avoids several common problems<br />
of skeletal aging used dental-wear seriation and relative macro-age categories<br />
(ratio of old to young) to demonstrate an increase in the relative presence<br />
of older adults from australopithecines to early Homo and, more strikingly,<br />
<strong>among</strong> Upper Paleolithic humans (Caspari and Lee 2004; but see Hawkes and<br />
O’Connell 2005). More compellingly, a recent re-estimation of several common<br />
paleo-mortality curves based on hazard analysis and maximum likelihood<br />
methods shows a life course pattern similar to that of our ethnographic<br />
sample (Konigsberg and Herrmann 2006).<br />
We conclude the article with a brief discussion of life span evolution<br />
of the hunter-gatherers in our sample. Two issues are addressed. The first<br />
PDR 33.2 Gurven-Kaplan-FINAL.indd 349 5/22/07 2:16:52 PM
3 5 0 L O N G E V I T Y A M O N G H U N T E R - G A T H E R E R S<br />
is why modal life spans are about seven decades, not shorter or longer. The<br />
second issue is how best to conceive of life span evolution, especially in relation<br />
to the gene–environment interactions that determine age distributions<br />
of death at the population level.<br />
Why seven decades?<br />
The classic theory of senescence in evolutionary biology argues that individuals<br />
contribute less to reproductive fitness as they age because less of their<br />
expected lifetime fertility remains (Haldane 1942; Medawar 1952; Williams<br />
1957; Hamilton 1966). Consequently, natural selection acts more weakly to<br />
counteract deleterious mutations affecting mortality at older ages. The existence<br />
of substantial post-reproductive life <strong>among</strong> humans therefore suggests<br />
that older individuals maintain “reproductive value” by increasing their fitness<br />
through non-reproductive means, a critical component of all evolutionary<br />
models of human longevity.<br />
George Williams (1957) was first to propose that beginning at ages<br />
45–50 years, mothers may benefit more from investing their energy and resources<br />
in existing descendants than from producing new ones. This idea later<br />
became known as the “grandmother hypothesis” (Hill and Hurtado 1991).<br />
A specific version of the grandmother hypothesis proposed by Hawkes et al.<br />
(1998) focuses on intergenerational transfers <strong>among</strong> women and proposes<br />
that older women can increase their inclusive fitness by raising offspring fertility<br />
and grandoffspring survivorship through provisioning. The resources<br />
acquired by women foragers are strength-intensive, disadvantaging young<br />
children while increasing the value of older women’s contributions. According<br />
to this view, extensions in the human life span are driven by selection on<br />
women and the value of resource transfers from grandmothers to grandchildren.<br />
Peccei (2001) proposes an amendment to this view. She points out that<br />
long-term juvenile dependence <strong>among</strong> humans implies that adults who cease<br />
reproducing in their 40s will not finish parenting until they are 60 or older<br />
(see also Lancaster and King 1985). The notion that most of the benefits to<br />
longevity derive from helping offspring rather than grandoffspring has been<br />
called the “mother hypothesis” (see Packer et al. 1998 for a similar argument<br />
based on baboons).<br />
The embodied capital model (Kaplan et al. 2000; Kaplan and Robson<br />
2002; Gurven and Kaplan 2006) extends these ideas to both sexes in a formal<br />
life-history model, relating intergenerational transfers to the ecology of the<br />
hunting and gathering lifestyle. It proposes that timing of life events is best<br />
understood as an “embodied capital” investment process. Embodied capital is<br />
organized somatic tissue, which functionally increases lifetime adult income<br />
and includes strength, skill, knowledge, and other abilities. Humans are specialists<br />
in brain-based capital. High levels of knowledge and skill are required<br />
PDR 33.2 Gurven-Kaplan-FINAL.indd 350 5/22/07 2:16:52 PM
M I C H A E L G U R V E N / H I L L A R D K A P L A N 3 5 1<br />
to exploit the suite of high-quality, difficult-to-acquire resources humans<br />
consume. Those abilities require a large brain and a long time-commitment<br />
to development. This extended learning phase, during which productivity<br />
is low, is compensated for by higher productivity during adulthood. Since<br />
productivity increases with age, the time investment in skill acquisition and<br />
knowledge leads to selection for lowered mortality rates and greater longevity,<br />
because the returns on the investments in development occur at older<br />
ages. According to this model, the long human life span co-evolved with the<br />
lengthening of the juvenile period, increased brain capacities for information<br />
processing and storage, and intergenerational resource flows. It is a two-sex<br />
model, as it proposes that both men and women engage in learning-intensive<br />
food production tasks; these activities result in delayed productivity until<br />
older ages, selecting for life span extension in both sexes.<br />
Each of these models relates the benefits of longevity to fitness effects<br />
achieved through transfers to dependent descendants (see Lee 2003). Indeed,<br />
an increasing number of studies focusing on the contributions of older<br />
individuals have found significant fitness effects via increased child and<br />
grandchild survivorship and fertility (e.g., Beise and Voland 2002; Jamison<br />
et al. 2002; Sear, Mace, and McGregor 2000; Sear et al. 2002; Hawkes et al.<br />
1998; Lahdenpera et al. 2004). The demographic data derived from foragers<br />
and forager-horti<strong>cultural</strong>ists allow us to assess how those contributions can<br />
change with age. The two panels of Figure 10, derived from data on Tsimane<br />
forager-horti<strong>cultural</strong>ists, compare age-specific numbers of dependent descendants<br />
with mortality rates. The top panel shows the weighted sum of children<br />
and one-half the number of grandchildren by age (since grandchildren share,<br />
on average, a quarter of their genes with grandparents, whereas parents share<br />
half with their own children). The lower panel shows age-specific mortality<br />
rates. Even though a woman still has descendants who could benefit from<br />
her assistance, the number of offspring and grandoffspring, especially dependents<br />
less than 15 years old, drops considerably after about age 65. This<br />
is also the point when mortality begins to rise steeply. The late age at which<br />
decline in contributions to dependents begins is similar to the modal age at<br />
death from Figure 4. We have tabulated actual flows of food and observed<br />
that men and women invest in children and grandchildren after reproduction<br />
has ceased, with a shifting emphasis from mostly children to mostly<br />
grandchildren as they age. Those results provide the greatest support for the<br />
embodied capital hypothesis.<br />
As the number of closely related dependent kin eligible to receive investment<br />
decreases after age 65, the fitness benefits of longer life decrease<br />
and there is less evolutionary incentive to pay increasing maintenance and<br />
repair costs to remain alive and functional beyond this period. Data on males<br />
would show a similar pattern, except that the male peak in dependency is 3<br />
to 5 years later, due to their later age at marriage. This decline in the poten-<br />
PDR 33.2 Gurven-Kaplan-FINAL.indd 351 5/22/07 2:16:52 PM
3 5 2 L O N G E V I T Y A M O N G H U N T E R - G A T H E R E R S<br />
FIGURE 10 Age-specific dependency and adult mortality<br />
Number of children + 0.5 grandchildren<br />
h(x)<br />
14<br />
12<br />
10<br />
8<br />
6<br />
4<br />
< 5 years<br />
2<br />
< 1 year<br />
0<br />
0 5 10 15 20 25 30 35 40 45 50 55 60 65 70 75 80<br />
Age of female<br />
0.35<br />
0.3<br />
0.25<br />
0.2<br />
0.15<br />
0.1<br />
0.05<br />
0<br />
0 5 10 15 20 25 30 35 40 45 50 55 60 65 70 75 80<br />
NOTE: Number of children and 1/2 number of grandchildren by age of a Tsimane woman (top panel)<br />
compared with age-specific mortality rate for Tsimane (bottom panel).<br />
tial pool of genetic beneficiaries may explain why few people lived beyond<br />
the seventh decade of life.<br />
Gene–environment interactions<br />
and life span evolution<br />
< 10 years<br />
Kids and<br />
grandkids<br />
< 15 years<br />
How can we reconcile the idea of an evolved life span with the evidence that<br />
mortality distributions are influenced by environmental conditions? Our<br />
answer may shed light on the recent debate over modern changes in hu-<br />
PDR 33.2 Gurven-Kaplan-FINAL.indd 352 5/22/07 2:16:53 PM
M I C H A E L G U R V E N / H I L L A R D K A P L A N 3 5 3<br />
man life span. While average life expectancy has changed significantly over<br />
recent history, it is an open question whether gains will continue linearly<br />
and whether the maximum life span itself will continue to increase (Vaupel<br />
1997; Wilmoth 1998).<br />
One view is that there is a fixed upper limit to the human life span at<br />
about 85±6 years (Wood et al. 1994), where the distribution of deaths becomes<br />
compressed or “rectangularized” over time as improved medical care<br />
and public health increasingly reduce early-age death (Fries 1989; Weiss<br />
1989). An alternative view posits that there is no set limit to the human<br />
life span and that improvements in medical care, treatments, and living<br />
conditions will continue to produce increases in longevity (Wilmoth 1998).<br />
Wood et al. (1994) characterize these two views as gerontological versus<br />
epidemiological. The gerontological view treats the various outcomes of aging<br />
as resulting from a single unitary process, leading to programmed death;<br />
the epidemiological view treats aging and its implications for mortality as<br />
resulting from a competing set of risks due to a set of independent or quasiindependent<br />
processes (see also Gage 1989). For example, Wood et al. argue<br />
against the notion of a unifying species-typical mortality rate doubling time<br />
(cf. Finch, Pike, and Whitten 1990), citing MRDT estimates varying from 3<br />
to 33 years for different causes of senescent death, such as atherosclerosis,<br />
emphysema, and cirrhosis.<br />
We suggest that neither view is fully correct and that a hybrid of the<br />
two approaches is more productive. It is necessary to consider not only the<br />
benefits of life span extension, but also the costs. Aging can be thought of<br />
as resulting from the combined effects of environmental assaults and the<br />
deleterious byproducts of metabolism. Natural selection favors optimal effort<br />
at repairing the damage produced by both processes. In each physiological<br />
subsystem, repair and damage prevention should evolve in response to their<br />
marginal and partially separable effects on age-specific fitness. If we imagine<br />
the environments in which our ancestors evolved, environmental assaults<br />
and access to energy to combat those assaults are likely to have varied a<strong>cross</strong><br />
time and locale. Such variation is likely to select for some phenotypic plasticity<br />
in allocations to defense and repair. At the same time, the hunting and<br />
gathering adaptation practiced by evolving humans was built upon a complex<br />
of long-term child dependence, during which learning outweighed productivity,<br />
and compensating high productivity of adults, especially in middle age.<br />
Together, the costs of slowing senescence and preventing mortality, and the<br />
benefits of extended investment in descendants, produced selection for a characteristic<br />
human life span, with some variance around the central tendency.<br />
The comparison of data from eighteenth-century Sweden to the hunting and<br />
gathering populations in our study suggests that similar age distributions of<br />
adult deaths occur under a broad range of environmental conditions.<br />
Reductions in infectious diseases and improvements in food supply<br />
sharply lower the assault rate on people’s bodies as modernization occurs.<br />
PDR 33.2 Gurven-Kaplan-FINAL.indd 353 5/22/07 2:16:54 PM
3 5 4 L O N G E V I T Y A M O N G H U N T E R - G A T H E R E R S<br />
Aging individuals are increasingly insulated from assaults as well. The defenses<br />
that evolved to be phenotypically plastic in relation to ancestral environmental<br />
variation produce a very different distribution of deaths under<br />
modern conditions. In that sense, the evolved human life span is perhaps best<br />
conceived as a population-level distribution of deaths that corresponds to the<br />
characteristic range of environments in which our ancestors lived.<br />
We do not fully understand the mechanisms underlying the effects of<br />
modernization. Do members of industrialized countries age more slowly,<br />
in a physiological sense, than people exposed to greater environmental assaults?<br />
Alternatively, are most of the mortality improvements attributable to<br />
reductions in cause-specific mortality at specific ages through prevention of<br />
assaults or medical treatment of illnesses? Is a 50-year-old Hadza as robust<br />
and functional as a 50-year-old American? It has been argued that aging<br />
and the onset of chronic disease are accelerated in response to poor nutrition,<br />
infectious disease, and chronic inflammatory processes in general (Elo<br />
and Preston 1992; Blackwell, Hayward, and Crimmins 2001; Bengtsson and<br />
Lindström 2000). For example, there is increasing evidence that chronic<br />
diseases, such as diabetes, occurred at earlier ages in the nineteenth century<br />
in the United States than they do today (Fogel and Costa 1997). In contrast,<br />
the Tsimane show higher levels of C-reactive protein (CRP) a<strong>cross</strong> all ages.<br />
CRP is an acute-phase protein that acts as a marker and instigator of inflammation,<br />
and <strong>among</strong> Tsimane it is associated with disease load and presence of<br />
parasites. Increasing evidence indicates that malnutrition and health insults<br />
during fetal and perinatal development produce cascading effects leading to a<br />
greater risk of coronary heart disease later in life (Barker and Osmond 1986;<br />
Cameron and Demerath 2002). Together these results suggest that aging and<br />
old-age mortality are modulated through energy allocation decisions made<br />
early in life in a particular disease ecology. Definitive answers on this score<br />
await further research.<br />
The comparison between humans and chimpanzees suggests, however,<br />
that species differences overwhelm differences in environmental conditions<br />
in determining mortality hazards as individuals age. This finding suggests<br />
that some differences in our respective genomes have resulted in basic differences<br />
in rates of repair and tissue maintenance that manifest themselves<br />
in physiological deterioration at older ages. When those differences are understood<br />
and then subjected to manipulation, the result may be changes in<br />
human mortality distributions at old ages that greatly exceed those attributable<br />
to disease treatment and assault prevention.<br />
Appendix: The sample of societies<br />
The Appendix describes each group in our sample, including the environmental<br />
and historical conditions during the time period to which the data correspond, the<br />
PDR 33.2 Gurven-Kaplan-FINAL.indd 354 5/22/07 2:16:54 PM
M I C H A E L G U R V E N / H I L L A R D K A P L A N 3 5 5<br />
methodology used to collect the data, and the methodological strengths and weaknesses<br />
of each data set. Contemporary hunter-gatherers have been affected by global<br />
socioeconomic forces and are not living replicas of our Stone Age ancestors. Each<br />
group has been exposed to a particular set of historical, ecological, and political conditions,<br />
and extant groups occupy only a small subset of the environments that foragers<br />
occupied in the past. Thus, even without the variable impact of infectious diseases<br />
and modernization, no single group can accurately represent all modern foragers or<br />
pristine foragers typical of our ancestral past (see Solway and Lee 1990).<br />
Isolation from outsiders, small-scale social structure, and absence of amenities<br />
also characterize many incipient horti<strong>cultural</strong>ist populations, many of whom also<br />
engage in foraging. Remote populations of forager-horti<strong>cultural</strong>ists therefore merit<br />
attention. It is debatable whether transitions to agriculture always result in better<br />
nutrition and uniform increases in survivorship <strong>among</strong> all age classes (Armelagos,<br />
Goodman, and Jacobs 1991; Cockburn 1971; Cohen and Armelagos 1984). Incipient<br />
agri<strong>cultural</strong>ists without modern amenities are an additional source of preindustrial<br />
societies to supplement our foraging sample. Horticulture-based populations are<br />
typically larger than foraging populations, which provides greater confidence in<br />
mortality estimates at late ages.<br />
<strong>Hunter</strong>-gatherers<br />
The ethnographic record of hunter-gatherers includes hundreds of cultures, but only<br />
about 50 groups have been studied. The sample of foraging societies presented here<br />
does not adequately cover all geographical areas. Only five foraging societies have<br />
been explicitly studied using demographic techniques—Hadza of Tanzania (Blurton<br />
Jones, Hawkes, and O’Connell 2002; Blurton Jones et al. 1992), Dobe !Kung (Howell<br />
1979), Ache of Paraguay (Hill and Hurtado 1996), Agta of Philippines (Early and<br />
Headland 1998), and Hiwi of Venezuela (Hill et al. 2007).<br />
Nancy Howell’s Dobe !Kung study in the Kalahari desert of Botswana and Namibia<br />
is one of the first and most impressive demographic accounts of a foraging<br />
society. The majority of !Kung have been settled during the last 50 years and have<br />
been rapidly acculturating in close association with nearby Herero and Tswana herders.<br />
At the time of her study in the 1960s, many of the adults had spent most of their<br />
lives foraging, despite ethnohistorical evidence showing interactions with mercantile<br />
interests in the nineteenth century and archaeological evidence suggesting trade with<br />
pastoral and agri<strong>cultural</strong> populations (see Solway and Lee 1990). An early !Kung<br />
sample refers to the period before the 1950s when the Bantu influence in the Dobe<br />
area was minimal. Later !Kung samples refer to the prospective time of study when<br />
the lifestyles of the !Kung were rapidly changing. In the 1970s, 454 people were living<br />
in the study site. Two life tables are used from this period. One is based on the<br />
94 deaths during the 11-year study period (Howell 1979: Table 4.4), and the other<br />
uses the referent study population with a smaller number of deaths during the same<br />
time period (ibid.: Table 4.6). Because the early !Kung sample clumps all adults aged<br />
45 years and older into one category, we construct a composite early !Kung sample<br />
by using mortality estimates for ages 40 and higher from Howell’s Table 4.4 and<br />
combine this with mortality estimates for ages less than 30 from the “early” sample.<br />
PDR 33.2 Gurven-Kaplan-FINAL.indd 355 5/22/07 2:16:54 PM
3 5 6 L O N G E V I T Y A M O N G H U N T E R - G A T H E R E R S<br />
Ages 30–39 years are modeled as an average of the mortality rates from both early<br />
and prospective samples. Howell’s Table 4.6 is placed in the acculturated huntergatherer<br />
category. Ages were determined through a combination of relative age lists,<br />
known ages of children and young adults, and application of stable age distribution<br />
from a “West” Coale and Demeny (1966) model, an approach similar to that initiated<br />
by Rose (1960). 7<br />
The Ache were full-time, mobile tropical forest hunter-gatherers until the<br />
1970s. Kim Hill and Magdalena Hurtado (1996) separate Ache history into three<br />
periods—a pre-contact “forest” period of pure foraging with no permanent peaceful<br />
interactions with neighboring groups (before 1970), a “contact” period (1971–77) in<br />
which epidemics had a profound influence on the population, and a recent “reservation”<br />
period in which Ache live as forager-horti<strong>cultural</strong>ists in relatively permanent<br />
settlements (1978–93). During this last period, the Ache have had some exposure<br />
to modern health care. The pre-contact period shows marked population increase,<br />
resulting in part from the open niche that was a direct result of high adult mortality<br />
<strong>among</strong> Paraguayan nationals during the Chaco War with Bolivia in the 1930s. No<br />
life table is published for the high-mortality contact period, during which many old<br />
and young died. Hill and Hurtado improve on Howell’s methods of age estimation<br />
by using averaged informant-ranking of age, informant estimates of absolute age<br />
differences between people, and polynomial regression of estimated year of birth on<br />
age rank. Apart from living individuals, reproductive histories of a large sample of<br />
adults produced the samples used for mortality analysis. At the time of study, there<br />
were roughly 570 northern Ache.<br />
The Hadza in the eastern rift valley of Tanzania were studied in the mid-1980s<br />
by Nicholas Blurton Jones and colleagues. Trading with herders and horti<strong>cultural</strong>ists<br />
has been sporadic <strong>among</strong> Hadza over the past century, and the overall quantity<br />
of food coming from horti<strong>cultural</strong>ists varies from 5 to 10 percent (Blurton Jones,<br />
Hawkes, and O’Connell 2002). The Hadza have been exposed to settlement schemes<br />
over the past 50 years, but none of these has proven very successful. The 1990s saw<br />
a novel type of outsider intervention in the form of further habitat degradation and<br />
“ethno-tourism” (ibid.). Although some Hadza have spent considerable time living<br />
in a settlement with access to maize and other agri<strong>cultural</strong> foods, most continue to<br />
forage and rely on wild foods. Age estimation of the population was achieved using<br />
relative age lists, a group of individuals of known ages, and polynomial regression.<br />
Two censuses done about 15 years apart, with an accounting of all deaths during the<br />
interim, allowed Blurton Jones to construct a life table and to show that sporadic<br />
access to horti<strong>cultural</strong> foods and other amenities cannot account for the mortality<br />
profile. There were roughly 750 Hadza in the study population.<br />
The Hiwi are neotropical savanna foragers of Venezuela studied by Hill and<br />
Hurtado in the late 1980s (Hurtado and Hill 1987, 1990). They were contacted in<br />
1959 when cattle ranchers began encroaching on their territory. Although living<br />
in semi-permanent settlements, Hiwi continue to engage in violent conflict with<br />
other Hiwi groups. At the time of study, almost their entire diet was wild foods, with<br />
68 percent of calories coming from meat and 27 percent from roots, fruits, and an<br />
arboreal legume. The study population contains 781 individuals. Nearby Guahibospeaking<br />
peoples practiced agriculture, but the Hiwi inhabited an area poorly suited<br />
PDR 33.2 Gurven-Kaplan-FINAL.indd 356 5/22/07 2:16:54 PM
M I C H A E L G U R V E N / H I L L A R D K A P L A N 3 5 7<br />
for agriculture. As <strong>among</strong> the Hadza, repeated attempts at agriculture by missionaries<br />
or government schemes have failed <strong>among</strong> this group. Mortality information comes<br />
from Hill et al. (2007).<br />
The Casiguran Agta of the Philippines are Negrito foragers studied by Tom Headland<br />
during 1962–86. They live on a peninsula close to mountainous river areas and<br />
the ocean. There are 9,000 Agta in eastern Luzon territory, and demographic study<br />
was focused on the San Ildefonso group of about 200 people (Early and Headland<br />
1998). Although Luzon itself is isolated, Agta have maintained trading relationships<br />
with lowlander horti<strong>cultural</strong>ists for at least several centuries (Headland 1997). The<br />
twentieth century introduced schooling and brief skirmishes during American and<br />
Japanese occupation. Age estimation was achieved through reference to known<br />
ages of living people and calendars of dated events. As in the Ache study, the Agta<br />
demography is divided into a “forager” period (1950–65), a transitional period of<br />
population decline (1966–80), and a “peasant” phase (1981–93). These last two<br />
phases are marked by guerilla warfare, and subjugation by loggers, miners, and<br />
colonists. Abridged life tables are available for all three time periods. The age groups<br />
given are broad (10 years for adult ages), and the last age category is 60+.<br />
Forager-horti<strong>cultural</strong>ists<br />
The above five populations comprise the foraging sample because the typology<br />
“hunter-gatherer” defines their mode of subsistence and its lack of reliance on domesticated<br />
foods. To the forager sample described above, we add the Yanomamo of<br />
Venezuela and Brazil, Tsimane of Bolivia, and Gainj of Papua New Guinea.<br />
Yanomamo, Tsimane, and Machiguenga are forager-horti<strong>cultural</strong>ist populations<br />
in Amazonian South America. Several Yanomamo studies have been carried out<br />
over the past 30 years. Although often construed as hunter-gatherers, Yanomamo<br />
have practiced slash and burn horticulture of plantains for many generations (Chagnon<br />
1968). They live mostly in small villages of less than 50 people. The effects<br />
on Yanomamo of the rubber boom and slave trade before the eighteenth century<br />
were minimal (Ferguson 1995). They remained mostly isolated until missionary<br />
contact in the late 1950s. The most complete demography comes from Early and<br />
Peters (2000) based on prospective studies of eight villages in the Parima Highlands<br />
of Brazil. Births and deaths were recorded by missionaries and FUNAI personnel<br />
since 1959. The pre-contact period (1930–56) predates missionary and other outside<br />
influence. The contact period (1957–60), “linkage” period (1961–81), and Brazilian<br />
period (1982–96) saw increased interaction with miners and Brazilian nationals and<br />
increased incidence of infectious disease. Ages for Xilixana (Mucaj) during this period<br />
were estimated using a chain of average interbirth intervals for people with at least<br />
one sibling of known age, and relative age lists in combination with estimated interbirth<br />
intervals. Because it set a historical precedent, we include the Neel and Weiss<br />
(1975) life table for Yanomamo based on 29 villages in Venezuela even though it<br />
does not meet our inclusion criteria. It applies a best-fit model life table using census<br />
data, a growth rate based on repeated censuses, and age-specific fertility. These censuses<br />
were taken during the 1960s, and ages were obtained by averaging different<br />
researchers’ independent estimates.<br />
PDR 33.2 Gurven-Kaplan-FINAL.indd 357 5/22/07 2:16:55 PM
3 5 8 L O N G E V I T Y A M O N G H U N T E R - G A T H E R E R S<br />
The Tsimane inhabit tropical forest areas of the Bolivian lowlands, congregating<br />
in small villages near large rivers and tributaries. Roughly 8,000 Tsimane live in<br />
dispersed settlements in the Beni region. Tsimane have had sporadic contact with<br />
Jesuit missionaries since before the eighteenth century, although they were never<br />
successfully converted or settled. Evangelical and Catholic missionaries set up missions<br />
in the early 1950s and later trained some Tsimane to become teachers in the<br />
more accessible villages. However, the daily influence of missionaries is minimal.<br />
Market integration is increasing, as are interactions with loggers, merchants, and<br />
colonists. Most Tsimane continue to fish, practice horticulture, and hunt and gather<br />
for the bulk of their subsistence. The demographic sample used here is based on<br />
reproductive histories collected by Gurven of 348 adults in 12 remote communities<br />
during 2002–03. Changes in mortality are evident in the 1990s, hence mortality data<br />
used here are restricted to the years 1950–89. Age estimation of older individuals<br />
was done by a combination of written records of missionaries, relative age rankings,<br />
and photo and verbal comparison with individuals of known ages.<br />
The Gainj are swidden horti<strong>cultural</strong>ists of sweet potato, yams, and taro in the<br />
central highland forests of northern Papua New Guinea. Meat is fairly rare (Johnson<br />
1981). At the time of study by Patricia Johnson and James Wood in 1978–79 and<br />
1982–83, 1,318 Gainj were living in 20 communities. Contact was fairly recent, in<br />
1953, with formal pacification in 1963, and there is genetic and linguistic evidence<br />
of their relative isolation (Wood et al. 1982). Prior to contact, population growth<br />
had been zero for at least four generations (Wood and Smouse 1982). An A2 Hong<br />
Kong influenza epidemic reduced the population by some 7 percent in 1969–70 and<br />
probably accounts for the dearth of older people in this population. Data were obtained<br />
from government censuses from 1970 to 1977; they include non-Gainj Kalam<br />
speakers, and it is likely that age estimates are fraught with error for older adults (see<br />
Wood and Smouse 1982). Additionally, published mortality estimates were already<br />
fitted with a Brass two-parameter logit model.<br />
Acculturated hunter-gatherers<br />
In addition to the Ache reservation sample, Agta transitional and peasant samples,<br />
and recent !Kung and Yanomamo samples, we include the Warao of Venezuela and<br />
Northern Territory Aborigines into the acculturated hunter-gatherer category.<br />
The Warao were traditional swamp foragers living in the Orinoco Delta in eastern<br />
Venezuela. They remained isolated in the bogland of the Orinoco until the last century.<br />
Apart from the fauna common to most of tropical South America, the Warao<br />
diet included products of the carbohydrate-rich sago palm. The Warao are included<br />
here even though they were once foragers because at the time of study they were<br />
practicing intensive agriculture. Oil exploration, colonist intrusion, and missionary<br />
influence all affected Warao from the 1920s on and pushed them to live near more<br />
accessible riverbanks. Increased sedentism and some access to modern health care<br />
have probably improved infant and child mortality. Preliminary demographic data<br />
were collected in 1954 by Johannes Wilbert (Wilbert and Layrisse 1980), but most<br />
information was collected by H. Dieter Heinen from 1966 to 1976 (Layrisse, Heinen,<br />
and Salas 1977). The sample covered 1,360 individuals. Age groups for adult ages<br />
are ten years, and the last category is 50+.<br />
PDR 33.2 Gurven-Kaplan-FINAL.indd 358 5/22/07 2:16:55 PM
M I C H A E L G U R V E N / H I L L A R D K A P L A N 3 5 9<br />
The Northern Territory Australian Aborigine mortality data come from analysis of<br />
vital registration from 1958 to 1960 by Frank Lancaster Jones (1963, 1965). At that<br />
time, few Aborigines in the region remained full-time foragers. There was substantial<br />
age-clumping at five-year intervals, so a smoothing procedure was performed on the<br />
population age distribution. It is likely that infant deaths and more remote-living individuals<br />
were underenumerated, and Lancaster Jones made adjustments to impute<br />
missing deaths. We view these data with caution but include them because no other<br />
reliable data exist for Australia, apart from the Tiwi sample, which was culled from<br />
the same author and is also included here although it suffers from the same limitations.<br />
We also include data by Crotty and Webb (1960) on causes of death based on<br />
autopsy for 175 Northern Territory Aborigines during the same time period.<br />
Notes<br />
This article benefited from helpful comments<br />
and conversations with Ed Bedrick, Tim<br />
Gage, Kim Hill, Nancy Howell, Jamie Holland<br />
Jones, and Robert Walker. Research was<br />
supported by the National Science Foundation<br />
(BCS-0422690) and the National Institutes<br />
of Health/National Institute on Aging<br />
(#1R01AG024119-01).<br />
1 Age-independent mortality (a ) is 2<br />
not statistically significant for the Agta, but<br />
initial adult mortality (a ) is about 150 times<br />
3<br />
greater than in other foragers. Part of this<br />
high effect is compensation due to the lack<br />
of age-independent mortality <strong>among</strong> Agta<br />
(Gage and Dyke 1986). Correspondingly, the<br />
senescence rate (b ) is less than one-half that<br />
3<br />
of other foragers.<br />
2 These analyses, however, did not<br />
control for age-independent mortality (a ), a 2<br />
factor which could bias Gompertz estimates<br />
(Gavrilov and Gavrilova 2001).<br />
3 A second approach to examining departures<br />
from linear increases in mortality<br />
hazards is to introduce a second-order age<br />
term in the Gompertz model: lnh(x) = a + b x 3 3<br />
+ b x 4 2 . Of the most reliable cases, positive statistically<br />
significant values for b are found for<br />
4<br />
Hadza, Ache, Hiwi, !Kung, Yanomamo, and<br />
Tsimane, indicating that the hazard increases<br />
at an increasing rate with age. Only the<br />
settled Ache and recent !Kung did not show a<br />
significant positive second-order term.<br />
4 Indeed, Howell (1979) shows that the<br />
estimated life expectancy of acculturated<br />
!Kung based on this life table is about 50<br />
years, which is ten years higher than the national<br />
estimate of Botswana during the same<br />
time period.<br />
5 In a stable age distribution, R =exp(rT),<br />
0<br />
where R is the net reproductive rate, r is<br />
0<br />
population growth rate, and T is the average<br />
generation length, set here as 28 years. We<br />
define R ≈R*l =TFR/2.06*l , where TFR is<br />
0 25 25<br />
the total fertility rate. Based on a regression of<br />
l on l , we estimate l as 0.9973*l – 0.0422<br />
25 15 25 15<br />
(R2 =0.98, p
3 6 0 L O N G E V I T Y A M O N G H U N T E R - G A T H E R E R S<br />
References<br />
Armelagos, G. J., A. H. Goodman, and K. Jacobs. 1991. “The origins of agriculture: Population<br />
growth during a period of declining health,” Population and Environment 13: 9–22.<br />
Bahuchet, S. (ed.). 1979. Pygmées de Centrafrique: études ethnologiques, historiques et linguistiques sur<br />
les Pygmées “BaMbenga” du Nord-Ouest du bassin congolais. Paris: SELAF.<br />
Barker, D. J. P. and C. Osmond. 1986. “Infant mortality, childhood nutrition, and ischaemic<br />
heart disease in England and Wales 1986,” Lancet i: 1077–1081.<br />
Beise, J. and E. Voland. 2002. “A multilevel event history analysis of the effects of grandmothers<br />
on child mortality in a historical German population: Krummhörn, Ostfriesland,<br />
1720–1874,” Demographic Research 7: 469–498.<br />
Bengtsson, T. and M. Lindström. 2000. “Childhood misery and disease in later life: The effects<br />
on mortality in old age of hazards experienced in early life, southern Sweden, 1760–1894,”<br />
Population Studies 54: 263–277.<br />
Berkeley Mortality Database. Berkeley: University of California. «http://www.mortality.org».<br />
Binford, L. R. and W. J. J. Chasko. 1976. “Nunamiut demographic history: A provocative case,”<br />
in Demographic Anthropology: Quantitative Approaches. Albuquerque: University of New<br />
Mexico, pp. 63–143.<br />
Black, F. L. 1975. “Infectious disease in primitive societies,” Science 187: 515–518.<br />
Blackwell, D. L., M. D. Hayward, and E. M. Crimmins. 2001. “Does childhood health affect<br />
chronic morbidity in later life?,” Social Science & Medicine 52: 1269–1284.<br />
Blurton Jones, N. G., K. Hawkes, and J. O’Connell. 2002. “The antiquity of postreproductive<br />
life: Are there modern impacts on hunter-gatherer postreproductive lifespans?,” Human<br />
Biology 14: 184–205.<br />
Blurton Jones, N. G., J. F. O’Connell, K. Hawkes, C. L. Kamuzora, and L. C. Smith. 1992. “Demography<br />
of the Hadza, an increasing and high density population of savanna foragers,”<br />
American Journal of Physical Anthropology 89: 159–181.<br />
Brainard, J. 1986. “Differential mortality in Turkana agri<strong>cultural</strong>ists and pastoralists,” American<br />
Journal of Physical Anthropology 70: 525–536.<br />
Buikstra, J. E. 1997. “Paleodemography: Context and promise,” in R. R. Paine (ed.), Integrating<br />
Archaeological Demography: Multidisciplinary Approaches to Prehistoric Population. Carbondale,<br />
IL: Center for Archaeological Investigations, pp. 367–380.<br />
Buikstra, J. E. and L. W. Konigsberg. 1985. “Paleodemography: Critiques and controversies,”<br />
American Anthropologist 87: 316–333.<br />
Cameron, N. and E. W. Demerath. 2002. “Critical periods in human growth and their relationship<br />
to diseases of aging,” American Journal of Physical Anthropology 35(Suppl.): 159–184.<br />
Caspari, R. and S.-H. Lee. 2004. “Older age becomes common late in human evolution,” Proceedings<br />
of the National Academy of Sciences of the United States of America 101: 10895–10900.<br />
Chagnon, N. 1968. Yanomamo: The Fierce People. New York: Holt, Rinehart and Winston.<br />
Cheung, S. L. K., J.-M. Robine, E. Jow-Ching, and G. Caselli. 2005. “Three dimensions of the<br />
survival curve: Horizontalization, verticalization, and longevity extension,” Demography<br />
42: 243–258.<br />
Coale, A. J. and P. Demeny. 1966. Regional Model Life Tables and Stable Populations. Princeton:<br />
Princeton University Press.<br />
Cockburn, T. A. 1971. “Infectious diseases in ancient populations,” Current Anthropology 12:<br />
45–62.<br />
Cohen, M. N. and G. J. Armelagos. 1984. “Paleopathology at the origins of agriculture: Editor’s<br />
summation. [Conference on Paleopathology and Socioeconomic Change at the Origins<br />
of Agriculture],” in M. N. Cohen and G. J. Armelagos (eds.), Paleopathology at the Origins<br />
of Agriculture. Orlando: Academic Press, pp. 585–601.<br />
Costa, D. L. 2000. “Understanding the twentieth-century decline in chronic conditions <strong>among</strong><br />
older men,” Demography 37: 53–72.<br />
Crotty, J. M. and R. C. Webb. 1960. “Mortality in Northern Territory aborigines,” Medical Journal<br />
of Australia 47: 489–492.<br />
PDR 33.2 Gurven-Kaplan-FINAL.indd 360 5/22/07 2:16:56 PM
M I C H A E L G U R V E N / H I L L A R D K A P L A N 3 6 1<br />
Cutler, R. 1975. “Evolution of human longevity and the genetic complexity governing aging<br />
rate,” Proceedings of the National Academy of Science of the United States of America 72:<br />
664–668.<br />
Dunn, F. L. 1968. “Epidemiological factors: Health and disease in hunter-gatherers,” in R. B.<br />
Lee and I. DeVore (eds.), Man the <strong>Hunter</strong>. Chicago: Aldine.<br />
Dyke, B., T. B. Gage, P. L. Alford, B. Senson, and S. Williams-Blangero. 1995. “A model life<br />
table for captive chimpanzees,” American Journal of Primatology 37: 25–37.<br />
Early, J. D. and T. N. Headland. 1998. Population Dynamics of a Philippine Rain Forest People: The<br />
San Ildefonso Agta. Gainesville: University Press of Florida.<br />
Early, J. D. and J. F. Peters. 2000. The Xilixana Yanomami of the Amazon: History, Social Structure,<br />
and Population Dynamics. Gainsville: University Press of Florida.<br />
Eaton, S. B. et al. 1994. “Women’s reproductive cancers in evolutionary context,” Quarterly<br />
Review of Biology 69: 353–367.<br />
Eaton, S. B., M. J. Konner, and M. Shostak. 1988. “Stone agers in the fast lane: Chronic degenerative<br />
diseases in evolutionary perspective,” American Journal of Medicine 84: 739–749.<br />
Eder, J. F. 1987. On the Road to Tribal Extinction: Depopulation, Deculturation, and Adaptive Well-Being<br />
<strong>among</strong> the Batak of the Philippines. Berkeley: University of California Press.<br />
Elo, I. T. and S. H. Preston. 1992. “Effects of early-life conditions on adult mortality: A review,”<br />
Population Index 58: 186–212.<br />
Ferguson, R. B. 1995. Yanomami Warfare: A Political History. Santa Fe: School for American<br />
Research Press.<br />
Finch, C. E. and E. M. Crimmins. 2004. “Inflammatory exposure and historical changes in human<br />
life-spans,” Science 305: 1736–1739.<br />
Finch, C. E., M. C. Pike, and M. Whitten. 1990. “Slow mortality rate accelerations during aging<br />
in animals approximate that of humans,” Science 249: 902–905.<br />
Fogel, R. W. and D. L. Costa. 1997. “A theory of technophysio evolution, with some implications<br />
for forecasting population, health care costs, and pension costs,” Demography 34: 49–66.<br />
Fouts, H. N., B. S. Hewlett, and M. E. Lamb. 2005. “Parent-offspring weaning conflicts <strong>among</strong><br />
the Bofi farmers and foragers of Central Africa,” Current Anthropology 46: 29–50.<br />
Fries, J. F. 1989. “The compression of morbidity: Near or far?,” Milbank Quarterly 67: 208–<br />
232.<br />
Gage, T. B. 1989. “Bio-mathematical approaches to the study of human variation in mortality,”<br />
Yearbook of Physical Anthropology 32: 185–214.<br />
———. 1991. “Causes of death and the components of mortality: Testing the biological interpretations<br />
of a competing hazards model,” American Journal of Human Biology 3: 289–300.<br />
———. 1998. “The comparative demography of primates: With some comments on the evolution<br />
of life histories,” Annual Review of Anthropology 27: 197–221.<br />
Gage, T. B. and B. Dyke. 1986. “Parameterizing abridged mortality tables: The Siler three-component<br />
hazard model,” Human Biology 58: 275–291.<br />
Gavrilov, L. A. and N. S. Gavrilova. 1991. The Biology of the Lifespan: A Quantitative Approach. New<br />
York: Harwood Academic.<br />
———. 2001. “The reliability theory of aging and longevity,” Journal of Theoretical Biology 213:<br />
527–545.<br />
Gurven, M. D. and H. S. Kaplan. 2006. “Determinants of time allocation to production a<strong>cross</strong><br />
the lifespan <strong>among</strong> the Machiguenga and Piro Indians of Peru,” Human Nature 17:<br />
1–49.<br />
Gurven, M., H. Kaplan, and A. Zelada. 2007 “Mortality experience of Tsimane Amerindians of<br />
Bolivia: Regional and temporal trends,” American Journal of Human Biology 19: 376–398.<br />
Haldane, J. B. S. 1942. New Paths in Genetics. London: Harper and Brothers.<br />
Hamilton, W. D. 1966. “The molding of senescence by natural selection,” Journal of Theoretical<br />
Biology 12: 12–45.<br />
Harako, R. 1981. “The <strong>cultural</strong> ecology of hunting behavior <strong>among</strong> the Mbuti Pygmies in the<br />
Ituri Forest, Zaïre,” in R. S. O. Harding and G. Teleki (eds.), Omnivorous Primates: Gathering<br />
and Hunting in Human Evolution. New York: Columbia University Press, pp. 499–555.<br />
PDR 33.2 Gurven-Kaplan-FINAL.indd 361 5/22/07 2:16:56 PM
3 6 2 L O N G E V I T Y A M O N G H U N T E R - G A T H E R E R S<br />
Harpending, H. C. and L. Wandsnider. 1982. “Population structures of Ghanzi and Ngamiland<br />
!Kung,” Current Developments in Anthropological Genetics 2: 29–50.<br />
Hawkes, K. and J. O’Connell. 2005. “How old is human longevity?,” Journal of Human Evolution<br />
49: 650–653.<br />
Hawkes, K., J. F. O’Connell, N. G. Blurton Jones, H. Alvarez, and E. L. Charnov. 1998. “Grandmothering,<br />
menopause, and the evolution of human life histories,” Proceedings of the<br />
National Academy of Sciences of the United States of America 95(3): 1336–1339.<br />
Headland, T. N. 1997. “Revisionism in ecological anthropology,” Current Anthropology 38:<br />
605–630.<br />
Herrmann, N. P. and L. W. Konigsberg. 2002. “A re-<strong>examination</strong> of the age-at-death distribution<br />
of Indian Knoll,” in R. D. Hoppa and J. W. Vaupel (eds.), Paleodemography: Age Distributions<br />
from Skeletal Samples. Cambridge: Cambridge University Press, pp. 243–257.<br />
Hewlett, B. S. 1991. “Demography and childcare in preindustrial societies,” Journal of Anthropological<br />
Research 47: 1–37.<br />
Hewlett, B. S., J. M. H. van de Koppel, and M. van de Koppel. 1986. “Causes of death <strong>among</strong><br />
Aka pygmies of the Central African Republic,” in L. L. Cavalli Sforza (ed.), African Pygmies.<br />
New York: Academic Press.<br />
Hill, K. et al. 2001. “Mortality rates <strong>among</strong> wild chimpanzees,” Journal of Human Evolution 40:<br />
437–450.<br />
Hill, K. and A. M. Hurtado. 1991. “The evolution of reproductive senescence and menopause<br />
in human females,” Human Nature 2: 315–350.<br />
———. 1996. Ache Life History: The Ecology and Demography of a Foraging People. New York: Aldine<br />
de Gruyter.<br />
Hill, K., A. M. Hurtado, and R. Walker. 2007. “High adult mortality <strong>among</strong> Hiwi hunter-gatherers:<br />
Implications for human evolution,” Journal of Human Evolution 52: 443–454.<br />
Hoppa, R. D. and J. W. Vaupel (eds.). 2002. Paleodemography: Age Distributions from Skeletal<br />
Samples. Cambridge: Cambridge University Press.<br />
Howell, N. 1976. “Toward a uniformitarian theory of human paleodemography,” in R. H.<br />
Ward and K. M. Weiss (eds.), The Demographic Evolution of Human Populations. New York:<br />
Academic Press, pp. 25–40.<br />
———. 1979. Demography of the Dobe !Kung. New York: Academic Press.<br />
Human Mortality Database. University of California, Berkeley (USA), and Max Planck Institute<br />
for Demographic Research (Germany). Available at «www.mortality.org». Downloaded<br />
8 May 2005.<br />
Hurtado, A. M. and K. R. Hill. 1987. “Early dry season subsistence ecology of the Cuiva foragers<br />
of Venezuela,” Human Ecology 15: 163–187.<br />
———. 1990. “Seasonality in a foraging society: Variation in diet, work effort, fertility, and the<br />
sexual division of labor <strong>among</strong> the Hiwi of Venezuela,” Journal of Anthropological Research<br />
46: 293–345.<br />
Jamison, C., L. Cornell, P. Jamison, and H. Nakazato. 2002. “Are all grandmothers equal? A review<br />
and a preliminary test of the grandmother hypothesis in Tokugawa Japan,” American<br />
Journal of Physical Anthropology 119: 67–76.<br />
Johnson, P. L. 1981. “When dying is better than living: Female suicide <strong>among</strong> the Gainj of Papua<br />
New Guinea,” Ethnology 20: 325–334.<br />
Kannisto, V. 2001. “Mode and dispersion of the length of life,” Population: An English Selection<br />
13: 159–171.<br />
Kaplan, H. S. 1997. “The evolution of the human life course,” in K. Wachter and C. Finch (eds.),<br />
Between Zeus and Salmon: The Biodemography of Aging. Washington, DC: National Academy<br />
of Sciences, pp. 175–211.<br />
Kaplan, H. S., K. Hill, A. M. Hurtado, J. Lancaster, and A. J. Robson. 2001. Embodied Capital and<br />
the Evolutionary Economics of the Human Lifespan. Albuquerque: University of New Mexico.<br />
Kaplan, H. S., K. Hill, J. B. Lancaster, and A. M. Hurtado. 2000. “A theory of human life history<br />
evolution: Diet, intelligence, and longevity,” Evolutionary Anthropology 9: 156–185.<br />
PDR 33.2 Gurven-Kaplan-FINAL.indd 362 5/22/07 2:16:56 PM
M I C H A E L G U R V E N / H I L L A R D K A P L A N 3 6 3<br />
Kaplan, H. S. and A. J. Robson. 2002. “The emergence of humans: The coevolution of intelligence<br />
and longevity with intergenerational transfers,” Proceedings of the National Academy<br />
of Sciences of the United States of America 99: 10221–10226.<br />
Kelly, R. L. 1995. The Foraging Spectrum: Diversity in <strong>Hunter</strong>-Gatherer Lifeways. Washington, DC:<br />
Smithsonian Institution Press.<br />
Kennedy, G. E. 2003. “Palaeolithic grandmothers? Life history theory and early Homo,” Journal<br />
of the Royal Anthropological Institute 9: 549–572.<br />
King, J. L. and T. H. Jukes. 1969. “Non-Darwinian evolution,” Science 164: 788–798.<br />
Konigsberg, L. W. and N. P. Herrmann. 2006. “The osteological evidence for human longevity<br />
in the recent past,” in K. Hawkes and R. R. Paine (eds.), The Evolution of Human Life History.<br />
Santa Fe: School of American Research Press, pp. 267–306.<br />
Kuh, D. and Y. Ben-Shlomo. 1997. A Life Course Approach to Chronic Disease Epidemiology. Oxford:<br />
Oxford University Press.<br />
Lahdenpera, M., V. Lummaa, S. Helle, T. Marc, and R. A. F. 2004. “Fitness benefits of prolonged<br />
post-reproductive lifespan in women,” Nature 428: 178–181.<br />
Lancaster, J. B. and B. J. King. 1985. “An evolutionary perspective on menopause,” in V. Kerns<br />
and J. K. Brown (eds.), In Her Prime: A New View of Middle-Aged Women. S. Hadley, MA:<br />
Bergin and Garvey, pp. 13–20.<br />
Lancaster Jones, F. 1963. A Demographic Survey of the Aboriginal Population of the Northern Territory,<br />
with Special Reference to Bathurst Island Mission. Canberra: Australian Institute of Aboriginal<br />
Studies.<br />
———. 1965. “The demography of the Australian Aborigines,” International Social Science Journal<br />
17: 232–245.<br />
Layrisse, M., H. D. Heinen, and G. Salas. 1977. “Demografía de los indígenas Warao,” Antropológica<br />
46: 45–69.<br />
Layrisse, M., G. Salas, and H. D. Heinen. 1980. “Vital statistics of five Warao subtribes,” in Johannes<br />
Wilbert and Miguel Layrisse (eds.), Demographic and Biological Studies of the Warao<br />
Indians. Los Angeles: UCLA Latin American Center, pp. 60–69.<br />
Lee, R. D. 2003. “Rethinking the evolutionary theory of aging: Transfers, not births, shape senescence<br />
in social species,” Proceedings of the National Academy of Sciences of the United States<br />
of America 100: 9637–9642.<br />
Lexis, W. 1878. “Sur la durée normale de la vie humaine et sur la théorie de la stabilité des<br />
rapports statistiques,” Annales de démographie internationale 2: 447–462.<br />
Lovejoy, C. O. et al. 1977. “Paleodemography of the Libben site, Ottawa County, Ohio,” Science<br />
198: 291–293.<br />
Makeham, W. M. 1860. “On the law of mortality and the construction of annuity tables,” Journal<br />
of the Institute of Actuaries 8: 301–310.<br />
Medawar, P. B. 1952. An Unsolved Problem in Biology. London: Lewis.<br />
Mensforth, R. 1990. “Paleodemography of the Carlston-Annis [Bt-5] late archaic skeletal population,”<br />
American Journal of Physical Anthropology 82: 81–99.<br />
Neel, J. V. and K. M. Weiss. 1975. “The genetic structure of a tribal population, the Yanomama<br />
Indian,” American Journal of Physical Anthropology 42: 25–52.<br />
O’Connell, J. F., K. Hawkes, and N. G. Blurton Jones. 1999. “Grandmothering and the evolution<br />
of Homo erectus,” Journal of Human Evolution 36: 461–485.<br />
Oeppen, J. and J. W. Vaupel. 2003. “Broken limits to life expectancy,” Science 296: 1029–<br />
1031.<br />
Olshansky, S. J. and B. A. Carnes. 1997. “Ever since Gompertz,” Demography 34: 1–15.<br />
Packer, C. M. Tatar, and A. Collins. 1998. “Reproductive cessation in female mammals,” Nature<br />
392: 807–811.<br />
Peccei, J. S. 2001. “Menopause: Adaptation or epiphenomenon?,” Evolutionary Anthropology<br />
10: 43–57.<br />
Pennington, R. L. 1996. “Causes of early human population growth,” American Journal of Physical<br />
Anthropology 99: 259–274.<br />
PDR 33.2 Gurven-Kaplan-FINAL.indd 363 5/22/07 2:16:57 PM
3 6 4 L O N G E V I T Y A M O N G H U N T E R - G A T H E R E R S<br />
———. 2001. “<strong>Hunter</strong>-gatherer demography,” in C. Panter-Brick, R. Layton, and P. Rowley-<br />
Conwy (eds.), <strong>Hunter</strong>-<strong>Gatherers</strong>: An Interdisciplinary Perspective. Cambridge: Cambridge<br />
University Press, pp. 170–204.<br />
Pennington, R. L. and H. Harpending. 1993. The Structure of an African Pastoralist Community:<br />
Demography, History, and Ecology of the Ngamiland Herero. Oxford: Clarendon Press.<br />
Picchi, D. 1994. “Observations about a central Brazilian indigenous population: The Bakairi,”<br />
South American Indian Studies 4: 37–46.<br />
Ribeiro, D. 1967. “Indigenous cultures and languages of Brazil,” in J. H. Hopper (ed.), Indians<br />
of Brazil in the Twentieth Century. Washington, DC: Institute for Cross-Cultural Research,<br />
pp. 77–166.<br />
Richerson, P. J., R. L. Bettinger, and R. Boyd. 2005. “Evolution on a restless planet: Were environmental<br />
variability and environmental change major drivers of human evolution?,” in<br />
F. M. Wuketits and F. J. Ayala (eds.), Handbook of Evolution, Vol. 2: The Evolution of Living<br />
Systems. Weinheim, Germany: Wiley-VCH.<br />
Ricklefs, R. and A. Scheuerlein. 2002. “Biological implications of the Weibull and Gompertz<br />
models of aging,” Journal of Gerontology Biological Sciences 57A: B69–B76.<br />
Riggs, J. E. 1990. Longitudinal Gompertzian analysis of adult mortality in the US, 1900–1986,”<br />
Mechanisms of Ageing and Development 54: 235–247.<br />
Riggs, J. E., G. R. Hobbs, and R. Gerald. 1998. “Nonrandom sequence of slope-intercept estimates<br />
in longitudinal Gompertzian analysis suggests biological relevance,” Mechanisms of<br />
Ageing and Development 100: 269–275.<br />
Riggs, J. E. and R. J. Millecchia. 1992. “Using the Gompertz-Strehler model of aging and mortality<br />
to explain mortality trends in industrialized countries,” Mechanisms of Ageing and<br />
Development 65: 217–228.<br />
Riley, J. 2001. Rising Life Expectancy: A Global History. Cambridge: Cambridge University Press.<br />
Rose, F. G. G. 1960. Classification of Kin, Age Structure and Marriage Amongst the Groote Eylandt<br />
Aborigines. Oxford: Pergamon Press.<br />
Rose, M. R. 1991. Evolutionary Biology of Aging. New York: Oxford University Press.<br />
Roth, E. A. 1981. “Sedentism and changing fertility patterns in a northern Athapascan isolate,”<br />
Journal of Human Evolution 10: 413–425.<br />
Roth, E. A. and A. K. Ray. 1985. “Demographic patterns of sedentary and nomadic Juang of<br />
Orissa,” Human Biology 57: 319–325.<br />
Salzano, F. M. and S. M. Callegari-Jacques. 1988. South American Indians: A Case Study in Evolution.<br />
Oxford: Clarendon Press.<br />
Sear, R., R. Mace, and I. A. McGregor. 2000. “Maternal grandmothers improve the nutritional<br />
status and survival of children in rural Gambia,” Proceedings of the Royal Society of London,<br />
Series B 267: 1641–1647.<br />
Sear, R., F. Steele, I. A. McGregor, and R. Mace. 2002. “The effects of kin on child mortality in<br />
rural Gambia,” Demography 39: 43–63.<br />
Shock, N. W. 1981. “Indices of functional age,” in D. Danon, N. W. Shock, and M. Marois (eds.),<br />
Aging: A Challenge to Science and Society. Oxford: Oxford University Press, pp. 302–319.<br />
Siler, W. 1979. “A competing-risk model for animal mortality,” Ecology 60: 750–757.<br />
Solway, J. S. and R. B. Lee. 1990. “Foragers, genuine or spurious?: Situating the Kalahari San<br />
in history,” Current Anthropology 31: 109–146.<br />
Strehler, B. L. and A. S. Mildvan. 1960. “General theory of mortality and aging,” Science 132:<br />
14–21.<br />
United Nations. 2007. World Population Prospects: The 2006 Revision. Population database «http://<br />
esa.un.org/unpp/».<br />
Vallois, H. V. 1961. “The social life of early man: The evidence of skeletons,” in S. L. Washburn<br />
(ed.), Social Life of Early Man. Chicago: Aldine de Gruyter, pp. 214–235.<br />
Vaupel, J. W. 1997. “The remarkable improvements in survival at older ages,” Philosophical<br />
Transactions of the Royal Society of London, B 352: 1799–1804.<br />
Walker, P. L., J. R. Johnson, and P. M. Lambert. 1988. “Age and sex biases in the preservation<br />
of human skeletal remains,” American Journal of Physical Anthropology 76: 183–188.<br />
PDR 33.2 Gurven-Kaplan-FINAL.indd 364 5/22/07 2:16:57 PM
M I C H A E L G U R V E N / H I L L A R D K A P L A N 3 6 5<br />
Wang, E. T., G. Kodama, P. Baldi, and R. K. Moyzis. 2006. “Global landscape of recent inferred<br />
Darwinian selection for Homo sapiens,” Proceedings of the National Academy of Sciences of the<br />
United States of America 103: 135–140.<br />
Weale, R. A. 2004. “Biorepair mechanisms and longevity,” Journal of Gerontology 59A: 449–<br />
454.<br />
Weiss, K. M. 1973. Demographic Models for Anthropology: Memoirs of the Society for American Archaeology,<br />
27. American Antiquity, 38.<br />
———. 1981. “Evolutionary perspectives on human aging,” in P. Amoss and S. Harrell (eds.),<br />
Other Ways of Growing Old. Stanford: Stanford University Press, pp. 25–28.<br />
———. 1989. “Are the known chronic diseases related to the human lifespan and its evolution?,”<br />
American Journal of Human Biology 1: 307–319.<br />
Wilbert, J. and M. Layrisse (eds.). 1980. Demographic and Biological Studies of the Warao Indians.<br />
Los Angeles: UCLA Latin American Center Publications.<br />
Williams, G. C. 1957. “Pleitropy, natural selection and the evolution of senescence,” Evolution<br />
11: 398–411.<br />
Wilmoth, J. R. 1998. “The future of human longevity: A demographer’s perspective,” Science<br />
280: 281–295.<br />
Wilmoth, J. R., J. Vallin, and G. Caselli. 1990. “When does a cohort’s mortality differ from what<br />
we might expect?,” Population: An English Selection 2: 93–126.<br />
Wood, J. W. 1980. “Mechanisms of demographic equilibrium in a small human population, the<br />
Gainj of Papua New Guinea,” Ph.D. dissertation, University of Michigan.<br />
———. 1987. “The genetic demography of the Gainj of Papua New Guinea. 2. Determinants of<br />
effective population size,” American Naturalist 129(2): 165–187.<br />
Wood, J. W. et al. 1982. “The genetic demography of the Gainj of Papua New Guinea. I. Local<br />
differentiation of blood group, red cell enzyme, and serum protein allele frequencies,”<br />
American Journal of Physical Anthropology 57: 15–25.<br />
Wood, J. W., D. J. Holman, K. A. O’Connor, and R. J. Ferrell. 2002. “Mortality models for paleodemography,”<br />
in R. D. Hoppa and J. W. Vaupel (eds.), Paleodemography: Age Distributions<br />
from Skeletal Samples. Cambridge: Cambridge University Press, pp. 129–168.<br />
Wood, J. W. and P. E. Smouse. 1982. “A method of analyzing density-dependent vital rates<br />
with an application to the Gainj of Papua New Guinea,” American Journal of Physical Anthropology<br />
58: 403–411.<br />
Wood, J. W., S. C. Weeks, G. R. Bentley, and K. M. Weiss. 1994. “Human population biology<br />
and the evolution of aging,” in D. E. Crews and R. M. Garruto (eds.), Biological Anthropology<br />
and Aging: Perspectives on Human Variation over the Life Span. New York: Oxford University<br />
Press, pp. 19–75.<br />
Yashin, A. I., A. S. Begun, S. I. Boiko, S. V. Ukraintseva, and J. Oeppen. 2001. “The new trends<br />
in survival improvement require a revision of traditional gerontological concepts,” Experimental<br />
Gerontology 37: 157-167.<br />
PDR 33.2 Gurven-Kaplan-FINAL.indd 365 5/22/07 2:16:57 PM
PDR 33.2 Gurven-Kaplan-FINAL.indd 366 5/22/07 2:16:57 PM