ARCS materials - Spallation Neutron Source - Oak Ridge National ...
ARCS materials - Spallation Neutron Source - Oak Ridge National ...
ARCS materials - Spallation Neutron Source - Oak Ridge National ...

You also want an ePaper? Increase the reach of your titles
YUMPU automatically turns print PDFs into web optimized ePapers that Google loves.
Intensity (arb. units)<br />
4000<br />
3000<br />
2000<br />
1000<br />
0<br />
600<br />
400<br />
200<br />
(ζ,0,2)<br />
(ζ,0,0)<br />
FeGe 2<br />
T=275 K<br />
Fe(Ge 0.96 Ga 0.04 ) 2<br />
0<br />
0.7 0.8 0.9 1.0<br />
ζ<br />
1.1 1.2 1.3<br />
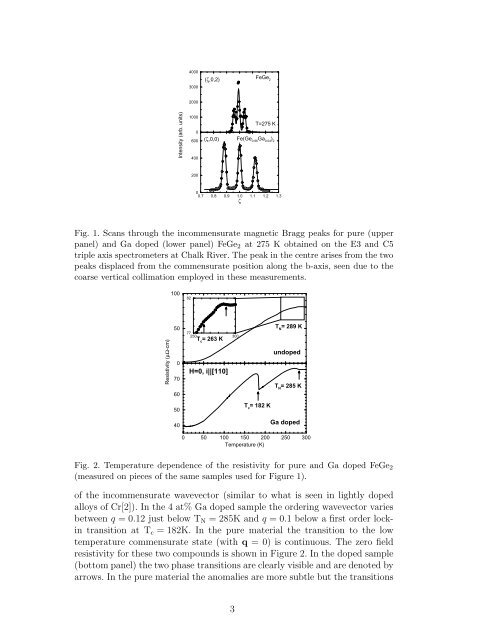
Fig. 1. Scans through the incommensurate magnetic Bragg peaks for pure (upper<br />
panel) and Ga doped (lower panel) FeGe2 at 275 K obtained on the E3 and C5<br />
triple axis spectrometers at Chalk River. The peak in the centre arises from the two<br />
peaks displaced from the commensurate position along the b-axis, seen due to the<br />
coarse vertical collimation employed in these measurements.<br />
Resistivity (µΩ-cm)<br />
Resistivity (µΩ-cm) Resistivity (µΩ-cm)<br />
100<br />
50<br />
Resistivity (µΩ-cm)<br />
0<br />
70<br />
60<br />
50<br />
40<br />
82<br />
77<br />
250 300<br />
Temperature Tc = 263 K (K)<br />
H=0, i||[110]<br />
T c = 182 K<br />
T N = 289 K<br />
undoped<br />
T N = 285 K<br />
Ga doped<br />
0 50 100 150 200 250 300<br />
Temperature (K)<br />
Fig. 2. Temperature dependence of the resistivity for pure and Ga doped FeGe2<br />
(measured on pieces of the same samples used for Figure 1).<br />
of the incommensurate wavevector (similar to what is seen in lightly doped<br />
alloys of Cr[2]). In the 4 at% Ga doped sample the ordering wavevector varies<br />
between q = 0.12 just below TN = 285K and q = 0.1 below a first order lockin<br />
transition at Tc = 182K. In the pure material the transition to the low<br />
temperature commensurate state (with q = 0) is continuous. The zero field<br />
resistivity for these two compounds is shown in Figure 2. In the doped sample<br />
(bottom panel) the two phase transitions are clearly visible and are denoted by<br />
arrows. In the pure material the anomalies are more subtle but the transitions<br />
3