2005 - National Center for Charitable Statistics - Urban Institute
2005 - National Center for Charitable Statistics - Urban Institute
2005 - National Center for Charitable Statistics - Urban Institute

Create successful ePaper yourself
Turn your PDF publications into a flip-book with our unique Google optimized e-Paper software.
THE URBAN INSTITUTE <strong>Center</strong> on Nonprofits and Philanthropy<br />
<strong>National</strong> <strong>Center</strong> <strong>for</strong> <strong>Charitable</strong> <strong>Statistics</strong> Phone: 202-261-5790<br />
Fax: 202-833-6231<br />
PROFILES OF INDIVIDUAL CHARITABLE CONTRIBUTIONS BY STATE, <strong>2005</strong>*<br />
INTRODUCTION<br />
Each summer, the Internal Revenue Service publishes selected data from individual tax returns filed during the<br />
previous calendar year that include ranges of adjusted gross income (AGI) and deductions <strong>for</strong> charitable<br />
donations. The <strong>National</strong> <strong>Center</strong> <strong>for</strong> <strong>Charitable</strong> <strong>Statistics</strong> at the <strong>Urban</strong> <strong>Institute</strong> has summarized charitable giving<br />
by state and tracks changes in charitable giving across states and over time.<br />
DATA LIMITATIONS<br />
The source of the data on charitable giving is the <strong>Statistics</strong> of Income Bulletin published by the Internal<br />
Revenue Service. Since only returns with itemized contributions are included, IRS data do not account <strong>for</strong> all<br />
contributions. In <strong>2005</strong>, only 36 percent of US taxpayers chose to itemize deductions on their returns. This<br />
means that 64 percent of US taxpayers take the standard deduction, and thus, no details on their charitable<br />
contributions are available. No one knows how much non-itemizers donate to charity, although some<br />
researchers have created estimates. For example, Giving USA, published by the AAFRC Trust <strong>for</strong><br />
Philanthropy, estimates that total individual giving in the US was $260.3 billion in <strong>2005</strong> due to a large<br />
philanthropic response to an unusual sequence of three major natural disasters. Based on this estimate, the<br />
total of $181 billion reported as itemized contributions on <strong>2005</strong> tax returns represents about 70 percent of all<br />
individual giving. The <strong>2005</strong> data on itemized deductions used in this analysis, there<strong>for</strong>e, cover about a third of<br />
US taxpayers and probably account <strong>for</strong> three quarters of the charitable contributions. Thus, in spite of the<br />
limitations, analyses of the data can provide in<strong>for</strong>mation on giving patterns.<br />
FINDINGS<br />
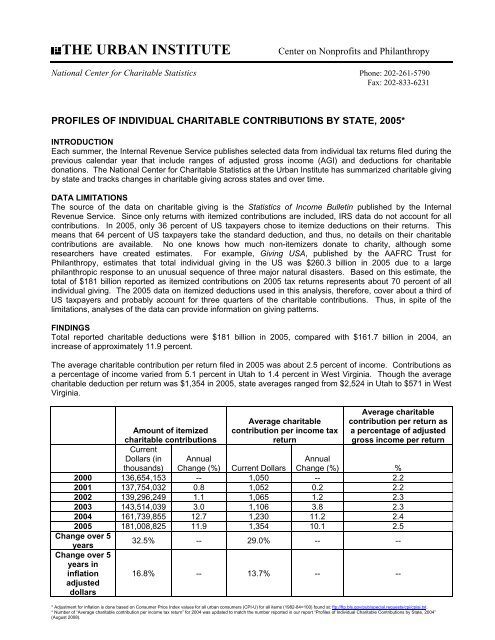
Total reported charitable deductions were $181 billion in <strong>2005</strong>, compared with $161.7 billion in 2004, an<br />
increase of approximately 11.9 percent.<br />
The average charitable contribution per return filed in <strong>2005</strong> was about 2.5 percent of income. Contributions as<br />
a percentage of income varied from 5.1 percent in Utah to 1.4 percent in West Virginia. Though the average<br />
charitable deduction per return was $1,354 in <strong>2005</strong>, state averages ranged from $2,524 in Utah to $571 in West<br />
Virginia.<br />
Average charitable<br />
Average charitable<br />
contribution per return as<br />
Amount of itemized contribution per income tax a percentage of adjusted<br />
charitable contributions<br />
Current<br />
return<br />
gross income per return<br />
Dollars (in Annual<br />
Annual<br />
thousands) Change (%) Current Dollars Change (%) %<br />
2000 136,654,153 -- 1,050 -- 2.2<br />
2001 137,754,032 0.8 1,052 0.2 2.2<br />
2002 139,296,249 1.1 1,065 1.2 2.3<br />
2003 143,514,039 3.0 1,106 3.8 2.3<br />
2004 161,739,855 12.7 1,230 11.2 2.4<br />
<strong>2005</strong> 181,008,825 11.9 1,354 10.1 2.5<br />
Change over 5<br />
years<br />
Change over 5<br />
years in<br />
32.5% -- 29.0% -- --<br />
inflation<br />
adjusted<br />
dollars<br />
16.8% -- 13.7% -- --<br />
* Adjustment <strong>for</strong> inflation is done based on Consumer Price Index values <strong>for</strong> all urban consumers (CPI-U) <strong>for</strong> all items (1982-84=100) found at: ftp://ftp.bls.gov/pub/special.requests/cpi/cpiai.txt.<br />
* Number of “Average charitable contribution per income tax return” <strong>for</strong> 2004 was updated to match the number reported in our report “Profiles of Individual <strong>Charitable</strong> Contributions by State, 2004”<br />
(August 2008).
COMPARING THE STATES<br />
One reason it is difficult to use tax return data to compare levels of charitable giving by individuals in different<br />
states is that there are wide disparities in the percentages of filers that itemize. For example, comparisons<br />
between states like Maryland, where 44.6 percent of all tax returns are itemized, and South Dakota, where 15.8<br />
percent of all tax returns are itemized, would probably provide limited in<strong>for</strong>mation.<br />
Moreover, states vary widely in average income per resident. In <strong>2005</strong>, Connecticut’s adjusted gross income<br />
(AGI) per return filed of $78,650 was the highest among the states, while Mississippi’s AGI of $ 38,766 was the<br />
lowest. The national average was $54,637. There<strong>for</strong>e, when giving is examined, giving as a percentage of<br />
income should be considered, in addition to the amount given.<br />
WHAT DO THE RANKINGS MEAN?<br />
As mentioned above, it is important to consider average income when examining rates of giving. The “average<br />
adjusted gross income per income tax return” rank shows the average income of tax return filers in each state.<br />
This rank provides a baseline against which level of giving can be compared.<br />
The “average charitable contribution per income tax return” rank is based on the total amount of charitable<br />
deductions itemized in a state divided by the total number of filers. Because contributions of the itemizers<br />
(between 14.4 and 44.6 percent of the state’s filers) are divided by the total number of returns in a state, this<br />
rank tends to be low if the percentage of returns with itemized charitable deductions is low. Average<br />
contribution per return is, at best, an approximation of giving in a state because it does not take into account<br />
whether or how much non-itemizers contribute.<br />
The “average charitable contribution per return as a percentage of adjusted gross income per return” rank<br />
adjusts the “average charitable contribution per income tax return” rank by taking income levels into account.<br />
This rank shows the average amount given relative to the average income per filer in a state. Again, this<br />
ranking does not account <strong>for</strong> charitable donations made by non-itemizers.<br />
OTHER SOURCES OF DATA ON GIVING<br />
IRS <strong>Statistics</strong> of Income Bulletin, various editions. Published four times a year. Presents selected data compiled<br />
from individual tax returns and broken down by state. The primary source <strong>for</strong> this report was made available in<br />
August 2007, at http://www.irs.gov/taxstats/article/0,,id=171535,00.html.<br />
Ellis L. Phillips Foundation. “Generosity Index.” http://www.ellislphillipsfndn.org/ or 617-424-7607<br />
The New Nonprofit Almanac & Desk Reference. 2008. The essential facts and figures <strong>for</strong> managers, researchers,<br />
and volunteers. Includes section on trends in private giving. Available from the <strong>Urban</strong> <strong>Institute</strong>.<br />
http://www.urban.org/ or 877-847-7377<br />
Foundation Giving. Published annually. Presents financial data on types of foundations (individual, corporate,<br />
community, and operating) and their areas of giving (arts, education, health, etc.). Includes some data on specific<br />
foundations. Available from the Foundation <strong>Center</strong>. http://www.fdncenter.org/<br />
Giving USA, a publication of AAFRC Trust <strong>for</strong> Philanthropy, researched and written by the <strong>Center</strong> on Philanthropy at<br />
Indiana University. Updated annually. Provides national data on sources of giving (individuals, foundations,<br />
corporations, bequests) and on categories of recipients. Available from AAFRC Trust <strong>for</strong> Philanthropy.<br />
http://www.aafrc.org/ or 800-462-2372<br />
2004 IRS Itemized Giving Zip Code Data. Available from the <strong>National</strong> <strong>Center</strong> <strong>for</strong> <strong>Charitable</strong> <strong>Statistics</strong> at The <strong>Urban</strong><br />
<strong>Institute</strong>. http://www.nccs.urban.org/ or 202-261-5397.<br />
<strong>National</strong> <strong>Center</strong> <strong>for</strong> <strong>Charitable</strong> <strong>Statistics</strong>. “Profiles of <strong>Charitable</strong> Giving by State,” 1998 through <strong>2005</strong>.<br />
http://nccsdataweb.urban.org or 202-261-5397.<br />
2
Data on Individual Giving by State, <strong>2005</strong> (dollars in thousands)<br />
Number of<br />
Returns<br />
Adjusted Gross<br />
Income<br />
Number of<br />
Itemized<br />
Returns<br />
Percentage of<br />
Itemized<br />
Returns<br />
Number of<br />
Returns with<br />
Itemized<br />
<strong>Charitable</strong><br />
Deductions<br />
Amount of<br />
Itemized<br />
<strong>Charitable</strong><br />
Deductions<br />
Average AGI<br />
<strong>for</strong> All Returns<br />
Average<br />
Contribution<br />
of Itemizers<br />
United States 133,663,209 $7,302,903,152 47,732,734 36% 41,275,243 $181,008,825 $54,637 $3,792<br />
Alabama 1,955,914<br />
Alaska 346,927<br />
Arizona 2,474,093<br />
Arkansas 1,153,654<br />
Cali<strong>for</strong>nia 15,572,877<br />
Colorado 2,160,153<br />
Connecticut 1,681,956<br />
Delaware 402,938<br />
District of Columbia 282,474<br />
Florida 8,411,496<br />
Georgia 3,917,976<br />
Hawaii 621,014<br />
Idaho 613,932<br />
Illinois 5,836,193<br />
Indiana 2,883,701<br />
Iowa 1,346,535<br />
Kansas 1,241,568<br />
Kentucky 1,779,856<br />
Louisiana 1,770,050<br />
Maine 621,150<br />
Maryland 2,674,329<br />
Massachusetts 3,083,021<br />
Michigan 4,562,770<br />
Minnesota 2,445,599<br />
Mississippi 1,169,598<br />
Missouri 2,610,839<br />
Montana 448,050<br />
Nebraska 816,053<br />
Nevada 1,150,204<br />
New Hampshire 650,233<br />
New Jersey 4,152,741<br />
New Mexico 843,476<br />
New York 8,715,913<br />
North Carolina 3,879,609<br />
North Dakota 307,235<br />
Ohio 5,459,548<br />
Oklahoma 1,495,579<br />
Oregon 1,645,481<br />
Pennsylvania 5,867,052<br />
Rhode Island 502,440<br />
South Carolina 1,885,351<br />
South Dakota 367,105<br />
Tennessee 2,657,790<br />
Texas 9,727,703<br />
Utah 1,030,683<br />
Vermont 309,831<br />
Virginia 3,540,757<br />
Washington 2,931,911<br />
West Virginia 753,593<br />
Wisconsin 2,656,046<br />
Wyoming 248,212<br />
88,628,735<br />
16,725,880<br />
135,510,440<br />
47,857,444<br />
970,448,917<br />
125,994,344<br />
132,285,344<br />
23,183,670<br />
19,712,600<br />
481,888,152<br />
199,214,881<br />
31,284,219<br />
28,226,440<br />
335,321,455<br />
134,324,776<br />
61,643,860<br />
60,483,659<br />
77,639,797<br />
77,629,149<br />
27,763,882<br />
170,124,868<br />
206,948,515<br />
226,438,921<br />
137,232,136<br />
45,340,179<br />
122,774,783<br />
18,315,335<br />
37,830,701<br />
72,209,472<br />
37,533,740<br />
282,306,218<br />
35,785,778<br />
552,244,486<br />
186,047,795<br />
12,970,269<br />
252,434,762<br />
66,783,183<br />
81,023,741<br />
299,493,501<br />
26,529,043<br />
84,321,938<br />
16,165,957<br />
123,251,823<br />
507,165,219<br />
51,060,650<br />
14,703,594<br />
214,671,763<br />
168,672,520<br />
30,318,090<br />
132,137,153<br />
14,299,375<br />
603,044<br />
88,077<br />
954,921<br />
287,936<br />
6,219,166<br />
913,957<br />
756,359<br />
149,792<br />
120,463<br />
2,776,749<br />
1,551,969<br />
208,043<br />
216,983<br />
2,134,444<br />
891,252<br />
429,495<br />
388,766<br />
554,060<br />
463,593<br />
196,777<br />
1,337,918<br />
1,287,789<br />
1,694,912<br />
1,033,388<br />
309,696<br />
833,106<br />
139,437<br />
253,156<br />
428,759<br />
237,741<br />
1,878,369<br />
226,931<br />
3,381,583<br />
1,415,903<br />
58,361<br />
1,887,513<br />
459,739<br />
688,536<br />
1,898,792<br />
191,745<br />
621,499<br />
70,354<br />
686,807<br />
2,528,425<br />
416,846<br />
94,853<br />
1,456,470<br />
1,090,705<br />
135,762<br />
1,025,544<br />
56,249<br />
31 541,002<br />
25 70,814<br />
39 826,288<br />
25 244,006<br />
40 5,336,371<br />
42 773,847<br />
45 677,964<br />
37 132,255<br />
43 105,252<br />
33 2,322,181<br />
40 1,365,436<br />
34 180,850<br />
35 181,860<br />
37 1,867,448<br />
31 744,916<br />
32 369,998<br />
31 335,194<br />
31 473,007<br />
26 369,163<br />
32 166,070<br />
50 1,192,798<br />
42 1,149,732<br />
37 1,489,540<br />
42 914,303<br />
26 262,176<br />
32 706,497<br />
31 114,960<br />
31 223,314<br />
37 361,102<br />
37 201,911<br />
45 1,697,824<br />
27 186,402<br />
39 3,071,129<br />
36 1,246,872<br />
19 48,536<br />
35 1,565,330<br />
31 391,399<br />
42 571,951<br />
32 1,673,963<br />
38 172,490<br />
33 551,156<br />
19 58,171<br />
26 587,026<br />
26 2,095,934<br />
40 375,675<br />
31 76,211<br />
41 1,263,525<br />
37 912,383<br />
18 108,320<br />
39 877,418<br />
23 43,273<br />
2,785,924<br />
275,757<br />
3,373,704<br />
1,594,538<br />
24,450,235<br />
3,152,757<br />
2,928,293<br />
534,422<br />
747,791<br />
11,346,130<br />
6,528,789<br />
599,716<br />
872,397<br />
7,616,811<br />
2,964,563<br />
1,284,346<br />
1,512,725<br />
1,795,410<br />
1,657,061<br />
481,528<br />
5,154,496<br />
4,365,190<br />
5,416,842<br />
3,376,088<br />
1,380,233<br />
2,967,561<br />
393,810<br />
980,012<br />
1,750,009<br />
637,010<br />
5,822,982<br />
685,047<br />
15,733,924<br />
5,464,617<br />
196,339<br />
5,234,083<br />
2,431,757<br />
2,013,844<br />
6,259,240<br />
447,356<br />
2,549,327<br />
358,708<br />
3,544,742<br />
11,901,153<br />
2,601,398<br />
247,578<br />
5,315,888<br />
3,721,762<br />
430,624<br />
2,688,707<br />
435,601<br />
Source: IRS <strong>Statistics</strong> of Income, August 2007: http://www.irs.gov/taxstats/article/0,,id=171535,00.html. Prepared by the <strong>National</strong> <strong>Center</strong> <strong>for</strong> <strong>Charitable</strong> <strong>Statistics</strong> at the <strong>Urban</strong> <strong>Institute</strong><br />
45,313<br />
48,212<br />
54,772<br />
41,483<br />
62,317<br />
58,327<br />
78,650<br />
57,537<br />
69,786<br />
57,289<br />
50,846<br />
50,376<br />
45,976<br />
57,456<br />
46,581<br />
45,780<br />
48,716<br />
43,621<br />
43,857<br />
44,698<br />
63,614<br />
67,125<br />
49,628<br />
56,114<br />
38,766<br />
47,025<br />
40,878<br />
46,358<br />
62,780<br />
57,724<br />
67,981<br />
42,427<br />
63,360<br />
47,955<br />
42,216<br />
46,237<br />
44,654<br />
49,240<br />
51,047<br />
52,800<br />
44,725<br />
44,036<br />
46,374<br />
52,136<br />
49,541<br />
47,457<br />
60,629<br />
57,530<br />
40,231<br />
49,750<br />
57,610<br />
4,620<br />
3,131<br />
3,533<br />
5,538<br />
3,931<br />
3,450<br />
3,872<br />
3,568<br />
6,208<br />
4,086<br />
4,207<br />
2,883<br />
4,021<br />
3,569<br />
3,326<br />
2,990<br />
3,891<br />
3,240<br />
3,574<br />
2,447<br />
3,853<br />
3,390<br />
3,196<br />
3,267<br />
4,457<br />
3,562<br />
2,824<br />
3,871<br />
4,082<br />
2,679<br />
3,100<br />
3,019<br />
4,653<br />
3,859<br />
3,364<br />
2,773<br />
5,289<br />
2,925<br />
3,296<br />
2,333<br />
4,102<br />
5,099<br />
5,161<br />
4,707<br />
6,241<br />
2,610<br />
3,650<br />
3,412<br />
3,172<br />
2,622<br />
7,744<br />
3
Appendix A: Data on <strong>2005</strong> Itemized <strong>Charitable</strong> Contributions from the IRS <strong>Statistics</strong> of Income<br />
Total number of<br />
income tax<br />
returns<br />
Average adjusted gross<br />
income (AGI) per return<br />
Number of returns with<br />
itemized charitable<br />
contributions<br />
Number Dollars (actual) State rank* Number % of return<br />
Total charitable<br />
contributions<br />
itemized on<br />
return<br />
Average charitable<br />
contributions per return<br />
with itemized charitable<br />
contributions<br />
Dollars<br />
(in thousands) Dollars (actual) State rank*<br />
Average charitable<br />
contributions per return<br />
Dollars<br />
(actual)<br />
State<br />
rank* %<br />
United States 133,663,209 $ 54,637<br />
41,275,243 30.9% $ 181,008,825 $ 4,385<br />
$ 1,354<br />
2.5%<br />
New England 6,848,631 65,088 2,444,378 35.7 9,106,955 3,726 1,330 2.0<br />
Average charitable<br />
contributions per<br />
return as a percentage<br />
of AGI per return<br />
Connecticut 1,681,956 78,650 1 677,964 40.3 2,928,293 4,319 23 1,741 6 2.2 3<br />
Maine 621,150 44,698 41 166,070 26.7 481,528 2,900 50 775 49 1.7 4<br />
Massachusetts 3,083,021 67,125 4 1,149,732 37.3 4,365,190 3,797 35 1,416 15 2.1 3<br />
New Hampshire 650,233 57,724 11 201,911 31.1 637,010 3,155 48 980 38 1.7 4<br />
Rhode Island 502,440 52,800 19 172,490 34.3 447,356 2,594 51 890 44 1.7 4<br />
Vermont 309,831 47,457 31 76,211 24.6 247,578 3,249 47 799 47 1.7 4<br />
Middle Atlantic 18,735,706 60,529 6,442,916 34.4 27,816,146 4,317 1,485 2.5<br />
New Jersey 4,152,741 67,981 3 1,697,824 40.9 5,822,982 3,430 43 1,402 17 2.1 4<br />
New York 8,715,913 63,360 6 3,071,129 35.2 15,733,924 5,123 11 1,805 4 2.8 2<br />
Pennsylvania<br />
East North<br />
5,867,052 51,047 21 1,673,963 28.5 6,259,240 3,739 37 1,067 34 2.1 3<br />
Central 21,398,258 50,502 6,544,652 30.6 23,921,006 3,655 1,118 2.2<br />
Illinois 5,836,193 57,456 15 1,867,448 32.0 7,616,811 4,079 28 1,305 25 2.3 3<br />
Indiana 2,883,701 46,581 33 744,916 25.8 2,964,563 3,980 32 1,028 35 2.2 3<br />
Michigan 4,562,770 49,628 25 1,489,540 32.6 5,416,842 3,637 40 1,187 31 2.4 2<br />
Ohio 5,459,548 46,237 36 1,565,330 28.7 5,234,083 3,344 45 959 41 2.1 4<br />
Wisconsin<br />
West North<br />
2,656,046 49,750 24 877,418 33.0 2,688,707 3,064 49 1,012 36 2.0 4<br />
Central 9,134,934 49,163 2,656,013 29.1 10,675,779 4,019 1,169 2.4<br />
Iowa 1,346,535 45,780 38 369,998 27.5 1,284,346 3,471 42 954 42 2.1 4<br />
Kansas 1,241,568 48,716 28 335,194 27.0 1,512,725 4,513 18 1,218 29 2.5 2<br />
Minnesota 2,445,599 56,114 17 914,303 37.4 3,376,088 3,693 38 1,380 19 2.5 2<br />
Missouri 2,610,839 47,025 32 706,497 27.1 2,967,561 4,200 25 1,137 33 2.4 2<br />
Nebraska 816,053 46,358 35 223,314 27.4 980,012 4,388 20 1,201 30 2.6 2<br />
North Dakota 307,235 42,216 47 48,536 15.8 196,339 4,045 30 639 50 1.5 4<br />
South Dakota 367,105 44,036 43 58,171 15.8 358,708 6,166 6 977 39 2.2 3<br />
South Atlantic 25,748,523 54,740 8,287,795 32.2 38,072,084 4,594 1,479 2.7<br />
Delaware 402,938 57,537 13 132,255 32.8 534,422 4,041 31 1,326 24 2.3 3<br />
District of Columb 282,474 69,786 2 105,252 37.3 747,791 7,105 2 2,647 1 3.8 1<br />
Florida 8,411,496 57,289 16 2,322,181 27.6 11,346,130 4,886 12 1,349 22 2.4 3<br />
Georgia 3,917,976 50,846 22 1,365,436 34.9 6,528,789 4,781 15 1,666 7 3.3 1<br />
Maryland 2,674,329 63,614 5 1,192,798 44.6 5,154,496 4,321 22 1,927 3 3.0 1<br />
North Carolina 3,879,609 47,955 30 1,246,872 32.1 5,464,617 4,383 21 1,409 16 2.9 1<br />
South Carolina 1,885,351 44,725 40 551,156 29.2 2,549,327 4,625 16 1,352 21 3.0 1<br />
Virginia 3,540,757 60,629 9 1,263,525 35.7 5,315,888 4,207 24 1,501 11 2.5 2<br />
West Virginia<br />
East South<br />
753,593 40,231 50 108,320 14.4 430,624 3,975 33 571 51 1.4 4<br />
Central 7,563,158 44,275 1,863,211 24.6 9,506,309 5,102 1,257 2.8<br />
Alabama 1,955,914 45,313 39 541,002 27.7 2,785,924 5,150 10 1,424 13 3.1 1<br />
Kentucky 1,779,856 43,621 45 473,007 26.6 1,795,410 3,796 36 1,009 37 2.3 3<br />
Mississippi 1,169,598 38,766 51 262,176 22.4 1,380,233 5,265 9 1,180 32 3.0 1<br />
Tennessee<br />
West South<br />
2,657,790 46,374 34 587,026 22.1 3,544,742 6,038 7 1,334 23 2.9 1<br />
Central 14,146,986 49,441 3,100,502 21.9 17,584,509 5,672 1,243 2.5<br />
Arkansas 1,153,654 41,483 48 244,006 21.2 1,594,538 6,535 4 1,382 18 3.3 1<br />
Louisiana 1,770,050 43,857 44 369,163 20.9 1,657,061 4,489 19 936 43 2.1 3<br />
Oklahoma 1,495,579 44,654 42 391,399 26.2 2,431,757 6,213 5 1,626 8 3.6 1<br />
Texas 9,727,703 52,136 20 2,095,934 21.5 11,901,153 5,678 8 1,223 28 2.3 3<br />
Mountain 8,968,803 53,675 2,863,407 31.9 13,264,723 4,632 1,479 2.8<br />
Arizona 2,474,093 54,772 18 826,288 33.4 3,373,704 4,083 26 1,364 20 2.5 2<br />
Colorado 2,160,153 58,327 10 773,847 35.8 3,152,757 4,074 29 1,460 12 2.5 2<br />
Idaho 613,932 45,976 37 181,860 29.6 872,397 4,797 14 1,421 14 3.1 1<br />
Montana 448,050 40,878 49 114,960 25.7 393,810 3,426 44 879 45 2.2 3<br />
Nevada 1,150,204 62,780 7 361,102 31.4 1,750,009 4,846 13 1,521 10 2.4 2<br />
New Mexico 843,476 42,427 46 186,402 22.1 685,047 3,675 39 812 46 1.9 4<br />
Utah 1,030,683 49,541 26 375,675 36.4 2,601,398 6,925 3 2,524 2 5.1 1<br />
Wyoming 248,212 57,610 12 43,273 17.4 435,601 10,066 1 1,755 5 3.0 1<br />
Pacific 21,118,210 60,050 7,072,369 33.5 31,061,314 4,392 1,471 2.4<br />
Alaska 346,927 48,212 29 70,814 20.4 275,757 3,894 34 795 48 1.6 4<br />
Cali<strong>for</strong>nia 15,572,877 62,317 8 5,336,371 34.3 24,450,235 4,582 17 1,570 9 2.5 2<br />
Hawaii 621,014 50,376 23 180,850 29.1 599,716 3,316 46 966 40 1.9 4<br />
Oregon 1,645,481 49,240 27 571,951 34.8 2,013,844 3,521 41 1,224 27 2.5 2<br />
Washington 2,931,911 57,530 14 912,383 31.1 3,721,762 4,079 27 1,269 26 2.2 3<br />
*Ranked 1 - 51: 1 = Highest, 51 = Lowest<br />
**Ranked 1 - 4: Quartile 1 is approximately the Highest 25%, Quartile 4 the Lowest 25%<br />
Source: IRS <strong>Statistics</strong> of Income, August 2007: http://www.irs.gov/taxstats/article/0,,id=171535,00.html<br />
Prepared by the <strong>National</strong> <strong>Center</strong> <strong>for</strong> <strong>Charitable</strong> <strong>Statistics</strong> at the <strong>Urban</strong> <strong>Institute</strong><br />
State<br />
quartile**<br />
4
Appendix B: Change in AGI and Average <strong>Charitable</strong> Contributions by State,<br />
Based on Contributions Itemized on Individual Income Tax Returns, 2000 – <strong>2005</strong><br />
2000 Dollars<br />
(actual)<br />
<strong>2005</strong> Dollars<br />
(actual)<br />
Percent<br />
Change<br />
2000-05<br />
2000 State<br />
rank*<br />
<strong>2005</strong> State<br />
rank*<br />
2000<br />
Dollars<br />
(actual)<br />
<strong>2005</strong><br />
Dollars<br />
(actual)<br />
Percent<br />
Change<br />
2000-<strong>2005</strong><br />
United States $ 48,470 54,637 12.7% $ 1,050 $1,354 29.0%<br />
New England 60,889<br />
Connecticut 70,428<br />
Maine 40,245<br />
Massachusetts 65,098<br />
New Hampshire 54,784<br />
Rhode Island 46,545<br />
Vermont 42,195<br />
Middle Atlantic 53,687<br />
New Jersey 62,273<br />
New York 55,300<br />
Pennsylvania 45,290<br />
East North Central 46,114<br />
Illinois 52,358<br />
Indiana 42,134<br />
Michigan 47,112<br />
Ohio 41,444<br />
Wisconsin 44,803<br />
West North Central 43,768<br />
Iowa 39,978<br />
Kansas 43,686<br />
Minnesota 50,304<br />
Missouri 42,310<br />
Nebraska 41,544<br />
North Dakota 35,451<br />
South Dakota 37,258<br />
South Atlantic 46,654<br />
Delaware 49,309<br />
District of Columbia 58,266<br />
Florida 46,490<br />
Georgia 46,327<br />
Maryland 54,600<br />
North Carolina 42,905<br />
South Carolina 38,583<br />
Virginia 51,243<br />
West Virginia 34,197<br />
East South Central 38,117<br />
Alabama 38,122<br />
Kentucky 38,313<br />
Mississippi 33,379<br />
Tennessee 40,147<br />
West South Central 43,004<br />
Arkansas 35,501<br />
Louisiana 36,910<br />
Oklahoma 37,426<br />
Texas 46,096<br />
Mountain 46,054<br />
Arizona 45,908<br />
Colorado 53,862<br />
Idaho 40,356<br />
Montana 34,233<br />
Nevada 51,220<br />
New Mexico 32,504<br />
Utah 42,753<br />
Wyoming 46,861<br />
Pacific 55,834<br />
Alaska 42,477<br />
Cali<strong>for</strong>nia 58,159<br />
Hawaii 41,821<br />
Oregon 44,986<br />
Washington 53,957<br />
Average adjusted gross income per income tax return Average charitable contribution per return<br />
65,088 6.9 1,149<br />
78,650 11.7 1 1 1,410<br />
44,698 11.1 37 41 666<br />
67,125 3.1 2 4 1,275<br />
57,724 5.4 7 11 788<br />
52,800 13.4 18 19 780<br />
47,457 12.5 31 31 731<br />
60,529 12.7 1,175<br />
67,981 9.2 3 3 1,209<br />
63,360 14.6 6 6 1,372<br />
51,047 12.7 23 21 859<br />
50,502 9.5 896<br />
57,456 9.7 11 15 1,019<br />
46,581 10.6 32 33 832<br />
49,628 5.3 16 25 975<br />
46,237 11.6 35 36 768<br />
49,750 11.0 25 24 829<br />
49,163 12.3 924<br />
45,780 14.5 39 38 743<br />
48,716 11.5 26 28 941<br />
56,114 11.5 14 17 1,119<br />
47,025 11.1 30 32 882<br />
46,358 11.6 34 35 1,035<br />
42,216 19.1 47 47 510<br />
44,036 18.2 44 43 652<br />
54,740 17.3 1,123<br />
57,537 16.7 15 13 1,056<br />
69,786 19.8 4 2 2,085<br />
57,289 23.2 19 16 971<br />
50,846 9.8 20 22 1,287<br />
63,614 16.5 8 5 1,475<br />
47,955 11.8 27 30 1,122<br />
44,725 15.9 40 40 1,034<br />
60,629 18.3 12 9 1,144<br />
40,231 17.6 49 50 438<br />
44,275 16.2 913<br />
45,313 18.9 42 39 1,062<br />
43,621 13.9 41 45 778<br />
38,766 16.1 50 51 846<br />
46,374 15.5 38 34 926<br />
49,441 15.0 872<br />
41,483 16.9 46 48 869<br />
43,857 18.8 45 44 689<br />
44,654 19.3 43 42 999<br />
52,136 13.1 21 20 890<br />
53,675 16.5 1,122<br />
54,772 19.3 22 18 983<br />
58,327 8.3 10 10 1,141<br />
45,976 13.9 36 37 1,087<br />
40,878 19.4 48 49 665<br />
62,780 22.6 13 7 988<br />
42,427 30.5 51 46 559<br />
49,541 15.9 28 26 2,118<br />
57,610 22.9 17 12 1,426<br />
60,050 7.6 1,232<br />
48,212 13.5 29 29 684<br />
62,317 7.1 5 8 1,325<br />
50,376 20.5 33 23 779<br />
49,240 9.5 24 27 1,017<br />
57,530 6.6 9 14 1,012<br />
*Ranked 1 - 51: 1 = Highest, 51 = Lowest<br />
**Ranked 1 - 4: Quartile 1 is approximately the Highest 25%, Quartile 4 the Lowest 25%<br />
Source: IRS <strong>Statistics</strong> of Income, August 2007: http://www.irs.gov/taxstats/article/0,,id=171535,00.html Prepared by the <strong>National</strong> <strong>Center</strong> <strong>for</strong> <strong>Charitable</strong> <strong>Statistics</strong> at the <strong>Urban</strong> <strong>Institute</strong><br />
1,330 15.7<br />
2000 State<br />
rank*<br />
<strong>2005</strong> State<br />
rank*<br />
1,741 23.5 5 6<br />
775 16.4 46 49<br />
1,416 11.0 9 15<br />
980 24.3 37 38<br />
890 14.1 38 44<br />
799 9.3 43 47<br />
1,485 26.4<br />
1,402 16.0 10 17<br />
1,805 31.6 6 4<br />
1,067 24.2 33 34<br />
1,118 24.8<br />
1,305 28.1 20 25<br />
1,028 23.6 35 35<br />
1,187 21.8 26 31<br />
959 24.8 41 41<br />
1,012 22.1 36 36<br />
1,169 26.5<br />
954 28.4 42 42<br />
1,218 29.5 28 29<br />
1,380 23.4 14 19<br />
1,137 28.9 31 33<br />
1,201 16.0 18 30<br />
639 25.3 50 50<br />
977 49.9 48 39<br />
1,479 31.7<br />
1,326 25.6 17 24<br />
2,647 27.0 2 1<br />
1,349 38.9 27 22<br />
1,666 29.5 8 7<br />
1,927 30.7 3 3<br />
1,409 25.5 13 16<br />
1,352 30.8 19 21<br />
1,501 31.2 11 11<br />
571 30.5 51 51<br />
1,257 37.7<br />
1,424 34.1 16 13<br />
1,009 29.7 40 37<br />
1,180 39.5 34 32<br />
1,334 44.0 29 23<br />
1,243 42.5<br />
1,382 59.1 32 18<br />
936 35.9 44 43<br />
1,626 62.8 23 8<br />
1,223 37.5 30 28<br />
1,479 31.8<br />
1,364 38.7 25 20<br />
1,460 27.9 12 12<br />
1,421 30.7 15 14<br />
879 32.2 47 45<br />
1,521 54.0 24 10<br />
812 45.3 49 46<br />
2,524 19.2 1 2<br />
1,755 23.1 4 5<br />
1,471 19.4<br />
795 16.2 45 48<br />
1,570 18.5 7 9<br />
966 24.0 39 40<br />
1,224 20.3 21 27<br />
1,269 25.4 22 26<br />
5
Appendix C: Change in Average <strong>Charitable</strong> Contributions as a Percentage of AGI by State,<br />
Based on Contributions Itemized on Individual Income Tax Returns, 2000 - <strong>2005</strong><br />
Average charitable contribution per return as a percentage of<br />
adjusted gross income per return<br />
2000 Percent <strong>2005</strong> Percent<br />
Change<br />
2000-<strong>2005</strong><br />
United States 2.2 2.5% 0.3<br />
New England 1.9 2.0 0.1<br />
2000 State<br />
quartile**<br />
<strong>2005</strong> State<br />
quartile**<br />
Connecticut 2.0 2.2 0.2 3 3<br />
Maine 1.7 1.7 0.0 4 4<br />
Massachusetts 2.0 2.1 0.1 3 3<br />
New Hampshire 1.4 1.7 0.3 4 4<br />
Rhode Island 1.7 1.7 0.0 4 4<br />
Vermont 1.7 1.7 0.0 4 4<br />
Middle Atlantic 2.2 2.5 0.3<br />
New Jersey 1.9 2.1 0.2 3 4<br />
New York 2.5 2.8 0.3 1 2<br />
Pennsylvania 1.9 2.1 0.2 3 3<br />
East North Central 1.9 2.2 0.3<br />
Illinois 1.9 2.3 0.4 3 3<br />
Indiana 2.0 2.2 0.2 3 3<br />
Michigan 2.1 2.4 0.3 2 2<br />
Ohio 1.9 2.1 0.2 3 4<br />
Wisconsin 1.8 2.0 0.2 4 4<br />
West North Central 2.1 2.4 0.3<br />
Iowa 1.9 2.1 0.2 3 4<br />
Kansas 2.2 2.5 0.3 2 2<br />
Minnesota 2.2 2.5 0.3 2 2<br />
Missouri 2.1 2.4 0.3 2 2<br />
Nebraska 2.5 2.6 0.1 1 2<br />
North Dakota 1.4 1.5 0.1 4 4<br />
South Dakota 1.8 2.2 0.4 4 3<br />
South Atlantic 2.4 2.7 0.3<br />
Delaware 2.1 2.3 0.2 2 3<br />
District of Columbia 3.6 3.8 0.2 1 1<br />
Florida 2.1 2.4 0.3 2 3<br />
Georgia 2.8 3.3 0.5 1 1<br />
Maryland 2.7 3.0 0.3 1 1<br />
North Carolina 2.6 2.9 0.3 1 1<br />
South Carolina 2.7 3.0 0.3 1 1<br />
Virginia 2.2 2.5 0.3 2 2<br />
W est Virginia 1.3 1.4 0.1 4 4<br />
East South Central 2.4 2.8 0.4<br />
Alabama 2.8 3.1 0.3 1 1<br />
Kentucky 2.0 2.3 0.3 3 3<br />
Mississippi 2.5 3.0 0.5 1 1<br />
Tennessee 2.3 2.9 0.6 2 1<br />
West South Central 2.0 2.5 0.5<br />
Arkansas 2.4 3.3 0.9 2 1<br />
Louisiana 1.9 2.1 0.2 3 3<br />
Oklahoma 2.7 3.6 0.9 1 1<br />
Texas 1.9 2.3 0.4 3 3<br />
Mountain 2.4 2.8 0.4<br />
Arizona 2.1 2.5 0.4 2 2<br />
Colorado 2.1 2.5 0.4 2 2<br />
Idaho 2.7 3.1 0.4 1 1<br />
Montana 1.9 2.2 0.3 3 3<br />
Nevada 1.9 2.4 0.5 3 2<br />
New Mexico 1.7 1.9 0.2 4 4<br />
Utah 5.0 5.1 0.1 1 1<br />
W yoming 3.0 3.0 0.0 1 1<br />
Pacific 2.2 2.4 0.2<br />
Alaska 1.6 1.6 0.0 4 4<br />
Cali<strong>for</strong>nia 2.3 2.5 0.2 2 2<br />
Hawaii 1.9 1.9 0.0 3 4<br />
Oregon 2.3 2.5 0.2 2 2<br />
Washington 1.9 2.2 0.3 3 3<br />
*Ranked 1 - 51: 1 = Highest, 51 = Lowest<br />
**Ranked 1 - 4: Quartile 1 is approximately the Highest 25%, Quartile 4 the Lowest 25%<br />
Source: IRS <strong>Statistics</strong> of Income, August 2007: http://www.irs.gov/taxstats/article/0,,id=171535,00.html Prepared by the <strong>National</strong> <strong>Center</strong> <strong>for</strong> <strong>Charitable</strong> <strong>Statistics</strong> at the <strong>Urban</strong> <strong>Institute</strong><br />
6