Determination of Dissolved Inorganic Ammonium - Nutrient ...
Determination of Dissolved Inorganic Ammonium - Nutrient ...
Determination of Dissolved Inorganic Ammonium - Nutrient ...

Create successful ePaper yourself
Turn your PDF publications into a flip-book with our unique Google optimized e-Paper software.
<strong>Determination</strong> <strong>of</strong> <strong>Dissolved</strong> <strong>Inorganic</strong> <strong>Ammonium</strong> (NH4) in Fresh/Estuarine/Coastal<br />
Waters<br />
1. SCOPE and APPLICATION<br />
March 19, 2009<br />
1.1 <strong>Determination</strong> <strong>of</strong> ammonium is by the Bertholet Reaction in which a<br />
blue-colored compound, similar to indophenol, forms when a solution <strong>of</strong><br />
ammonium salt is added to sodium phenoxide. The method is used to<br />
analyze all ranges <strong>of</strong> salinity.<br />
1.2 A Method Detection Limit (MDL) <strong>of</strong> 0.003 mg NH4-N/L was<br />
determined as three times the standard deviation <strong>of</strong> seven low level<br />
replicates.<br />
1.3 The Quantitation Limit for NH4 was set at 0.010 mg NH4-N/L, or ten<br />
times the standard deviation <strong>of</strong> the MDL calculation.<br />
1.4 The method is suitable for NH4 concentrations 0.003 to 1.68 mg NH4-<br />
N/L.<br />
1.5 This procedure should be used by analysts experienced in the theory and<br />
application <strong>of</strong> aqueous inorganic analysis. Three months experience with<br />
an experienced analyst, certified in the analysis <strong>of</strong> ammonium in<br />
aqueous samples is required.<br />
1.6 This method can be used for all programs that require analysis <strong>of</strong><br />
dissolved ammonium.<br />
1.7 This procedure conforms to EPA Method 350.2 (1979).<br />
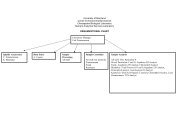
2. SUMMARY<br />
2.1 Filtered samples are complexed with sodium potassium tartrate and<br />
sodium citrate. The complexed sample reacts with alkaline phenol and<br />
hypochlorite, catalyzed by sodium nitroprusside, yielding an intense blue<br />
color suitable for photometric measurement.<br />
3. DEFINITIONS<br />
3.1 Acceptance Criteria – Specified limits placed on characteristics <strong>of</strong> an<br />
item, process, or service defined in a requirement document. (ASQC)<br />
3.2 Accuracy – The degree <strong>of</strong> agreement between an observed value and<br />
an accepted reference value. Accuracy includes a combination <strong>of</strong><br />
random error (precision) and systematic error (bias) components which<br />
are due to sampling and analytical operations; a data quality indicator.<br />
(QAMS)<br />
3.3 Aliquot – A discrete, measured, representative portion <strong>of</strong> a sample<br />
taken for analysis. (EPA QAD Glossary)<br />
3.4 Analytical Range – 0.010 to 1.68 mg NH4-N/L. The overall analytical<br />
range is comprised <strong>of</strong> two distinct concentration ranges. A separate<br />
calibration is performed for each range. These ranges include 0.010 to<br />
1
March 19, 2009<br />
0.168 mg NH4-N/L, and 0.168 to 1.68 mg NH4-N/L. Two sub-ranges<br />
are utilized so that samples can be analyzed on the most appropriate<br />
scale possible.<br />
3.5 Batch – Environmental samples, which are prepared and /or analyzed<br />
together with the same process and personnel, using the same lot(s) <strong>of</strong><br />
reagents. A preparation batch is composed <strong>of</strong> one to 200<br />
environmental samples <strong>of</strong> the same matrix, meeting the above<br />
mentioned criteria and with a maximum time between the start <strong>of</strong><br />
processing <strong>of</strong> the first and last sample in the batch to be 8 hours. An<br />
analytical batch is composed <strong>of</strong> prepared environmental samples<br />
(extracts, digestates, concentrates) and/or those samples not requiring<br />
preparation, which are analyzed together as a group using the same<br />
calibration curve or factor. An analytical batch can include samples<br />
originating from various environmental matrices and can exceed 20<br />
samples. (NELAC/EPA)<br />
3.6 Blank- A sample that has not been exposed to the analyzed sample<br />
stream in order to monitor contamination during sampling, transport,<br />
storage or analysis. The blank is subjected to the usual analytical and<br />
measurement process to establish a zero baseline or background value<br />
and is sometimes used to adjust or correct routine analytical results.<br />
(ASQC)<br />
3.7 Calibrate- To determine, by measurement or comparison with a<br />
standard, the correct value <strong>of</strong> each scale reading on a device. The<br />
levels <strong>of</strong> the applied calibration standard should bracket the range <strong>of</strong><br />
planned or expected sample measurements. (NELAC)<br />
3.8 Calibration – The set <strong>of</strong> operations which establish, under specified<br />
conditions, the relationship between values indicated by a measuring<br />
device. The levels <strong>of</strong> the applied calibration standard should bracket<br />
the range <strong>of</strong> planned or expected sample measurements. (NELAC)<br />
3.9 Calibration Blank – A volume <strong>of</strong> reagent water fortified with the same<br />
matrix as the calibration standards, without analyte added.<br />
3.10 Calibration Curve – The graphical relationship between known<br />
values, such as concentrations, or a series <strong>of</strong> calibration standards and<br />
their analytical response. (NELAC)<br />
3.11 Calibration Method – A defined technical procedure for<br />
performing a calibration. (NELAC)<br />
3.12 Calibration Standard – A substance or reference material used to<br />
calibrate an instrument. (QAMS)<br />
3.12.1 Initial Calibration Standard (STD) – A series <strong>of</strong> standard<br />
solutions used to initially establish instrument calibration<br />
responses and develop calibration curves for individual<br />
target analytes.<br />
3.12.2 Initial Calibration Verification (ICV) – An individual<br />
standard, distinct from the Initial Calibration Standards<br />
(STD), analyzed initially, prior to any sample analysis,<br />
2
March 19, 2009<br />
which verifies acceptability <strong>of</strong> the calibration curve or<br />
previously established calibration curve.<br />
3.12.3 Continuing Calibration Verification (CCV) – An individual<br />
standard, distinct from the Initial Calibration Standards<br />
(STD), analyzed after every 15-20 field sample analyses.<br />
3.13 Certified Reference Material – A reference material one or more <strong>of</strong><br />
whose property values are certified by a technically valid procedure,<br />
accompanied by or traceable to a certificate or other documentation<br />
which is issued by a certifying body. (ISO 17025)<br />
3.14 Corrective Action – Action taken to eliminate the causes <strong>of</strong> an<br />
existing nonconformity, defect or other undesirable situation in order<br />
to prevent recurrence. (ISO 8402)<br />
3.15 Deficiency – An unauthorized deviation from acceptable<br />
procedures or practices. (ASQC)<br />
3.16 Demonstration <strong>of</strong> Capability – A procedure to establish the ability<br />
<strong>of</strong> the analyst to generate acceptable accuracy. (NELAC)<br />
3.17 Detection Limit – The lowest concentration or amount <strong>of</strong> the target<br />
analyte that can be determined to be different from zero by a single<br />
measurement at a stated degree <strong>of</strong> confidence.<br />
3.18 Duplicate Analysis – The analyses <strong>of</strong> measurements <strong>of</strong> the variable<br />
<strong>of</strong> interest performed identically on two sub samples (aliquots) <strong>of</strong> the<br />
same sample. The results from duplicate analyses are used to evaluate<br />
analytical or measurement precision but not the precision <strong>of</strong> sampling,<br />
preservation or storage internal to the laboratory. (EPA-QAD)<br />
3.19 External Standard (ES) – A pure analyte (Sodium Nitrite (NaNO2))<br />
that is measured in an experiment separate from the experiment used<br />
to measure the analyte(s) in the sample. The signal observed for a<br />
known quantity <strong>of</strong> the pure external standard is used to calibrate the<br />
instrument response for the corresponding analyte(s). The instrument<br />
response is used to calculate the concentrations <strong>of</strong> the analyte(s) in the<br />
unknown sample.<br />
3.20 Field Duplicates (FD1 and FD2) – Two separate samples collected<br />
at the same time and place under identical circumstances and treated<br />
exactly the same throughout field and laboratory procedures. Analyses<br />
<strong>of</strong> FD1 and FD2 provide a measure <strong>of</strong> the precision associated with<br />
sample collection, preservation and storage, as well as with laboratory<br />
procedures.<br />
3.21 Holding time – The maximum time that samples may be held prior<br />
to analysis and still be considered valid. (40 CFR Part 136) The time<br />
elapsed from the time <strong>of</strong> sampling to the time <strong>of</strong> extraction or analysis,<br />
as appropriate.<br />
3.22 Laboratory Duplicates (LD1 and LD2) – Two aliquots <strong>of</strong> the same<br />
sample taken in the laboratory and analyzed separately with identical<br />
procedures. Analyses <strong>of</strong> LD1 and LD2 indicate precision associated<br />
with laboratory procedures, but not with sample collection,<br />
preservation, or storage procedures.<br />
3
March 19, 2009<br />
3.23 Laboratory Reagent Blank (LRB) – A blank matrix (i.e., DI water)<br />
that is treated exactly as a sample including exposure to all glassware,<br />
equipment, solvents, and reagents that are used with other samples.<br />
The LRB is used to determine if method analytes or other interferences<br />
are present in the laboratory environment, the reagents, or the<br />
instrument.<br />
3.24 Laboratory Control Sample (LCS) – A sample matrix, free from<br />
the analytes <strong>of</strong> interest, spiked with verified known amounts <strong>of</strong><br />
analytes from a source independent <strong>of</strong> the calibration standard or a<br />
material containing known and verified amounts <strong>of</strong> analytes. The LCS<br />
is generally used to establish intra-laboratory or analyst-specific<br />
precision and bias or to assess the performance <strong>of</strong> all or a portion <strong>of</strong><br />
the measurement system. (NELAC)<br />
3.25 Limit <strong>of</strong> Detection (LOD) – The lowest concentration level that<br />
can be determined by a single analysis and with a defined level <strong>of</strong><br />
confidence to be statistically different from a blank. (ACS)<br />
3.26 Limit <strong>of</strong> Quantitation (LOQ) – The minimum levels,<br />
concentrations, or quantities <strong>of</strong> a target variable (target analyte) that<br />
can be reported with a specified degree <strong>of</strong> confidence. The LOQ is set<br />
at 3 to 10 times the LOD, depending on the degree <strong>of</strong> confidence<br />
desired.<br />
3.27 Linear Dynamic Range (LDR) – The absolute quantity over which<br />
the instrument response to an analyte is linear. This specification is<br />
also referred to as the Linear Calibration Range (LCR).<br />
3.28 Material Safety Data Sheets (MSDS) – Written information<br />
provided by vendors concerning a chemical’s toxicity, health hazards,<br />
physical properties, fire, and reactivity data including storage, spill,<br />
and handling precautions.<br />
3.29 May – Denotes permitted action, but not required action.<br />
(NELAC)<br />
3.30 Method Detection Limit (MDL) – The minimum concentration <strong>of</strong><br />
an analyte that can be identified, measured, and reported with 99%<br />
confidence that the analyte concentration is greater than zero (Standard<br />
Methods).<br />
3.31 Must – Denotes a requirement that must be met. (Random House<br />
College Dictionary)<br />
3.32 Photometer – measures the absorbance <strong>of</strong> the solution in the cell in<br />
a multicell cuvette. Light passes from the lamp through the<br />
condensing lenses to the interference filter. The plane surface <strong>of</strong> the<br />
first condensing lens is coated with a material which reflects heat and<br />
infrared light. The filters are mounted on a filter wheel. There are 15<br />
positions for filters. Each filter corresponds to a wavelength <strong>of</strong><br />
interest. The 630 nm filter is specified by the test definition for<br />
ammonium. After passing through the filter the light is converted into<br />
a stream <strong>of</strong> light pulses by a chopper. Then the light is directed via a<br />
quartz fiber through a focusing lens and a slit to the beam divider. The<br />
4
March 19, 2009<br />
beam divider divides the light into two parts. A specified portion is<br />
reflected to the reference detector, which monitors the light level<br />
fluctuations. The remaining major portion <strong>of</strong> the light beam goes<br />
through the liquid in the cell to the signal detector, which measures the<br />
amount <strong>of</strong> light absorbed.<br />
3.33 Precision – The degree to which a set <strong>of</strong> observations or<br />
measurements <strong>of</strong> the same property, obtained under similar conditions,<br />
conform to themselves; a data quality indicator. Precision is usually<br />
expressed as standard deviation, variance or range, in either absolute<br />
or relative terms. (NELAC)<br />
3.34 Preservation – Refrigeration, freezing, and/or reagents added at the<br />
time <strong>of</strong> sample collection (or later) to maintain the chemical and or<br />
biological integrity <strong>of</strong> the sample.<br />
3.35 Quality Control Sample (QCS) – A sample <strong>of</strong> analyte <strong>of</strong> known<br />
and certified concentration. The QCS is obtained from a source<br />
external to the laboratory and different from the source <strong>of</strong> calibration<br />
standards. It is used to check laboratory performance with externally<br />
prepared test materials.<br />
3.36 Run Cycle – Typically a day <strong>of</strong> operation – the entire analytical<br />
sequence from sampling the first standard to the last sample <strong>of</strong> the day.<br />
3.37 Sample Segment – Bar-coded metal tray that holds up to fourteen<br />
four milliliter auto analyzer vials containing samples or standards.<br />
The user identifies each vial in the operating s<strong>of</strong>tware.<br />
3.38 Sample Segment Holder – An automated temperature controlled<br />
carousel that contains up to six sample segments. This carousel spins<br />
in clockwise or counterclockwise manner to move the sample<br />
segments into position for analysis. This carousel format allows for<br />
continuous processing.<br />
3.39 Sensitivity – The capability <strong>of</strong> a test method or instrument to<br />
discriminate between measurement responses representing different<br />
levels (concentrations) <strong>of</strong> a variable <strong>of</strong> interest.<br />
3.40 Shall – Denotes a requirement that is mandatory whenever the<br />
criterion for conformance with the specification requires that there be<br />
no deviation. (ANSI)<br />
3.41 Should – Denotes a guideline or recommendation whenever<br />
noncompliance with the specification is permissible. (ANSI)<br />
3.42 Standard Reference Material (SRM) – Material which has been<br />
certified for specific analytes by a variety <strong>of</strong> analytical techniques<br />
and/or by numerous laboratories using similar analytical techniques.<br />
These may consist <strong>of</strong> pure chemicals, buffers, or compositional<br />
standards. The materials are used as an indication <strong>of</strong> the accuracy <strong>of</strong> a<br />
specific analytical technique.<br />
3.43 Test Definition – A photometric test consisting <strong>of</strong> a user defined<br />
testing sequence, reagent additions, calibration standards, incubations<br />
and absorption results.<br />
5
4 INTERFERENCES<br />
5 SAFETY<br />
March 19, 2009<br />
3.44 Test Flow – Functions to define the parameter for reagent and<br />
sample dispensing, dilution, incubation and measurement.<br />
4.1 Suspended matter in the sample will scatter light as it passes through the<br />
cuvette to the detector. High blank responses will result. The identified<br />
sample will be reanalyzed.<br />
4.2 Blemishes in the cuvette, as result <strong>of</strong> the manufacturing process, will<br />
result in high blank responses. The identified sample will be reanalyzed.<br />
4.3 Seawater contains calcium and magnesium ions in sufficient<br />
concentrations to cause precipitation during analysis, reducing color<br />
production. Adding sodium potassium tartrate and sodium citrate reduces<br />
the interference.<br />
4.4 Eliminate any added acidity in samples because intensity <strong>of</strong> measured<br />
color is pH-dependent.<br />
5.1 Safety precautions must be taken when handling reagents, samples and equipment<br />
in the laboratory. Protective clothing including lab coats, safety glasses and<br />
enclosed shoes should be worn. In certain situations, it will be necessary to also<br />
use gloves and/or a face shield. If solutions come in contact with eyes, flush with<br />
water continuously for 15 minutes. If solutions come in contact with skin, wash<br />
thoroughly with soap and water. Contact Solomons Rescue Squad (911) if<br />
emergency treatment is needed and also inform the CBL Business Manager <strong>of</strong> the<br />
incident. Contact the CBL Business Manager if additional treatment is required.<br />
5.2 The toxicity or carcinogenicity <strong>of</strong> each reagent used in this procedure may not<br />
have been fully established. Each chemical should be regarded as a potential<br />
health hazard and exposure should be as low as reasonably achievable. Cautions<br />
are included for known hazardous materials and procedures.<br />
5.3 Do not wear jewelry when troubleshooting electrical components. Even low<br />
voltage points are dangerous and can injure if allowed to short circuit.<br />
5.4 The following hazard classifications are listed for the chemicals used in this<br />
procedure. Detailed information is provided on Material Safety Data Sheets<br />
(MSDS).<br />
Chemical Health Flammability Reactivity Contact Storage<br />
Sodium potassium tartrate 0 1 0 0 Green<br />
Sodium citrate 1 1 0 1 Green<br />
Sulfuric acid 4 0 2 4 White<br />
Phenol 3 2 1 4 White<br />
Stripe<br />
Sodium hydroxide 3 0 2 4 White<br />
Stripe<br />
6
Sodium nitroprusside 3 0 0 1 Blue<br />
Sodium hypochlorite<br />
(Clorox)<br />
3 0 2 4 White<br />
<strong>Ammonium</strong> sulfate 1 0 1 2 Green<br />
Chlor<strong>of</strong>orm 3 1 1 3 Blue<br />
On a scale <strong>of</strong> 0 to 4 the substance is rated on four hazard categories: health, flammability,<br />
reactivity, and contact. (0 is non-hazardous and 4 is extremely hazardous)<br />
STORAGE<br />
Red – Flammability Hazard: Store in a flammable liquid storage area.<br />
Blue – Health Hazard: Store in a secure poison area.<br />
Yellow – Reactivity Hazard: Keep separate from flammable and combustible materials.<br />
White – Contact Hazard: Store in a corrosion-pro<strong>of</strong> area.<br />
Green – Use general chemical storage (On older labels, this category was orange).<br />
Striped – Incompatible materials <strong>of</strong> the same color class have striped labels. These<br />
products should not be stored adjacent to substances with the same color label. Proper<br />
storage must be individually determined.<br />
6 EQUIPMENT AND SUPPLIES<br />
6.1 Aqaukem 250 multi-wavelength automated discrete photometric analyzer.<br />
Aquakem 250 control s<strong>of</strong>tware operates on a computer running Micros<strong>of</strong>t<br />
Windows NT or XP operating system.<br />
6.2 Freezer, capable <strong>of</strong> maintaining -20 ± 5° C.<br />
6.3 Lab ware – All reusable lab ware (glass, Teflon, plastic, etc) should be<br />
sufficiently clean for the task objectives. This laboratory cleans all lab ware<br />
related to this method with a 10% HCl (v/v) acid rinse.<br />
7 REAGENTS AND STANDARDS<br />
7.1 Purity <strong>of</strong> Water – Unless otherwise indicated, references to water shall be<br />
understood to mean reagent water conforming to Specification D 1193, Type I.<br />
Freshly prepared water should be used for making the standards intended for<br />
calibration. The detection limits <strong>of</strong> this method will be limited by the purity <strong>of</strong><br />
the water and reagents used to make the standards.<br />
7.2 Purity <strong>of</strong> Reagents – Reagent grade chemicals shall be used in all tests. Unless<br />
otherwise indicated, it is intended that all reagents shall conform to specifications<br />
<strong>of</strong> the Committee on Analytical Reagents <strong>of</strong> the American Chemical Society,<br />
where such specifications are available. Other grades may be used, provided it is<br />
first ascertained that the reagent is <strong>of</strong> sufficiently high purity to permit its use<br />
without compromising the accuracy <strong>of</strong> the determination.<br />
7.3 Complexing reagent<br />
Sodium potassium tartrate (KNaC4H4O6·4H2O) 3.9 g<br />
Sodium citrate (C6H8N2 O2S) 2.8 g<br />
Sulfuric acid (H2SO4), concentrated (sp. gr. 1.84) as required<br />
March 19, 2009<br />
7
In a 150 mL beaker, dissolve 3.9 g sodium potassium tartrate and 2.8 g<br />
sodium citrate in approximately 95 ml deionized water. Adjust the pH <strong>of</strong><br />
the solution to 5.0 using concentrated sulfuric acid. Transfer solution to a<br />
100 mL volumetric flask and bring to volume. Write name <strong>of</strong> preparer,<br />
preparation date, reagent manufacturer, manufacturer’s lot number in the<br />
Analytical Reagent log book. Store flask in dark at room temperature.<br />
Reagent is stable for two weeks. Discard if precipitate forms.<br />
7.4 Alkaline phenol solution<br />
Phenol (C6H5OH), 88% 23.6 mL<br />
Sodium hydroxide (NaOH), 50% (w/w) 18.0 g<br />
In a 250 mL volumetric flask, slowly add 23.6 mL <strong>of</strong> 88% phenol to<br />
approximately 150 mL deionized water. While in an ice bath, add exactly<br />
18 g <strong>of</strong> 50% (w/w) sodium hydroxide to the phenol/water solution. Bring<br />
flask to volume with deionized water. Store flask in light resistant<br />
container in refrigerator. Write name <strong>of</strong> preparer, preparation date, reagent<br />
manufacturer, manufacturer’s lot number in the Analytical Reagent log<br />
book. Reagent is stable for two weeks.<br />
WARNING: Phenol is extremely dangerous and should be handled<br />
accordingly. Prepare in an operating fume hood wearing protective gloves.<br />
7.5 Sodium hypochlorite, 1% –<br />
Sodium hypochlorite (Clorox Ultra – 6%) 44 mL<br />
Deionized water 200 mL<br />
In a 250 mL flask, dilute 44 mL <strong>of</strong> commercially available bleach<br />
containing 6% sodium hypochlorite with 200 mL deionized water. Write<br />
name <strong>of</strong> preparer, preparation date, manufacturer, date Clorox purchased<br />
in the Analytical Reagent log book. Reagent is stable for two days.<br />
7.6 Sodium nitroprusside (Sodium nitr<strong>of</strong>erricyanide), 0.05% –<br />
Sodium nitroprusside 0.5 g<br />
Deionized water up to 1000 mL<br />
In a 1000 mL flask, dissolve 0.5 g <strong>of</strong> sodium nitroprusside in 900 mL<br />
deionized water. Dilute to 1000 mL with deionized water. Write name <strong>of</strong><br />
preparer, preparation date, reagent manufacturer, manufacturer lot number<br />
in the Analytical Reagent log book. Reagent is stable for one year.<br />
7.7 <strong>Ammonium</strong> Stock Standard, 1,500 µM –<br />
<strong>Ammonium</strong> Sulfate [(NH4)2SO4], primary standard grade, dried at 45ºC<br />
0.100 g<br />
Deionized water up to 1000 mL<br />
March 19, 2009<br />
In a 1000 mL volumetric flask, dissolve 0.100 g <strong>of</strong> ammonium sulfate in<br />
~800 mL <strong>of</strong> deionized water. Dilute to 1000 mL with deionized water (1<br />
mL contains 1.5 µmoles N). Add 1 mL <strong>of</strong> chlor<strong>of</strong>orm as a preservative.<br />
Write name <strong>of</strong> preparer, preparation date, standard manufacturer,<br />
8
March 19, 2009<br />
manufacturer lot number in the Analytical Standard log book. Make fresh<br />
every 4 months.<br />
7.8 Working Regular <strong>Ammonium</strong> Standard –<br />
Stock <strong>Ammonium</strong> Standard 0.80 mL<br />
Deionized water up to 100 mL<br />
In a volumetric flask, dilute 0.80 mL <strong>of</strong> Stock <strong>Ammonium</strong> Standard to<br />
100 mL with deionized water to yield a concentration <strong>of</strong> 12 µM NH4 –N/L<br />
(0.168 mg N/L). Write name <strong>of</strong> preparer, preparation date, <strong>Ammonium</strong><br />
Stock Standard preparation date in the Analytical Standard log book.<br />
Make fresh every month.<br />
7.9 Working High <strong>Ammonium</strong> Standard –<br />
Stock <strong>Ammonium</strong> Standard 8.00 mL<br />
Deionized water up to 100 mL<br />
In a volumetric flask, dilute 8.00 mL <strong>of</strong> Stock <strong>Ammonium</strong> Standard to<br />
100 mL with deionized water to yield a concentration <strong>of</strong> 120 µM NH4 –<br />
N/L (1.68 mg N/L). Write name <strong>of</strong> preparer, preparation date, <strong>Ammonium</strong><br />
Stock Standard preparation date in the Analytical Standard log book.<br />
Make fresh every month.<br />
7.10 Aquakem Cleaning Solution –<br />
Clorox 75.0 mL<br />
In a 100 mL volumetric flask, dilute 75.0 mL <strong>of</strong> Clorox to volume with<br />
deionized water to yield a concentration <strong>of</strong> 75% Clorox. Write name <strong>of</strong><br />
preparer, preparation date, reagent manufacturer, manufacturer lot number<br />
in the Analytical Reagent log book. Reagent is stable for six months.<br />
8 SAMPLE COLLECTION, PRESERVATION, AND STORAGE<br />
8.1 Water collected for ammonium should be filtered through a Whatman GF/F<br />
glass fiber filter (nominal pore size 0.7 μm), or equivalent.<br />
8.2 Water collected for ammonium should be measured for salinity.<br />
8.3 Water collected for ammonium should be frozen at -20° C. The AutoAnalyzer<br />
vial container should be clean and sample rinsed.<br />
8.4 Frozen ammonium samples may be stored up to 28 days. It has been shown that<br />
frozen QCS samples up to a year old still fall well within the control limits.<br />
8.5 <strong>Ammonium</strong> samples may be refrigerated at 4° C for no longer than one day.<br />
9 QUALITY CONTROL<br />
9
9.1 The laboratory is required to operate a formal quality control (QC) program. The<br />
minimum requirements <strong>of</strong> this program consist <strong>of</strong> an initial demonstration <strong>of</strong><br />
laboratory capability and the continued analysis <strong>of</strong> laboratory instrument blanks<br />
and calibration standard material, analyzed as samples, as a continuing check on<br />
performance. The laboratory is required to maintain performance records that<br />
define the quality <strong>of</strong> data generated.<br />
9.2 Initial Demonstration <strong>of</strong> Performance<br />
March 19, 2009<br />
9.2.1 The initial demonstration <strong>of</strong> capability (nitrite) – is used to<br />
characterize instrument performance (MDLs) and laboratory<br />
performance (analysis <strong>of</strong> QC samples) prior to the analyses conducted<br />
by this procedure.<br />
9.2.2 Linear Dynamic Range – LDR (Linear Calibration Range) should be<br />
established for ammonium using appropriate five point calibration<br />
curve.<br />
9.2.3 Quality Control Sample (QCS/SRM) – When using this procedure, a<br />
quality control sample is required to be analyzed at the beginning and<br />
end <strong>of</strong> the run, to verify data quality and acceptable instrument<br />
performance. If the determined concentrations are not within ± 10%<br />
<strong>of</strong> the certified values, performance <strong>of</strong> the determinative step <strong>of</strong> the<br />
method is unacceptable. The source <strong>of</strong> the problem must be identified<br />
and corrected before either proceeding with the initial determination <strong>of</strong><br />
MDLs or continuing with analyses.<br />
9.2.4 Method Detection Limits (MDLs) – MDLs should be established for<br />
ammonium using a low level ambient water sample. To determine the<br />
MDL values, analyze seven replicate aliquots <strong>of</strong> water. Perform all<br />
calculations defined in the procedure (Section 12) and report the<br />
concentration values in the appropriate units. Calculate the MDL as<br />
follows:<br />
MDL = sx 3<br />
Where, s= Standard Deviation <strong>of</strong> the<br />
replicate analyses.<br />
9.2.5 MDLs shall be determined yearly and whenever there is a significant<br />
change in instrument response, a significant change in instrument<br />
configuration, or a new matrix is encountered.<br />
9.3 Assessing Laboratory Performance<br />
9.3.1 Laboratory Reagent Blank (LRB) – The laboratory must analyze at<br />
least one LRB with each batch <strong>of</strong> samples. The LRB consists <strong>of</strong><br />
Nanopure water treated the same as the samples. Analyte found in<br />
LRB indicates possible reagent or laboratory environment<br />
contamination. LRB data are used to assess and correct contamination<br />
from the laboratory environment. LRB above the lowest standard<br />
10
March 19, 2009<br />
requires that the source <strong>of</strong> the problem must be identified and<br />
corrected before proceeding with analyses.<br />
9.3.2 Quality Control Sample (QCS)/ Standard Reference Material (SRM) –<br />
When using this procedure, a quality control sample is required to be<br />
analyzed at the beginning <strong>of</strong> the run and end <strong>of</strong> the run, to verify data<br />
quality and acceptable instrument performance. If the determined<br />
concentrations are not within ± 3s <strong>of</strong> the certified values, performance<br />
<strong>of</strong> the determinative step <strong>of</strong> the method is unacceptable. The source <strong>of</strong><br />
the problem must be identified and corrected before either proceeding<br />
with the initial determination <strong>of</strong> MDLs or continuing with the<br />
analyses. The results <strong>of</strong> these QCS/SRM samples shall be used to<br />
determine batch acceptance.<br />
9.3.3 The QCS are obtained from a source external to the laboratory and<br />
different from the source <strong>of</strong> calibration standards.<br />
9.3.4 Control Charts – The Accuracy Control Chart for QCS/SRM samples<br />
is constructed from the average and standard deviation <strong>of</strong> the 20 most<br />
recent QCS/SRM measurements. The accuracy chart includes upper<br />
and lower warning levels (WL=±2s) and upper and lower control<br />
levels (CL=±3s). These values are derived from stated values <strong>of</strong> the<br />
QCS/SRM. The standard deviation (s) is specified relative to statistical<br />
confidence levels <strong>of</strong> 95% for WLs and 99% for CLs. Set up an<br />
accuracy chart by using percent recovery since the concentration <strong>of</strong> the<br />
QCS/SRM varies. Enter QCS/SRM results on the chart each time the<br />
sample is analyzed<br />
9.3.5 Continuing Calibration Verification (CCV) – Following every 18-23<br />
samples, one CCV <strong>of</strong> 6.0 µM NH4-N/L (0.126 mg N/L) Regular NH4,<br />
60 µM NH4-N/L (1.26 mg N/L) NH4HIGH, is analyzed to assess<br />
instrument performance. The CCVs are made from the same material<br />
as calibration standards [(NH4)2SO4], and are to be within TV ± 3s.<br />
Failure to meet the criteria requires correcting the problem, including<br />
reanalysis <strong>of</strong> any affected samples. If not enough sample exists, the<br />
data must be qualified if reported.<br />
9.3.6 Reagent Blank – The Reagent Blank Control Chart for Reagent Blank<br />
samples is constructed from the average and standard deviation <strong>of</strong> the<br />
20 most recent Reagent Blank measurements. The accuracy chart<br />
includes upper and lower warning levels (WL=±2s) and upper and<br />
lower control levels (CL=±3s). The standard deviation (s) is specified<br />
relative to statistical confidence levels <strong>of</strong> 95% for WLs and 99% for<br />
CLs. Enter Reagent Blank results on the chart each time the Reagent<br />
Blank is analyzed.<br />
9.4 Assessing Analyte Recovery - % Recovery<br />
9.4.1 Analyte recovery is assessed through percent recoveries <strong>of</strong> laboratory<br />
spikes <strong>of</strong> samples.<br />
9.4.2 % Recovery = (Spiked sample concentration – Sample concentration /<br />
Concentration <strong>of</strong> spike solution) X 100<br />
11
9.5 Assessing Analyte Precision – Relative Percent Difference<br />
9.5.1 Analyte replication is assessed through duplicate analyses <strong>of</strong> samples –<br />
Relative Percent Difference.<br />
9.5.2 RPD = (Laboratory Duplicate Result 1 – Laboratory Duplicate Result<br />
2)/[(Laboratory Duplicate Result 1 + Laboratory Duplicate Result<br />
2)/2] X 100<br />
9.6 Corrective Actions for Out <strong>of</strong> Control Data<br />
9.6.1 Control limit – If one measurement exceeds Accuracy Control Chart<br />
CL, repeat the analysis immediately. If the repeat measurement is<br />
within the CL, continue analyses; if it exceeds the CL, discontinue<br />
analyses and correct the problem.<br />
9.6.2 Warning limit – If two out <strong>of</strong> three successive points exceed Accuracy<br />
Control Chart WL, analyze another sample. If the next point is within<br />
WL, continue analyses; if the next point exceeds the WL, evaluate<br />
potential bias and correct the problem.<br />
9.6.3 Trending – If seven successive Accuracy Control Chart measurements<br />
are on the same side <strong>of</strong> the central line, discontinue analyses and<br />
correct the problem.<br />
9.6.4 When external QCS samples are out <strong>of</strong> control, correct the problem.<br />
Reanalyze the samples analyzed between the last in-control<br />
measurement and the out-<strong>of</strong>-control one.<br />
9.6.5 When external CCV samples are out <strong>of</strong> control, correct the problem.<br />
Reanalyze the samples analyzed between the last in-control<br />
measurement and the out-<strong>of</strong>-control one.<br />
9.7 General Operation - To assure optimal operation and analytical results, the<br />
Reagent Blank and CCV are tracked daily in the raw data file, copied to Reagent<br />
Blank and CCV Control Charts.<br />
10 CALIBRATION AND STANDARDIZATION<br />
10.1 Calibration – Daily calibration must be performed before sample analysis<br />
may begin. Five point calibrations are used with each <strong>of</strong> the two sub-calibrations<br />
that cover the analytical range. Two working nitrite standards are used to produce<br />
the calibrators for each set <strong>of</strong> two calibration curves. The instrument performs<br />
serial dilutions <strong>of</strong> working standards to produce the five calibrators defined for<br />
each curve. The following outlines the preparation <strong>of</strong> the working standards and<br />
the following table describes the subsequent serial dilutions the instrument<br />
performs to make each standard for each <strong>of</strong> the two calibration curves.<br />
<strong>Ammonium</strong> Working Standards:<br />
Regular NH4 (NH4CBL2)<br />
Working Standard 0.168 mg N/L (0.8 mL stock standard to100 mL)<br />
Working CCV 0.126 mg N/L (0.6 mL stock standard to 100 mL)<br />
March 19, 2009<br />
12
NH4HIGH<br />
Working Standard 1.68 mg N/L (8.0 mL stock standard to 100 mL)<br />
Working CCV 1.26 mg N/L (6.0 mL stock standard to 100 mL)<br />
Nitrite Calibrators:<br />
March 19, 2009<br />
Test Name<br />
Working<br />
Standard<br />
13<br />
Dilution<br />
Factor Concentration<br />
mg N/L<br />
NH4CBL2 0.168 mg N/L 1+9 0.0168<br />
0.168 mg N/L 1+4 0.0336<br />
0.168 mg N/L 1+2 0.056<br />
0.168 mg N/L 1+1 0.084<br />
0.168 mg N/L 1+0 0.168<br />
NH4HIGH 1.68 mg N/L 1+9 0.168<br />
1.68 mg N/L 1+6 0.24<br />
1.68 mg N/L 1+3 0.42<br />
1.68 mg N/L 1+2 0.56<br />
1.68 mg N/L 1+1 0.84<br />
1.68 mg N/L 1+0 1.68<br />
10.2 The instrument s<strong>of</strong>tware prepares a standard curve for each set <strong>of</strong> calibrators.<br />
A graph plotting measured absorbance against standard concentration is presented<br />
for review and approval. If acceptance criteria are not met the entire curve can be<br />
reanalyzed or individual standards can be reanalyzed. One standard value (original<br />
or reanalyzed) for each and every standard is incorporated in the curve. The<br />
coefficient <strong>of</strong> determination (Person’s r value) for the calibration curve as well as<br />
the calculated concentration <strong>of</strong> each calibrator is reviewed. The calculated value<br />
<strong>of</strong> each calibrator must be within ten percent <strong>of</strong> the expected value. The<br />
coefficient <strong>of</strong> determination (Person’s r value) for the calibration curve must be<br />
greater than 0.980.<br />
11 PROCEDURE – DAILY OPERATIONS QUALITY CONTROL<br />
11.1 Turn on computer. Computer will automatically initiate Konelab<br />
s<strong>of</strong>tware. Once s<strong>of</strong>tware is running, turn on instrument and allow connection<br />
between instrument and computer to complete.<br />
11.2 Discard any water remaining in the water reservoir from the previous<br />
analytical run. Fill the water reservoir with fresh deionozed water.<br />
11.3 Remove samples from freezer that will be analyzed that day. Allow<br />
samples to begin thawing. Begin daily bench sheet documentation.<br />
11.4 Once water reservoir is full, “perform washes” – complete five wash<br />
cycles and then initiate “start-up” at main menu.
11.5 Gather working standards and reagents from refrigerator or dark cabinet<br />
during startup. Assess standards and reagents. Remake anything that has<br />
exceeded the time over which it is considered stable.<br />
11.6 Once startup is complete, check that the instrument water blank <strong>of</strong> water<br />
from the reservoir has performed within acceptance limits. If any <strong>of</strong> the<br />
instrument functions are outside their predefined and s<strong>of</strong>tware controlled limits,<br />
the user will be notified on the main menu page. User takes corrective action to<br />
return instrument functions to controlled limits.<br />
11.7 Load reagents in specified position in reagent carousel and place in<br />
refrigerated reagent compartment.<br />
11.8 Load working standards in a sample segment, identify the standards in<br />
their positions from the drop down menus at the individual segment positions, and<br />
load into instrument.<br />
11.9 Select the methods to be calibrated. Two methods will be calibrated –<br />
NH4CBL2, and NH4HIGH are the method names to be selected in the s<strong>of</strong>tware.<br />
11.10 Begin calibration – See test flow below for stepwise instrument functions<br />
for the analysis <strong>of</strong> standards and samples.<br />
Test Flow – Method <strong>of</strong> Analysis, Stepwise<br />
• 100 μL sample to cuvette with mixing<br />
• 55 μL Complexing Reagent to cuvette with mixing<br />
• 33 μL Alkaline Phenol Reagent to cuvette with mixing<br />
• Blank response measurement at 630 nm<br />
• 26 μL Sodium Hypochlorite Reagent to cuvette with mixing<br />
• 33 μL Sodium Nitroprusside Reagent to cuvette with mixing<br />
• Incubation, 420 seconds, 37ºC<br />
• End point absorbance measurement, 630 nm<br />
• S<strong>of</strong>tware processes absorbance value, blank response value and uses<br />
calibration curve to calculate analyte concentration (mg/L N as NH4)<br />
• User is notified if any measured values used to calculate final<br />
concentration are outside preset limits. If so, analyst has options to<br />
accept result, rerun the sample or rerun the sample diluted to a user or<br />
s<strong>of</strong>tware specified factor.<br />
• User is notified <strong>of</strong> each blank response value. Blank response >0.005<br />
absorbance units indicates a scratched cuvette or turbid sample. If the<br />
blank response value exceeds 0.005 absorbance units, the analyst<br />
specifies that the sample is reanalyzed. If the blank response value <strong>of</strong><br />
the reanalyzed sample is 0.005 absorbance units is again obtained, the results are accepted.<br />
11.11 Organize samples, reagent blanks, check standards and all quality control<br />
samples while instrument performs calibrations.<br />
11.12 As calibration curves are produced by the instrument, review them for<br />
acceptability. The instrument s<strong>of</strong>tware prepares a standard curve for each set <strong>of</strong><br />
calibrators. A graph plotting measured absorbance against standard concentration<br />
is presented for review and approval. If acceptance criteria are not met, either the<br />
entire curve shall be reanalyzed or individual standards shall be reanalyzed,<br />
March 19, 2009<br />
14
depending on the violation. One standard value (original or reanalyzed) for each<br />
and every calibrator is incorporated in the curve.<br />
11.13 Once calibration curves are accepted, samples are loaded into the sample<br />
segments and loaded into the instrument for analysis. After the Reagent Blank,<br />
the first sample analyzed should be an ICV (initial calibration verification)<br />
sample. There should be one ICV sample for each calibration curve, <strong>of</strong> a<br />
concentration close to the middle <strong>of</strong> each range. The following are the usual ICV<br />
samples for each curve: 0.126 mg N/L for NH4CBL2 and 1.26 mg N/L for<br />
NH4HIGH.<br />
11.14 Samples are loaded into the segments and analyzed. CCV (Continuing<br />
Calibration Verification) samples (one for each <strong>of</strong> the three calibration ranges)<br />
follow every 18-23 samples. Standard Reference Material (SRM) samples, as<br />
well as Laboratory Reagent Blanks (LRB) are scattered throughout the analytical<br />
batch. Throughout the analytical batch, samples are chosen as laboratory<br />
duplicates and laboratory spikes to assess analyte precision and analyte recovery,<br />
respectively. The total number <strong>of</strong> duplicates and spikes performed will be equal<br />
or greater to ten percent <strong>of</strong> the total number <strong>of</strong> samples in the analytical batch.<br />
11.15 As sample analysis is complete, results must be reviewed and accepted<br />
manually. If results fall outside acceptance limits, the sample should be<br />
reanalyzed. If sample result exceeds the highest standard <strong>of</strong> the calibration range<br />
it was run within, the samples can be automatically diluted by the instrument and<br />
reanalyzed. If the result is such that it will fall within a higher calibration range, it<br />
should be reanalyzed in that range. If the result is such that it will fall within a<br />
lower calibration range, it should be reanalyzed within that range.<br />
11.16 User reviews salinity <strong>of</strong> samples. If any sample salinity concentration is<br />
greater than 20 ppt, the analyst reanalyzes the sample diluted to a user specified<br />
factor to obtain a salinity ≤ 10 ppt.<br />
11.17 Upon completion <strong>of</strong> all analysis, results are saved to a daily report file.<br />
The file is named by the run date. The daily report file for analytical batch <strong>of</strong><br />
January 1, 2005 would be named 010105. The file is converted to Micros<strong>of</strong>t<br />
Excel for data work up. Remaining samples are discarded.<br />
11.18 All reagents are removed from the reagent chamber and returned to the<br />
refrigerator or dark cabinet. Reagents that have exceeded their stability period are<br />
discarded.<br />
11.19 Aquakem Cleaning Solution is inserted into the instrument and shut down<br />
procedures are initiated. Daily files are cleared from the instrument s<strong>of</strong>tware, the<br />
s<strong>of</strong>tware is exited and the instrument is shut down. The computer is shut down.<br />
11.20 The waste is flushed down the drain with copious amounts <strong>of</strong> tap water.<br />
The waste cuvette box is moved to the fume hood.<br />
12 DATA ANALYSIS AND CALCULATIONS<br />
12.1 Upon completion <strong>of</strong> all analysis, results are saved to a daily report file.<br />
The file is named by the run date. The daily report file for analytical batch <strong>of</strong><br />
January 1, 2005 would be named 010105. The file is converted to Micros<strong>of</strong>t<br />
Excel for data work up. The instrument s<strong>of</strong>tware has calculated final sample<br />
March 19, 2009<br />
15
concentration from the designated standard curve, correcting each concentration<br />
for associated blank response and also for any user or instrument specified<br />
dilution. Dilution by the instrument is noted by s<strong>of</strong>tware as analysis ensues and,<br />
also, documented in the Excel data report file. The analyst examines each row <strong>of</strong><br />
data. Results are eliminated that are outside the limits <strong>of</strong> the calibration range, or<br />
have an unrepeated blank response measurement greater than 0.005 absorbance<br />
units.<br />
12.2 The analyst examines all data that were diluted and reanalyzed to obtain a<br />
diluted sample salinity <strong>of</strong> ≤ 10 ppt. If the response <strong>of</strong> the diluted sample is > 0.050<br />
absorbance units and the appropriate blank response as described in Section 11.10<br />
is also obtained, the results are accepted. If the response <strong>of</strong> the diluted sample is <<br />
0.050 absorbance units, CBL <strong>Nutrient</strong> Analytical Services Laboratory’s<br />
empirically derived salinity correction is applied to the original undiluted reported<br />
concentration.<br />
Salinity Corrected mg NH4-N/L=(((100-((-1.14 X ppt sample<br />
salinity)+116))/100)+1) X uncorrected mg NH4-N/L)<br />
13 METHOD PERFORMANCE<br />
13.1 On 49 separate dates from January through November 2008, Reagent<br />
Blanks were performed on NH4CBL as deionized water analyzed as a sample.<br />
This produced a mean value <strong>of</strong> 0.0032 mg NH4-N/L, SD 0.0048.<br />
13.2 On 52 separate dates from January through July 2008, 52 replicate<br />
analyses <strong>of</strong> SPEX® Corporation QC 6-42 NUT 1 were performed on NH4CBL2.<br />
This produced a mean value <strong>of</strong> 0.0583 mg NH4-N/L, SD 0.0045, Relative Percent<br />
Difference <strong>of</strong> 26% from the expected value <strong>of</strong> 0.079 ± 10%. This is a mean<br />
recovery <strong>of</strong> 74%.<br />
13.3 On 16 separate dates from November 2008 through February 2009, 15<br />
replicate analyses <strong>of</strong> SPEX® Corporation QC 6-50 NUT 1 were performed on<br />
NH4CBL2. This produced a mean value <strong>of</strong> 0.2078 mg NH4-N/L, SD 0.0253,<br />
Relative Percent Difference <strong>of</strong> 4% from the expected value <strong>of</strong> 0.200 ± 10%. This<br />
is a mean recovery <strong>of</strong> 104%.<br />
13.4 For some estuarine samples analyzed on NH4CBL in 2008, the mean<br />
difference in concentration between 76 duplicates analyzed on 13 separate dates<br />
was 0.0027 mg NH4-N/L. The standard deviation <strong>of</strong> the difference between<br />
duplicates was 0.0030 NH4-N/L.<br />
14 REFERENCES<br />
14.1 USEPA. 1979. Method No. 353.2 in Methods for chemical analysis <strong>of</strong><br />
water and wastes. United States Environmental Protection Agency, Office <strong>of</strong><br />
Research and Development. Cincinnati, Ohio. Report No. EPA-600/4-79-020<br />
March 1979. 460pp.<br />
14.2 Frank, J. M., C.F. Zimmermann and C. W. Keefe (2006). Comparison <strong>of</strong><br />
results from Konelab Aquakem 250 and existing nutrient analyzers. UMCES CBL<br />
<strong>Nutrient</strong> Analytical Services Laboratory, Dec. 2006.<br />
March 19, 2009<br />
16
14.3 Solorzano, L. 1969. <strong>Determination</strong> <strong>of</strong> ammonia in natural waters by the<br />
phenolhypochlorite method. Limnol. Oceanogr. 14:799-801.<br />
14.4 Parsons, T.R.,Y. Maita and C.M. 1984. A Manual <strong>of</strong> Chemical and<br />
Biological Methods for Seawater Analysis, Pergamon Press, Elmsford, N.Y.<br />
14.5 Kerouel, R. and A. Aminot. 1987. Procédure optimisée horscontaminations<br />
pour l’analyze des éléments nutritifs dissous dans l’eau de mer.<br />
Mar. Environ. Res 22:19-32.<br />
March 19, 2009<br />
17